Copyright
©2005 Baishideng Publishing Group Inc.
World J Gastroenterol. Mar 14, 2005; 11(10): 1508-1514
Published online Mar 14, 2005. doi: 10.3748/wjg.v11.i10.1508
Published online Mar 14, 2005. doi: 10.3748/wjg.v11.i10.1508
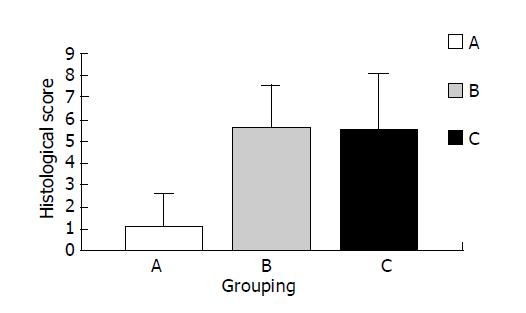
Figure 9 Changes of histological morphology in groups A, B, C.
A: enema with normal saline and normal saline given i.p. every 48 h starting from d 1. B: enema with TNBS/ethanol and normal saline given i.p. starting from d 1. C: enema with TNBS/ethanol and PDTC given (100 mg/kg) i.p. starting from d 1.
- Citation: Chen K, Long YM, Wang H, Lan L, Lin ZH. Activation of nuclear factor-kappa B and effects of pyrrolidine dithiocarbamate on TNBS-induced rat colitis. World J Gastroenterol 2005; 11(10): 1508-1514
- URL: https://www.wjgnet.com/1007-9327/full/v11/i10/1508.htm
- DOI: https://dx.doi.org/10.3748/wjg.v11.i10.1508


