Copyright
©2005 Baishideng Publishing Group Inc.
World J Gastroenterol. Mar 14, 2005; 11(10): 1496-1502
Published online Mar 14, 2005. doi: 10.3748/wjg.v11.i10.1496
Published online Mar 14, 2005. doi: 10.3748/wjg.v11.i10.1496
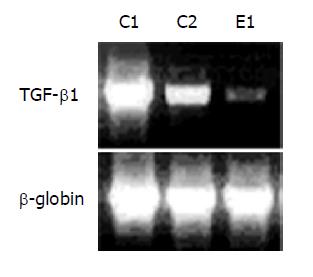
Figure 5 TGF-β1 RT-PCR analysis 2 d after liver irradiation.
C1: rats receiving EGT-control vector and 65 Gy of liver irradiation; C2: rats receiving EGT-control vector and 20 Gy of liver irradiation; E1: rats receiving EGT-HGF and 65 Gy of liver irradiation. Figure is the representative of 3 experiments.
- Citation: Chi CH, Liu IL, Lo WY, Liaw BS, Wang YS, Chi KH. Hepatocyte growth factor gene therapy prevents radiation-induced liver damage. World J Gastroenterol 2005; 11(10): 1496-1502
- URL: https://www.wjgnet.com/1007-9327/full/v11/i10/1496.htm
- DOI: https://dx.doi.org/10.3748/wjg.v11.i10.1496


