Copyright
©2005 Baishideng Publishing Group Inc.
World J Gastroenterol. Mar 14, 2005; 11(10): 1420-1425
Published online Mar 14, 2005. doi: 10.3748/wjg.v11.i10.1420
Published online Mar 14, 2005. doi: 10.3748/wjg.v11.i10.1420
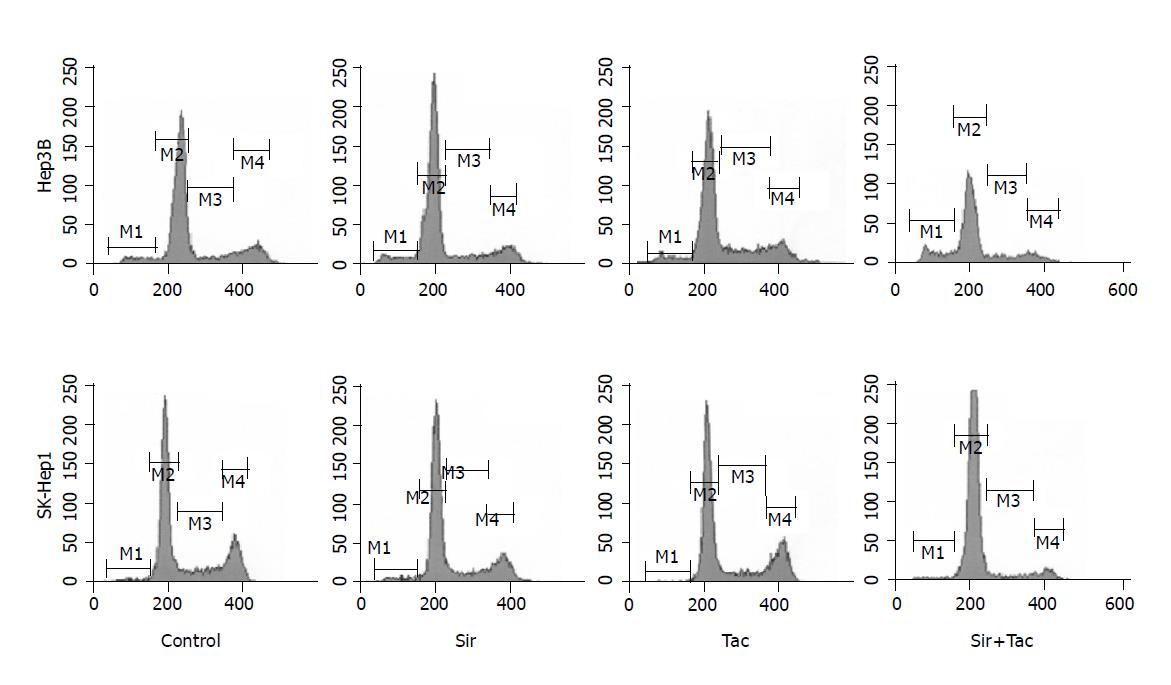
Figure 2 Cell-cycle analysis of both cell lines after treatment for 24 h with sirolimus, tacrolimus, or the combination of both at a dose of 25 ng/mL each compound.
M1 = Sub-G1 region, indicating cells with small DNA fragments, a typical feature of apoptosis; M2 = G1-Phase; M3 = S-Phase; M4 = G2/M-Phase. The different cell cycle phases (M1-M4) were set in a reference analysis and kept constant throughout the measurements.
- Citation: Schumacher G, Oidtmann M, Rueggeberg A, Jacob D, Jonas S, Langrehr JM, Neuhaus R, Bahra M, Neuhaus P. Sirolimus inhibits growth of human hepatoma cells alone or combined with tacrolimus, while tacrolimus promotes cell growth. World J Gastroenterol 2005; 11(10): 1420-1425
- URL: https://www.wjgnet.com/1007-9327/full/v11/i10/1420.htm
- DOI: https://dx.doi.org/10.3748/wjg.v11.i10.1420


