Copyright
©2005 Baishideng Publishing Group Inc.
World J Gastroenterol. Jan 7, 2005; 11(1): 73-78
Published online Jan 7, 2005. doi: 10.3748/wjg.v11.i1.73
Published online Jan 7, 2005. doi: 10.3748/wjg.v11.i1.73
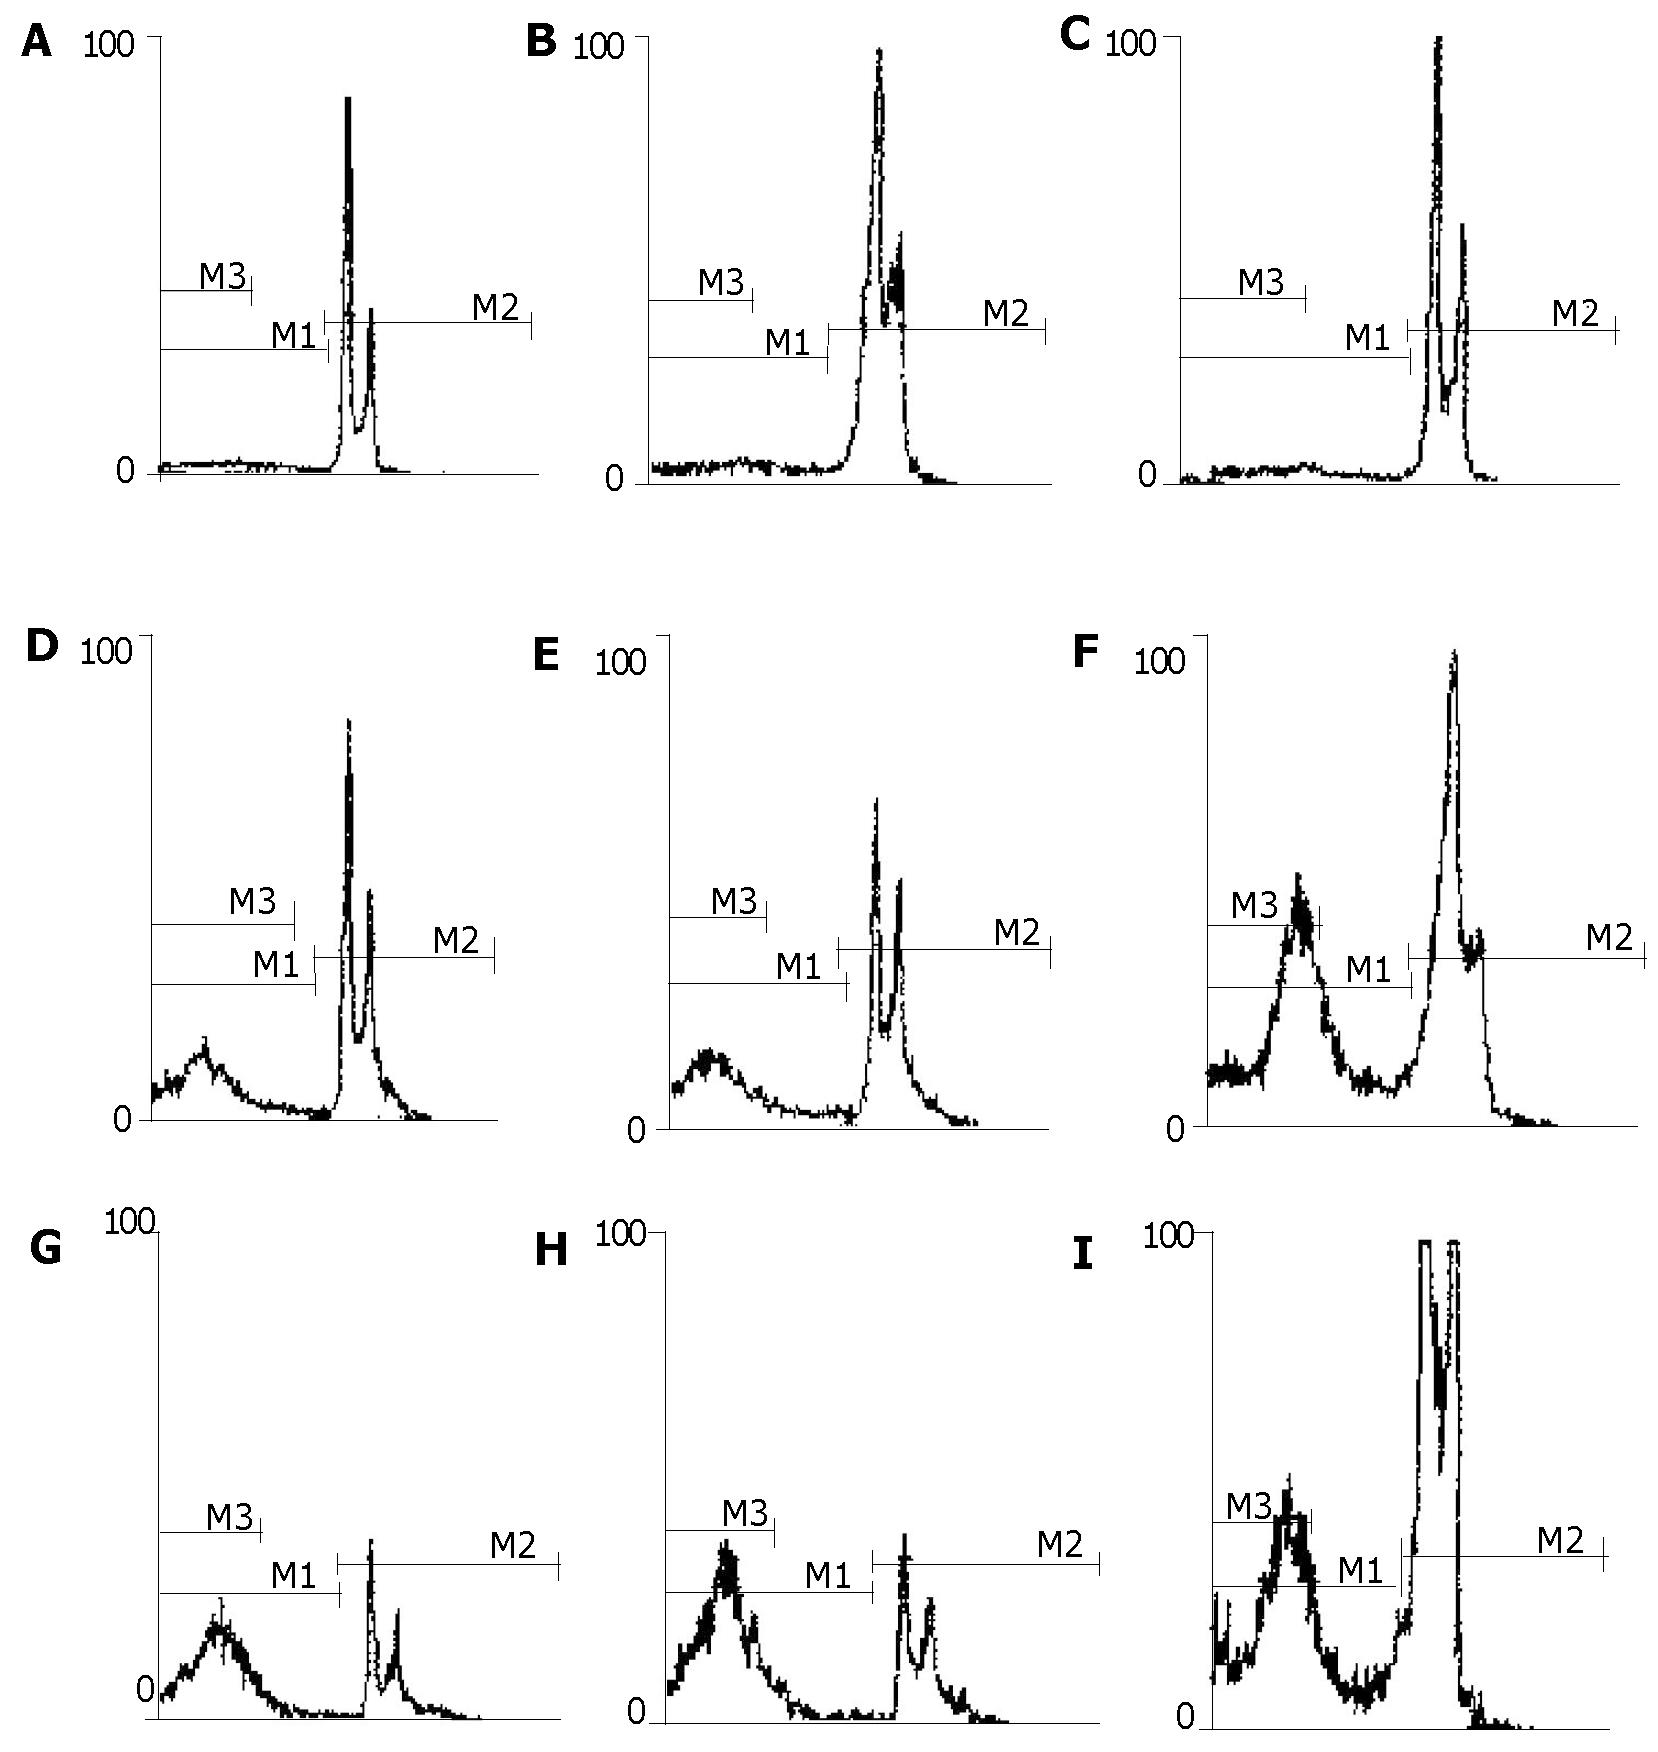
Figure 4 Representative DNA fluorescence histograms of fluorescence 2-height (FL-2-H) showing cell cycle distribution and apoptosis percentage.
A: untreated with HSP70 oligomer; B and C: treated with 10 μmol/L sense HSP70 oligomer for 48 h and 8 μmol/L for 72 h, respectively; D-I: treated with 6, 10 and 14 μmol/L antisense HSP70 oligomers for 48 h and 8 μmol/L for 24, 72 and 96 h, respectively.
- Citation: Zhao ZG, Shen WL. Heat shock protein 70 antisense oligonucleotide inhibits cell growth and induces apoptosis in human gastric cancer cell line SGC-7901. World J Gastroenterol 2005; 11(1): 73-78
- URL: https://www.wjgnet.com/1007-9327/full/v11/i1/73.htm
- DOI: https://dx.doi.org/10.3748/wjg.v11.i1.73


