Copyright
©2005 Baishideng Publishing Group Inc.
World J Gastroenterol. Jan 7, 2005; 11(1): 122-126
Published online Jan 7, 2005. doi: 10.3748/wjg.v11.i1.122
Published online Jan 7, 2005. doi: 10.3748/wjg.v11.i1.122
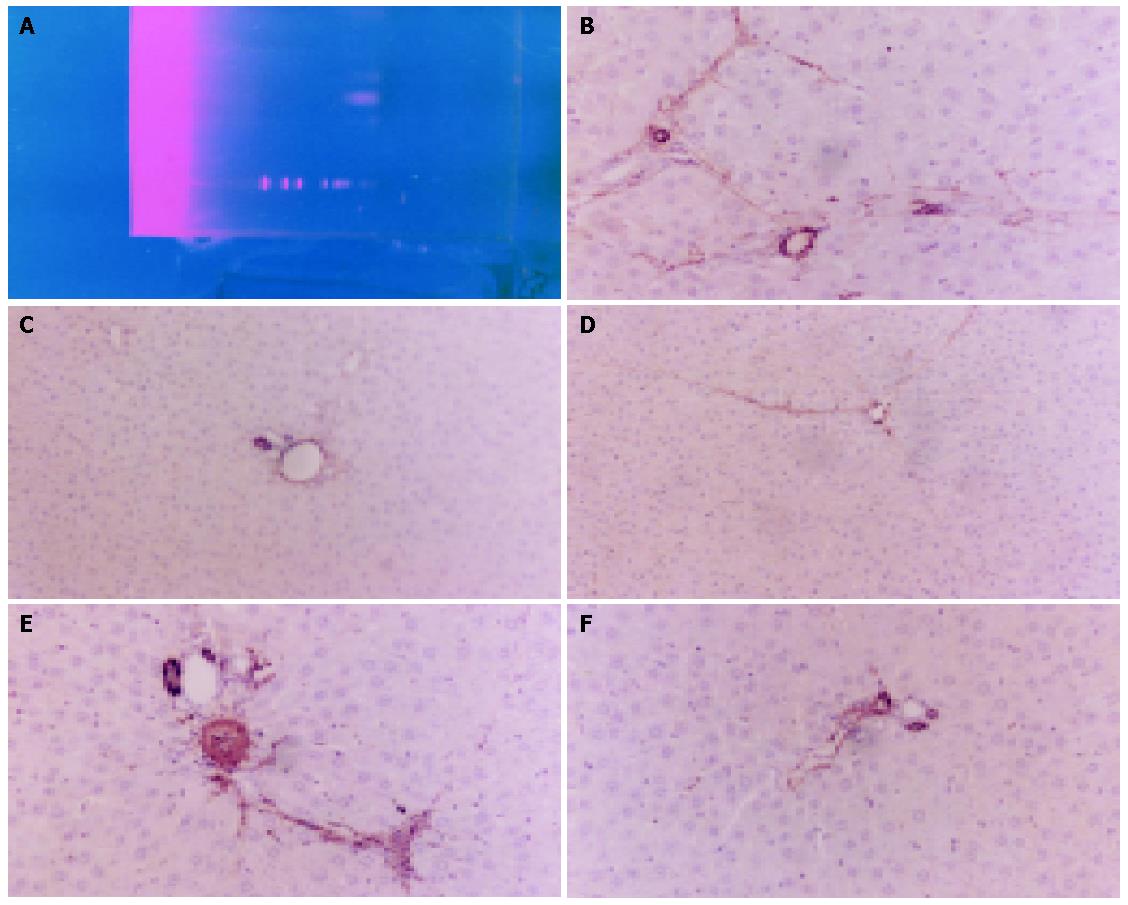
Figure 2 Expression of TGF-β1 in liver tissue.
A: RT-PCR products of TGF-β1 mRNA in liver tissue resolved on 1.0% agarose gel (M: markers;1: Control; 2: Model; 3: BR; 4: OM; 5: IFN-α); B: Results of model group rat liver specimens stained with IHC. Lots of α-SMA positive cells, hepatic cord lined up in disorder and fibrosis septum could be seen; C-F: Liver cells stained with IHC (×200) in control, BR, OM and IFN-alpha groups respectively.
-
Citation: Wu CS, Piao XX, Piao DM, Jin YR, Li CH. Treatment of pig serum-induced rat liver fibrosis with
Boschniakia rossica , oxymatrine and interferon-α. World J Gastroenterol 2005; 11(1): 122-126 - URL: https://www.wjgnet.com/1007-9327/full/v11/i1/122.htm
- DOI: https://dx.doi.org/10.3748/wjg.v11.i1.122


