Copyright
©The Author(s) 2004.
World J Gastroenterol. May 1, 2004; 10(9): 1365-1368
Published online May 1, 2004. doi: 10.3748/wjg.v10.i9.1365
Published online May 1, 2004. doi: 10.3748/wjg.v10.i9.1365
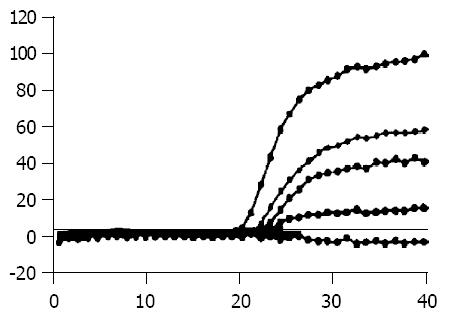
Figure 2 Map of real-time fluorescent quantitative RT-PCR.
Blue curve: Bcap37; Other color curves: Bcap37 cell clones trans-fected with pcDNA3.1(+)/MDR1; Red curve stands for the clone expressing higher P-gp level than others.
- Citation: Wang Y, Cao J, Zeng S. Establishment of a P-glycoprotein substrate screening model and its preliminary application. World J Gastroenterol 2004; 10(9): 1365-1368
- URL: https://www.wjgnet.com/1007-9327/full/v10/i9/1365.htm
- DOI: https://dx.doi.org/10.3748/wjg.v10.i9.1365


