Copyright
©The Author(s) 2004.
World J Gastroenterol. Apr 15, 2004; 10(8): 1152-1156
Published online Apr 15, 2004. doi: 10.3748/wjg.v10.i8.1152
Published online Apr 15, 2004. doi: 10.3748/wjg.v10.i8.1152
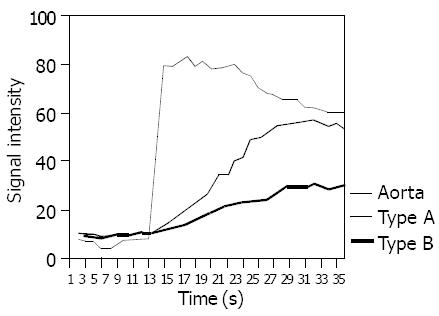
Figure 1 Signal intensity time curves of HCC in different groups before TACE.
Type A represents hypervascularity, type B shows mild hypervascularity or hypovascularity of the tumor.
- Citation: Zhao JG, Feng GS, Kong XQ, Li X, Li MH, Cheng YS. Assessment of hepatocellular carcinoma vascularity before and after transcatheter arterial chemoembolization by using first pass perfusion weighted MR imaging. World J Gastroenterol 2004; 10(8): 1152-1156
- URL: https://www.wjgnet.com/1007-9327/full/v10/i8/1152.htm
- DOI: https://dx.doi.org/10.3748/wjg.v10.i8.1152


