Copyright
©The Author(s) 2004.
World J Gastroenterol. Apr 1, 2004; 10(7): 959-964
Published online Apr 1, 2004. doi: 10.3748/wjg.v10.i7.959
Published online Apr 1, 2004. doi: 10.3748/wjg.v10.i7.959
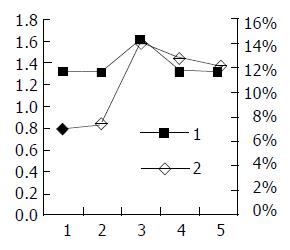
Figure 9 A two-axis broken line graph.
The abscissa repre-sents the days after transfection, and the two axis of ordinate are the relative figure of X gene expression and apoptosis rate: 1: X gene expression; 2: apoptosis rate.
- Citation: Chen HY, Tang NH, Li XJ, Zhang SJ, Chen ZX, Wang XZ. Transfection and expression of hepatitis B virus x gene and its effect on apoptosis in HL-7702 cells. World J Gastroenterol 2004; 10(7): 959-964
- URL: https://www.wjgnet.com/1007-9327/full/v10/i7/959.htm
- DOI: https://dx.doi.org/10.3748/wjg.v10.i7.959


