Copyright
©The Author(s) 2004.
World J Gastroenterol. Mar 15, 2004; 10(6): 813-818
Published online Mar 15, 2004. doi: 10.3748/wjg.v10.i6.813
Published online Mar 15, 2004. doi: 10.3748/wjg.v10.i6.813
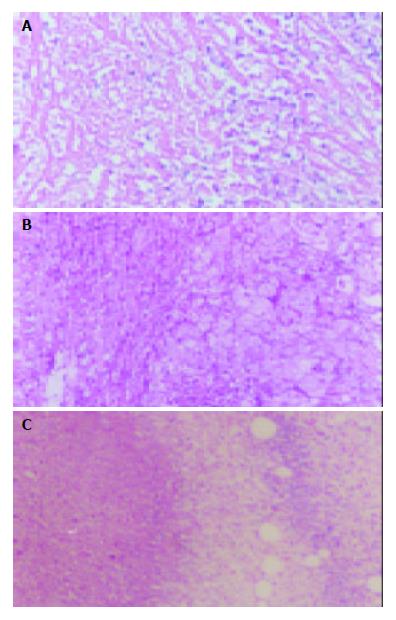
Figure 1 Pathological changes of tumor tissues 7 d after TAE.
A: Control group showing spotty and scattered necrosis. B: LP group showing many patched necrotic zones. C: LP+ODNs group showing big areas of central necrosis. Hematoxylin-eosin ×40.
- Citation: Wu HP, Feng GS, Liang HM, Zheng CS, Li X. Vascular endothelial growth factor antisense oligodeoxynucleotides with lipiodol in arterial embolization of liver cancer in rats. World J Gastroenterol 2004; 10(6): 813-818
- URL: https://www.wjgnet.com/1007-9327/full/v10/i6/813.htm
- DOI: https://dx.doi.org/10.3748/wjg.v10.i6.813


