Copyright
©The Author(s) 2004.
World J Gastroenterol. Mar 1, 2004; 10(5): 721-724
Published online Mar 1, 2004. doi: 10.3748/wjg.v10.i5.721
Published online Mar 1, 2004. doi: 10.3748/wjg.v10.i5.721
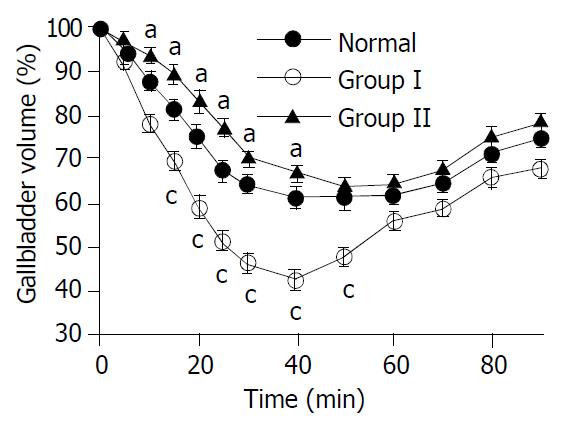
Figure 2 Gallbladder volume change after fatty meal in healthy volunteers (normal, n = 10), group I (symptom free or symp-tom improved after cholecystectomy) (n = 40) and group II (persistent dyspepsia after cholecystectomy) (n = 22) gallstone patients.
Values are mean ± SE (Χ2 test). aP < 0.05: significant difference between normal group and group II. cP < 0.05: sig-nificant differences among three groups (group I vs normals and group II patients).
- Citation: Chan DC, Chang TM, Chen CJ, Chen TW, Yu JC, Liu YC. Gallbladder contractility and volume characteristics in gallstone dyspepsia. World J Gastroenterol 2004; 10(5): 721-724
- URL: https://www.wjgnet.com/1007-9327/full/v10/i5/721.htm
- DOI: https://dx.doi.org/10.3748/wjg.v10.i5.721


