Copyright
©The Author(s) 2004.
World J Gastroenterol. Dec 15, 2004; 10(24): 3553-3558
Published online Dec 15, 2004. doi: 10.3748/wjg.v10.i24.3553
Published online Dec 15, 2004. doi: 10.3748/wjg.v10.i24.3553
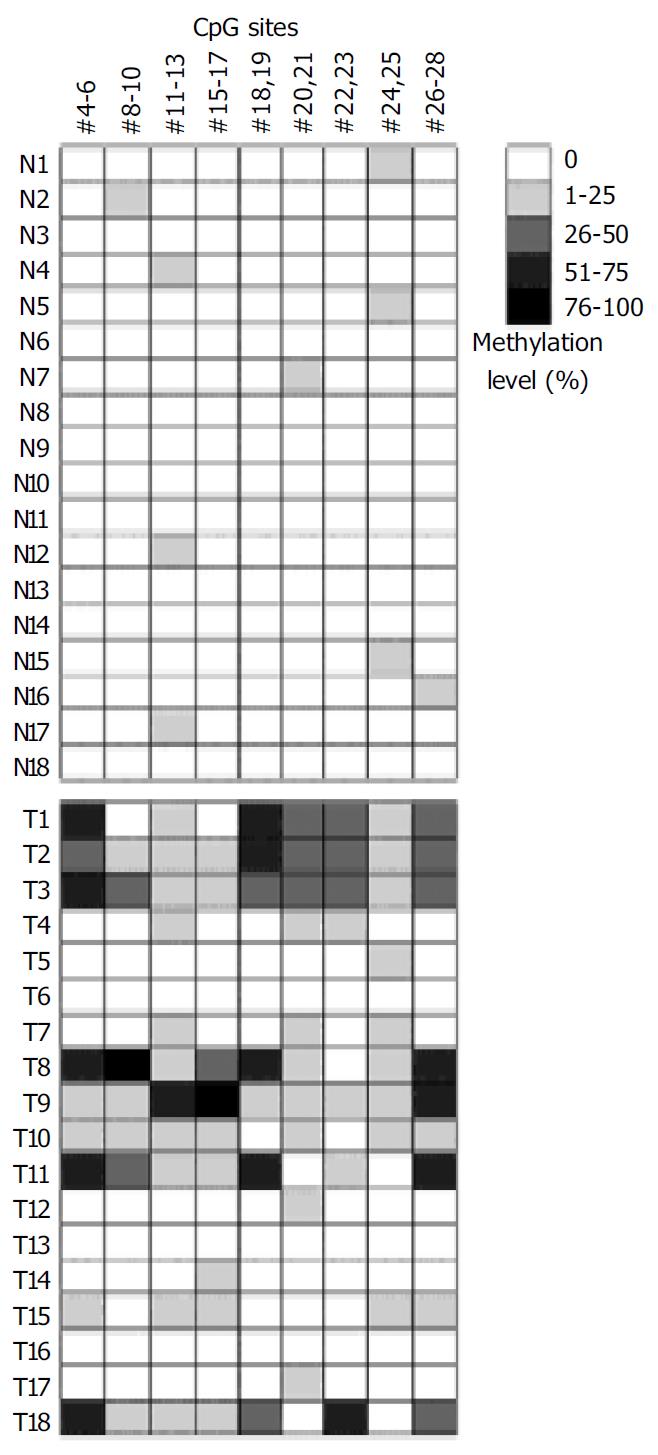
Figure 5 Methylation analysis of p16 gene CpG islands by oligonucleotide microarray.
Summaries of the microarray results are shown for 18 gastric tumors and corresponding normal tissues. Gray scale shown at right represents the me-thylation levels in percentage determined from the calibra-tion curve for the test CpG sites.
- Citation: Hou P, Shen JY, Ji MJ, He NY, Lu ZH. Microarray-based method for detecting methylation changes of p16Ink4a gene 5’-CpG islands in gastric carcinomas. World J Gastroenterol 2004; 10(24): 3553-3558
- URL: https://www.wjgnet.com/1007-9327/full/v10/i24/3553.htm
- DOI: https://dx.doi.org/10.3748/wjg.v10.i24.3553


