Copyright
©The Author(s) 2004.
World J Gastroenterol. Dec 1, 2004; 10(23): 3441-3454
Published online Dec 1, 2004. doi: 10.3748/wjg.v10.i23.3441
Published online Dec 1, 2004. doi: 10.3748/wjg.v10.i23.3441
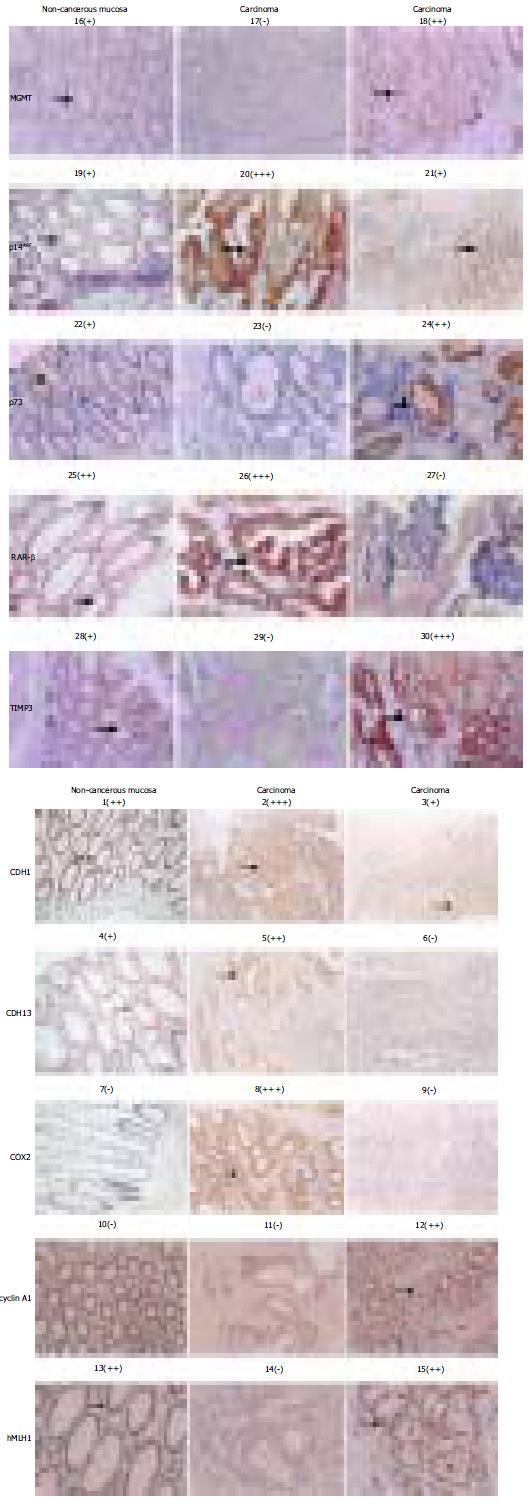
Figure 4 Immunochemical assessment of the expression level of each of 10 target genes.
Both the protein targets (left site to) and sample identities (top down) of the immuno-chemical stained picture are indicated. The signs: -, +, + +, and + + + in bracket are used to provide the quantitative reference in pictures below. The areas pointed by the arrows are the regions showing the immunostaining data quantified.
- Citation: Xu XL, Yu J, Zhang HY, Sun MH, Gu J, Du X, Shi DR, Wang P, Yang ZH, Zhu JD. Methylation profile of the promoter CpG islands of 31 genes that may contribute to colorectal carcinogenesis. World J Gastroenterol 2004; 10(23): 3441-3454
- URL: https://www.wjgnet.com/1007-9327/full/v10/i23/3441.htm
- DOI: https://dx.doi.org/10.3748/wjg.v10.i23.3441


