Copyright
©The Author(s) 2004.
World J Gastroenterol. Jan 15, 2004; 10(2): 279-283
Published online Jan 15, 2004. doi: 10.3748/wjg.v10.i2.279
Published online Jan 15, 2004. doi: 10.3748/wjg.v10.i2.279
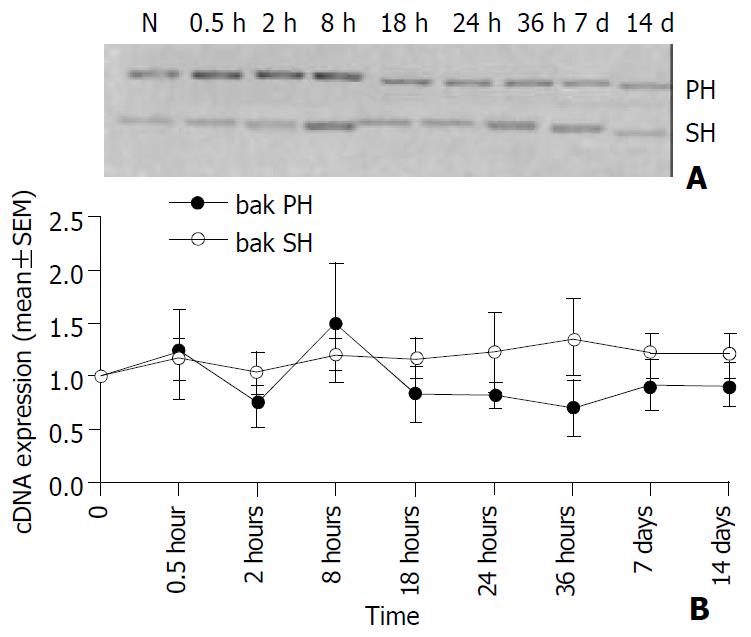
Figure 2 A: The expression of bax in 70% hepatectomized (PH) and sham (SH) groups shown in 1.
2% agarose gel. B: The quan-titated expression of bax in 70% PH (__·__) or sham (__o__) groups. Results were expressed as mean ± SEM of triplicate animals with n=3 rats per time point. The expressions were quantitated with the expression of cyclophilin for each sample and analyzed using the Multi-Analyst software. The expression at “time 0” denoted the quantitated expression of bax in normal liver and was accepted as “1”. In comparison among the mean values at each time point, it was revealed that the bax values in PH group were less than those in SH group (one-tailed P < 0.05, Mann Witney U test).
- Citation: Akcali KC, Dalgic A, Ucar A, Haj KB, Guvenc D. Expression of bcl-2 family of genes during resection induced liver regeneration: Comparison between hepatectomized and sham groups. World J Gastroenterol 2004; 10(2): 279-283
- URL: https://www.wjgnet.com/1007-9327/full/v10/i2/279.htm
- DOI: https://dx.doi.org/10.3748/wjg.v10.i2.279


