Copyright
©The Author(s) 2004.
World J Gastroenterol. Jan 15, 2004; 10(2): 205-208
Published online Jan 15, 2004. doi: 10.3748/wjg.v10.i2.205
Published online Jan 15, 2004. doi: 10.3748/wjg.v10.i2.205
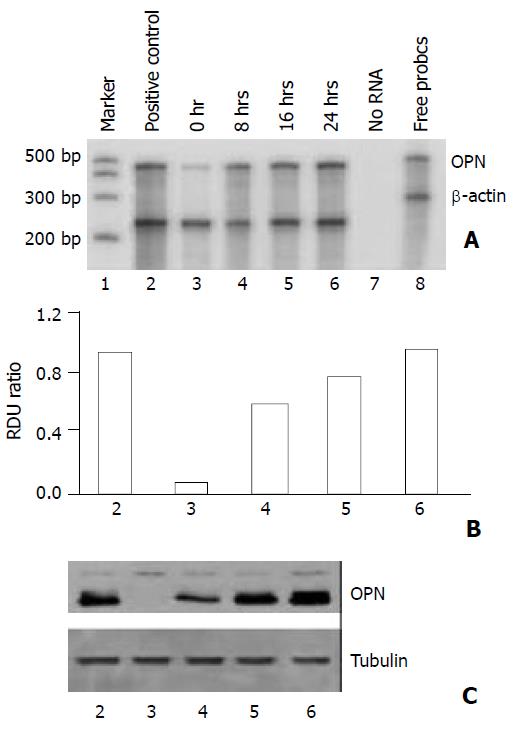
Figure 2 Time course showing effect of EGF on osteopontin expression in HepG2 cells.
1×10⁵ cells were plated in 6-well plates. Next morning, cell cultures (near 80% confluent) were incubated in serum-free medium for 24 hours. The cells were stimulated time-dependently by 10 ng/ml EGF. Positive con-trol denotes cells in normal growth medium containing 10% fetal calf serum. A. Osteopontin gene expression was analyzed by RNase protection assay on total RNA using a 486 base pair probe and standardized by comparison to β-actin. B. Quantitation of osteopontin mRNA levels is shown in (A). RDU ratio reflects relative density units of osteopontin mRNA di-vided by β-actin mRNA. C. Western blot of osteopontin pro-tein by cell lysates confirmed the results from RNase protec-tion assay. Tubulin was served as loading control.
- Citation: Zhang GX, Zhao ZQ, Wang HD, Hao B. Enhancement of osteopontin expression in HepG2 cells by epidermal growth factor via phosphatidylinositol 3-kinase signaling pathway. World J Gastroenterol 2004; 10(2): 205-208
- URL: https://www.wjgnet.com/1007-9327/full/v10/i2/205.htm
- DOI: https://dx.doi.org/10.3748/wjg.v10.i2.205


