Copyright
©The Author(s) 2004.
World J Gastroenterol. Jan 15, 2004; 10(2): 161-166
Published online Jan 15, 2004. doi: 10.3748/wjg.v10.i2.161
Published online Jan 15, 2004. doi: 10.3748/wjg.v10.i2.161
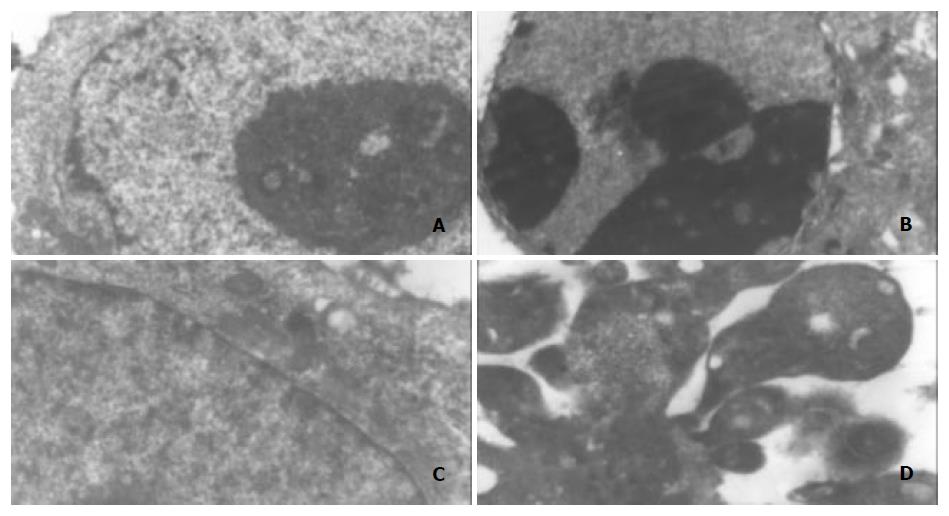
Figure 3 Morphological changes in MGC803 and SGC7901 cells under electron microscope after treatment with ST (200 ng/ml), ×5000.
A: MGC803 control cells, B: 200 ng/ml ST-induced MGC803 cells, C: SGC7901 control cells, D: 200 ng/ml ST-induced SGC7901 cells. Note: chromatin condensation and formation of apoptotic bodies.
- Citation: Ha MW, Hou KZ, Liu YP, Yuan Y. Effect of staurosporine on cycle human gastric cancer cell. World J Gastroenterol 2004; 10(2): 161-166
- URL: https://www.wjgnet.com/1007-9327/full/v10/i2/161.htm
- DOI: https://dx.doi.org/10.3748/wjg.v10.i2.161


