Copyright
©The Author(s) 2004.
World J Gastroenterol. Oct 1, 2004; 10(19): 2886-2889
Published online Oct 1, 2004. doi: 10.3748/wjg.v10.i19.2886
Published online Oct 1, 2004. doi: 10.3748/wjg.v10.i19.2886
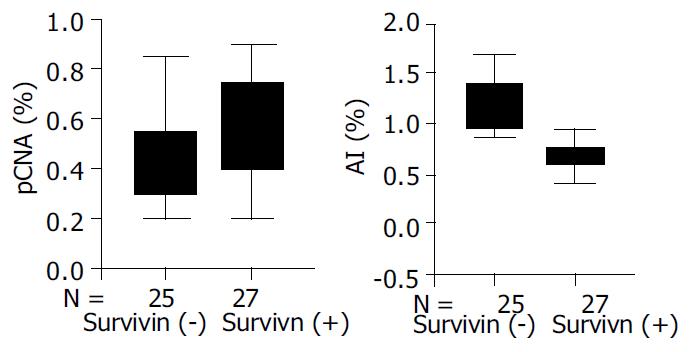
Figure 2 Correlations between survivin expression and AI and PI.
P < 0.001 as PI in survivin positive tumors (51% ± 22%) compared with survivin negative tumors (27% ± 18%), P < 0.001 as AI in survivin positive tumors (0.67% ± 0.18%) compared with survivin negative tumors (1.14% ± 0.42%).
- Citation: Chen WC, Liu Q, Fu JX, Kang SY. Expression of survivin and its significance in colorectal cancer. World J Gastroenterol 2004; 10(19): 2886-2889
- URL: https://www.wjgnet.com/1007-9327/full/v10/i19/2886.htm
- DOI: https://dx.doi.org/10.3748/wjg.v10.i19.2886


