Copyright
©The Author(s) 2004.
World J Gastroenterol. Sep 1, 2004; 10(17): 2580-2584
Published online Sep 1, 2004. doi: 10.3748/wjg.v10.i17.2580
Published online Sep 1, 2004. doi: 10.3748/wjg.v10.i17.2580
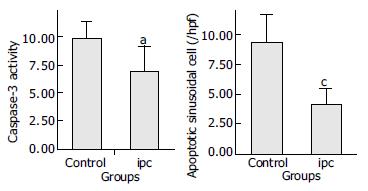
Figure 1 Comparison of Caspase-3 activity and SEC apoptosis between control group and IPC group aP = 0.
047, vs control, cP = 0.002, vs control, (t test) (casapse-3 activity unit: nmol AMC·h-1·mg-1 (tissue)) hpf: high power field.
- Citation: Li SQ, Liang LJ, Huang JF, Li Z. Ischemic preconditioning protects liver from hepatectomy under hepatic inflow occlusion for hepatocellular carcinoma patients with cirrhosis. World J Gastroenterol 2004; 10(17): 2580-2584
- URL: https://www.wjgnet.com/1007-9327/full/v10/i17/2580.htm
- DOI: https://dx.doi.org/10.3748/wjg.v10.i17.2580


