Copyright
©The Author(s) 2004.
World J Gastroenterol. Sep 1, 2004; 10(17): 2524-2528
Published online Sep 1, 2004. doi: 10.3748/wjg.v10.i17.2524
Published online Sep 1, 2004. doi: 10.3748/wjg.v10.i17.2524
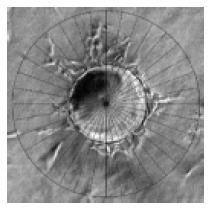
Figure 1 Quantification of angiogenesis.
Each MC in random photographed fields was overlaid with a grid that was equally divided around 360o at 10-degree intervals (original magnification × 100). For each photographed microcarrier, the lengths of sprouts were measured on each of the grid lines and summed. The lengths of sprouts from each MC were averaged in each well. The average lengths of sprouts (ALS) from 8 replicate wells of each testing group were analyzed. Bar: 100 mm.
-
Citation: Sun XT, Ding YT, Yan XG, Wu LY, Li Q, Cheng N, Qiu YD, Zhang MY. Angiogenic synergistic effect of basic fibroblast growth factor and vascular endothelial growth factor in an
in vitro quantitative microcarrier-based three-dimensional fibrin angiogenesis system. World J Gastroenterol 2004; 10(17): 2524-2528 - URL: https://www.wjgnet.com/1007-9327/full/v10/i17/2524.htm
- DOI: https://dx.doi.org/10.3748/wjg.v10.i17.2524


