Copyright
©The Author(s) 2004.
World J Gastroenterol. Jul 15, 2004; 10(14): 2095-2098
Published online Jul 15, 2004. doi: 10.3748/wjg.v10.i14.2095
Published online Jul 15, 2004. doi: 10.3748/wjg.v10.i14.2095
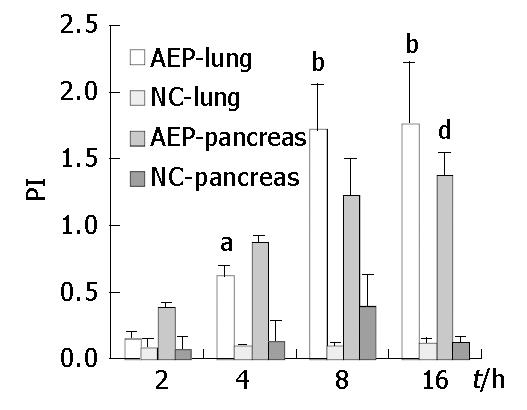
Figure 2 Microvascular permeability index (PI) in the pancreas and lungs in AEP and control group.
The figures indicate the increase of PI in the lungs is higher than that in the pancreas aP < 0.05 vs control; bP < 0.001 vs control; dP < 0.01 vs control.
- Citation: Yan WW, Zhou ZG, Chen YD, Gao HK. Role of COX-2 in microcirculatory disturbance in experimental pancreatitis. World J Gastroenterol 2004; 10(14): 2095-2098
- URL: https://www.wjgnet.com/1007-9327/full/v10/i14/2095.htm
- DOI: https://dx.doi.org/10.3748/wjg.v10.i14.2095


