Copyright
©The Author(s) 2004.
World J Gastroenterol. Jul 1, 2004; 10(13): 1964-1966
Published online Jul 1, 2004. doi: 10.3748/wjg.v10.i13.1964
Published online Jul 1, 2004. doi: 10.3748/wjg.v10.i13.1964
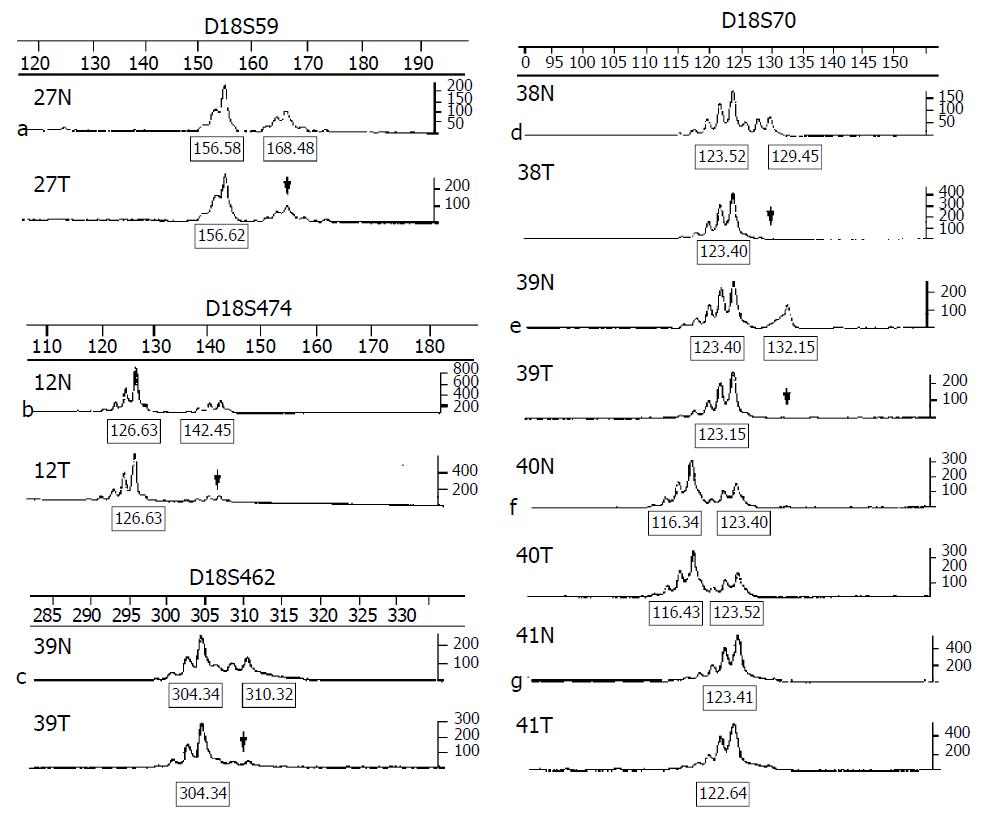
Figure 1 Representative LOH analysis of chrosomose 18.
The scales on the top and right side of each figure represent the size (bp) and the intensity, respectively; N: Nontumorous control; T: Tumor; Arrow: Informative case with allelic loss (a, b, c, d, e); f: An informative case without allelic loss (heterozygote); g: An non-informative case (homozygote).
- Citation: Yu JC, Sun KL, Liu B, Fu SB. Allelotyping for loss of heterozygosity on chromosome 18 in gastric cancer. World J Gastroenterol 2004; 10(13): 1964-1966
- URL: https://www.wjgnet.com/1007-9327/full/v10/i13/1964.htm
- DOI: https://dx.doi.org/10.3748/wjg.v10.i13.1964


