Copyright
©The Author(s) 2004.
World J Gastroenterol. Jul 1, 2004; 10(13): 1876-1880
Published online Jul 1, 2004. doi: 10.3748/wjg.v10.i13.1876
Published online Jul 1, 2004. doi: 10.3748/wjg.v10.i13.1876
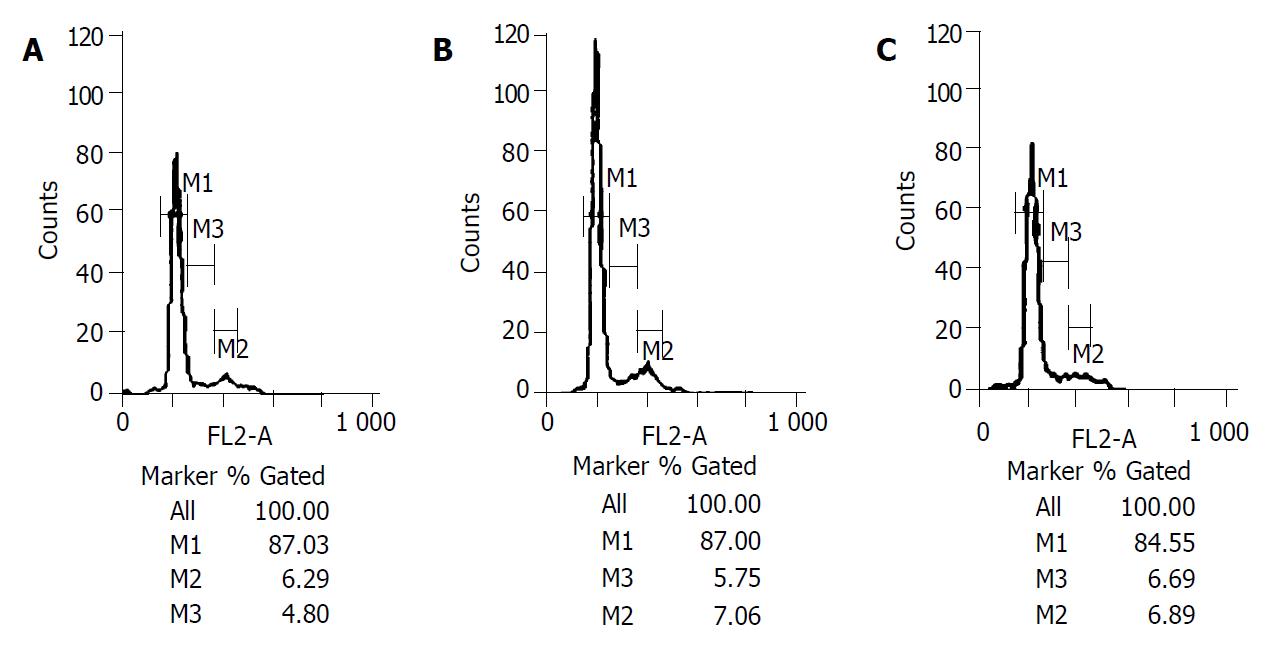
Figure 6 A: Shows the S phase and G2/M phase cells were small in proportion on the third day after operations (4.
80%, 6.29%) in control group. B and C: Show the S phase and G2/M phase cells had slight changes on the third day after operations in TACE group and PH group.
- Citation: Li Z, Hu DY, Chu Q, Wu JH, Gao C, Zhang YQ, Huang YR. Cell apoptosis and regeneration of hepatocellular carcinoma after transarterial chemoembolization. World J Gastroenterol 2004; 10(13): 1876-1880
- URL: https://www.wjgnet.com/1007-9327/full/v10/i13/1876.htm
- DOI: https://dx.doi.org/10.3748/wjg.v10.i13.1876


