Copyright
©The Author(s) 2004.
World J Gastroenterol. Jun 15, 2004; 10(12): 1775-1779
Published online Jun 15, 2004. doi: 10.3748/wjg.v10.i12.1775
Published online Jun 15, 2004. doi: 10.3748/wjg.v10.i12.1775
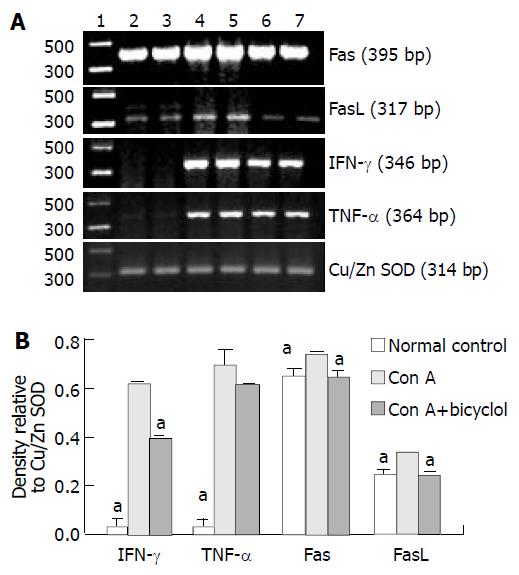
Figure 6 Effect of bicyclol on Con A induced TNF-α, IFN-γ, Fas and FasL mRNA expression determined by RT-PCR.
A: Pho-tograph of ethidium bromide-stained amplification products. Lane 1, molecular mass markers; lane 2 and lane 3, control liver; lane 4 and lane 5, liver 2 h after Con A administration alone; lane 6 and lane 7, liver 2 h after injection of Con A in combination with 200 mg/kg bicyclol. B: Relative band intensity of amplification products compared with Cu/Zn SOD mRNA. Data represent the mean of two lanes. Each lane corresponds to the pooled livers from two mice. aP < 0.05 vs Con A alone.
- Citation: Li M, Liu GT. Inhibition of Fas/FasL mRNA expression and TNF-α release in concanavalin A-induced liver injury in mice by bicyclol. World J Gastroenterol 2004; 10(12): 1775-1779
- URL: https://www.wjgnet.com/1007-9327/full/v10/i12/1775.htm
- DOI: https://dx.doi.org/10.3748/wjg.v10.i12.1775


