Copyright
©The Author(s) 2004.
World J Gastroenterol. Jun 15, 2004; 10(12): 1769-1774
Published online Jun 15, 2004. doi: 10.3748/wjg.v10.i12.1769
Published online Jun 15, 2004. doi: 10.3748/wjg.v10.i12.1769
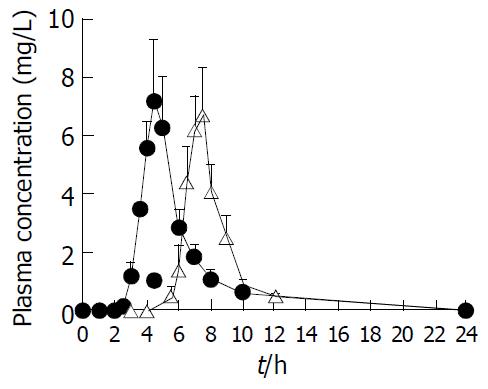
Figure 7 DS plasma concentration-time profiles after oral ad-ministration of coated formulation (△) and reference enteric formulation (●) in dogs at a dose of 100 mg/body.
Each value represents mean ± SE (n = 6).
- Citation: Cheng G, An F, Zou MJ, Sun J, Hao XH, He YX. Time- and pH-dependent colon-specific drug delivery for orally administered diclofenac sodium and 5-aminosalicylic acid. World J Gastroenterol 2004; 10(12): 1769-1774
- URL: https://www.wjgnet.com/1007-9327/full/v10/i12/1769.htm
- DOI: https://dx.doi.org/10.3748/wjg.v10.i12.1769


