Copyright
©The Author(s) 2004.
World J Gastroenterol. May 15, 2004; 10(10): 1440-1446
Published online May 15, 2004. doi: 10.3748/wjg.v10.i10.1440
Published online May 15, 2004. doi: 10.3748/wjg.v10.i10.1440
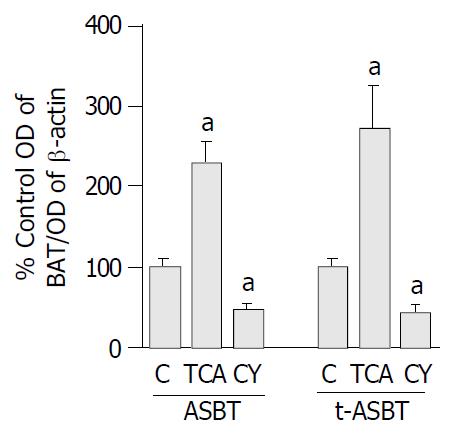
Figure 4 Effect of TCA and CY feeding on the amount of ASBT and t-ASBT protein in ileum.
Bar graphs showing ratios of ASBT/β-actin and t-ASBT/β-Actin in PNS of ileal scrapings obtained from rats fed C, TCA and CY diets. Forty and 80 μg of protein were subjected to SDS-PAGE and immunoblotted to visualize ASBT and t-ASBT, respectively. Data shown here are representative of n = 3 feeding studies were analyzed per group and expressed as mean ± SE (aP < 0.05). For the analysis of ASBT and t-ASBT in the TCA treated groups, 7 and 3 rats in total were used, respectively. Whereas, the number of animals ana-lyzed in the CY groups totaled 10 and 3 for ASBT and t-ASBT, respectively. Hence, the number of control rats was 17 for ASBT and 6 for t-ASBT in total.
- Citation: Kip NS, Lazaridis KN, Masyuk AI, Splinter PL, Huebert RC, LaRusso NF. Differential expression of cholangiocyte and ileal bile acid transporters following bile acid supplementation and depletion. World J Gastroenterol 2004; 10(10): 1440-1446
- URL: https://www.wjgnet.com/1007-9327/full/v10/i10/1440.htm
- DOI: https://dx.doi.org/10.3748/wjg.v10.i10.1440


