Copyright
©The Author(s) 2004.
World J Gastroenterol. May 15, 2004; 10(10): 1440-1446
Published online May 15, 2004. doi: 10.3748/wjg.v10.i10.1440
Published online May 15, 2004. doi: 10.3748/wjg.v10.i10.1440
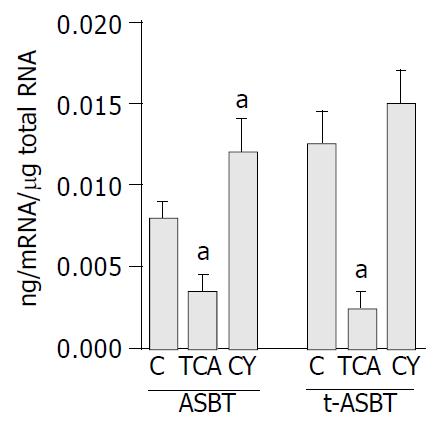
Figure 1 Q-RPA data demonstrating down-regulation of ASBT and t-ASBT message following TCA feeding and up-regulation of their expression following CY feeding in cholangiocytes.
Bar graphs demonstrating ASBT and t-ASBT mRNA expression, in which 40 μg total cellular RNA isolated from cholangiocytes obtained from rats fed regular chow (C), 1% TCA or 5% CY incorporated diets were used. Densitometric values shown here are expressed as mean ± SE and represent 3 feeding studies in which 30 rats in total were analyzed per group (aP < 0.05).
- Citation: Kip NS, Lazaridis KN, Masyuk AI, Splinter PL, Huebert RC, LaRusso NF. Differential expression of cholangiocyte and ileal bile acid transporters following bile acid supplementation and depletion. World J Gastroenterol 2004; 10(10): 1440-1446
- URL: https://www.wjgnet.com/1007-9327/full/v10/i10/1440.htm
- DOI: https://dx.doi.org/10.3748/wjg.v10.i10.1440


