Copyright
©The Author(s) 2004.
World J Gastroenterol. Jan 1, 2004; 10(1): 100-104
Published online Jan 1, 2004. doi: 10.3748/wjg.v10.i1.100
Published online Jan 1, 2004. doi: 10.3748/wjg.v10.i1.100
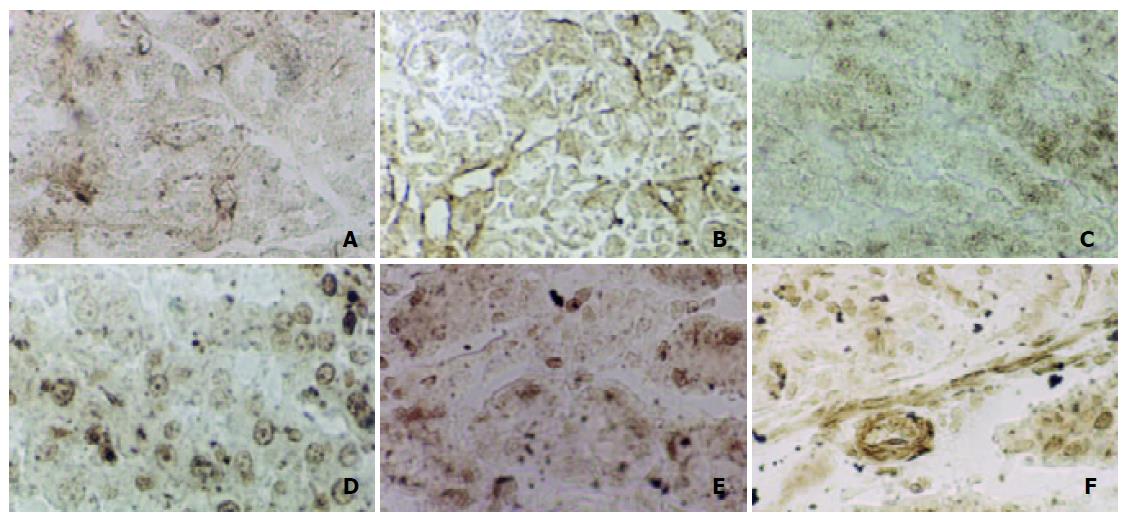
Figure 2 Enzyme histochemistry staining for intracellular Ca2+ -Mg2+ -ATPase in AP rats before and after treatment.
A: Pancreatic tissue in AP rats before treatment, × 400. B: Pancreatic tissue in AP rats after treatment with QYT, × 400. C: Hepatic tissue in AP rats before treatment, × 200. D: Hepatic tissue in AP rats after treatment with VitE, × 200. E: Renal tissue in AP rats before treatment, × 400. F: Renal tissue in AP rats after treatment with Tet, × 400.
- Citation: Qiu Y, Li YY, Li SG, Song BG, Zhao GF. Effect of Qingyitang on activity of intracellular Ca2+ -Mg2+ -ATPase in rats with acute pancreatitis. World J Gastroenterol 2004; 10(1): 100-104
- URL: https://www.wjgnet.com/1007-9327/full/v10/i1/100.htm
- DOI: https://dx.doi.org/10.3748/wjg.v10.i1.100


