Copyright
©The Author(s) 2003.
World J Gastroenterol. Mar 15, 2003; 9(3): 562-567
Published online Mar 15, 2003. doi: 10.3748/wjg.v9.i3.562
Published online Mar 15, 2003. doi: 10.3748/wjg.v9.i3.562
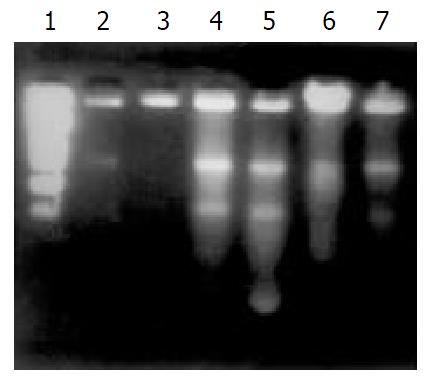
Figure 1 Hydrogen peroxide induced apoptosis of SW-480 cells.
1: PBR322/Hinf I (75, 154, 220, 221, 298, 344, 396, 504, 517, 1632); 2, 3: cells from normal control; 4: 4 mmol/L H2O2-stimualted cells (1 h); 5: 4 mmol/L H2O2-stimualted cells (3h); 6: 400 μmol/L H2O2-stimualted cells (1 h) 7: 400 μmol/L H2O2-stimualted cells (3 h).
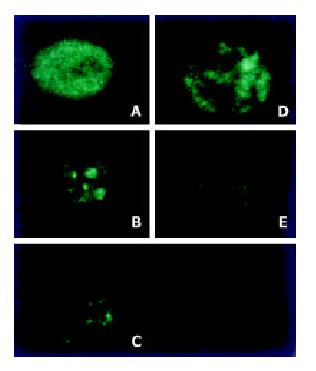
Figure 2 Hydrogen peroxide induced translocation of mitochondria.
(A) cells from normal control; (B) 400 μmol/L H2O2-stimualted cells (1 h). (C) 400 μmol/L H2O2-stimualted cells (3 h); (D) 4 mmol/L H2O2-stimualted cells (1 h); (E) 4 mmol/L H2O2-stimualted cells (3 h).
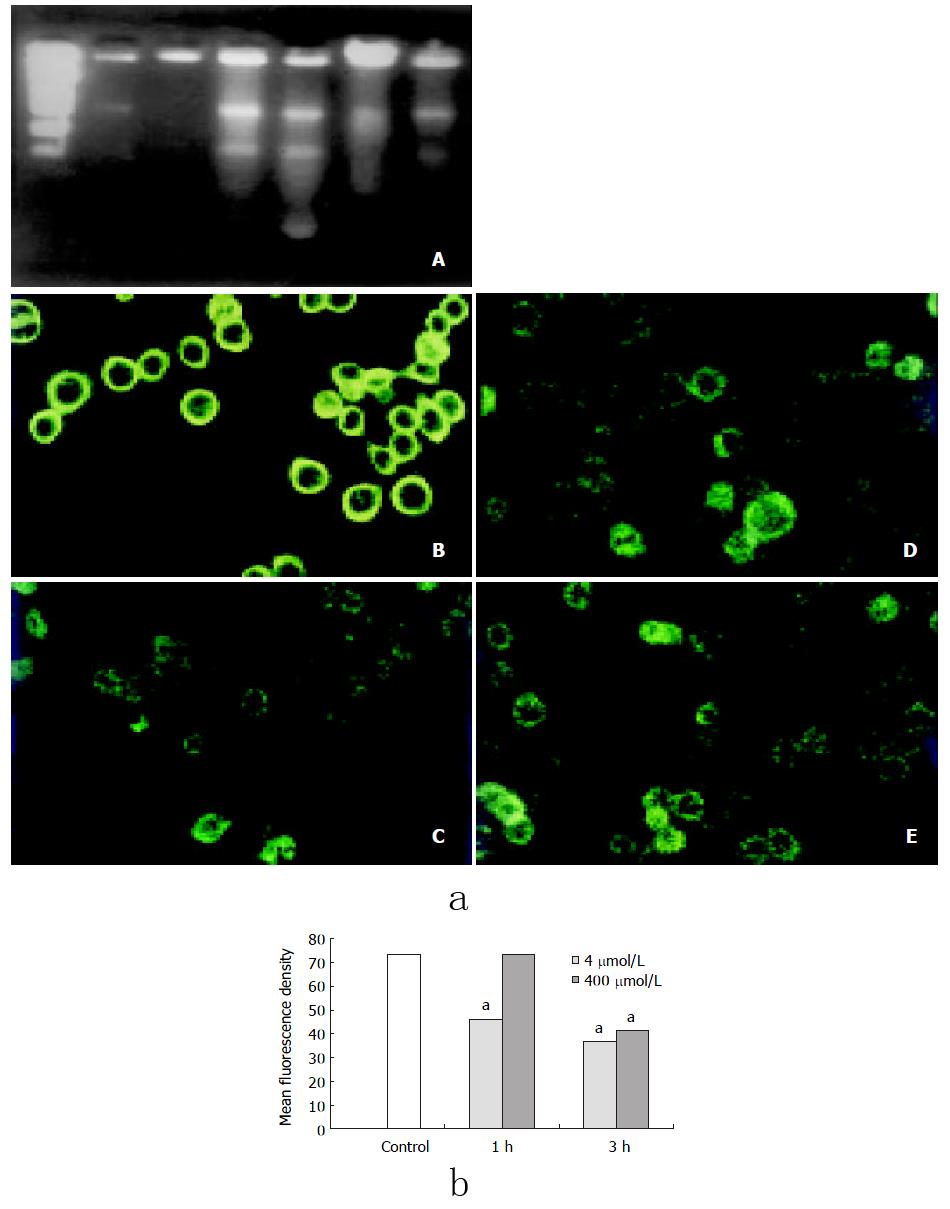
Figure 3 a: Changes of mitochondrial membrane potential induced by hydrogen peroxide.
(A) cells from normal control; (B) 400 μmol/L H2O2-stimualted cells (1 h); (C) 400 μmol/L H2O2-stimualted cells (3 h); (D) 4 mmol/L H2O2-stimualted cells (1h); (E) 4 mmol/L H2O2-stimualted cells (3 h). b: Effects of hydrogen peroxide on mitochondrial mem-brane potential of SW-480 cells (aP < 0.05 vs control).
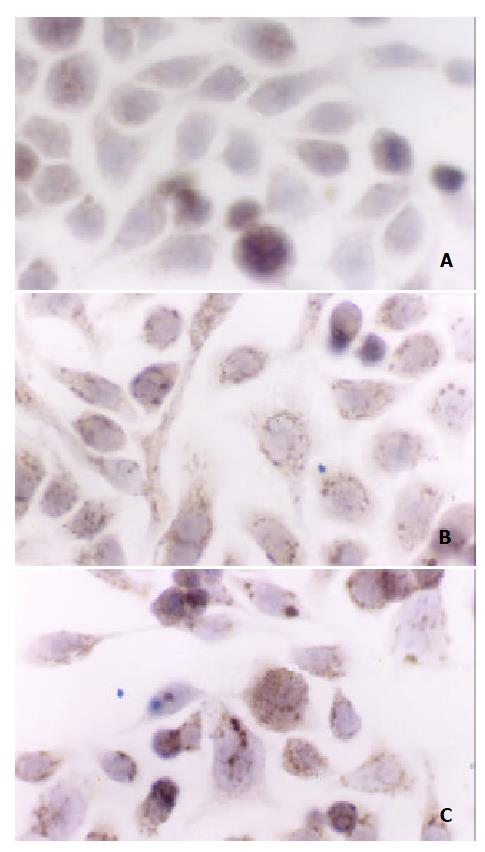
Figure 4 Cytochrome c release in SW-480 cells induced by hy-drogen peroxide (S-P×400).
A: control cells, B: 400 μmol/L H2O2-treated cells (30 min), C: 4 mmol/L H2O2-treated cells (30 min).
- Citation: Li JM, Zhou H, Cai Q, Xiao GX. Role of mitochondrial dysfunction in hydrogen peroxide-induced apoptosis of intestinal epithelial cells. World J Gastroenterol 2003; 9(3): 562-567
- URL: https://www.wjgnet.com/1007-9327/full/v9/i3/562.htm
- DOI: https://dx.doi.org/10.3748/wjg.v9.i3.562


