Copyright
©The Author(s) 2003.
World J Gastroenterol. Oct 15, 2003; 9(10): 2274-2277
Published online Oct 15, 2003. doi: 10.3748/wjg.v9.i10.2274
Published online Oct 15, 2003. doi: 10.3748/wjg.v9.i10.2274
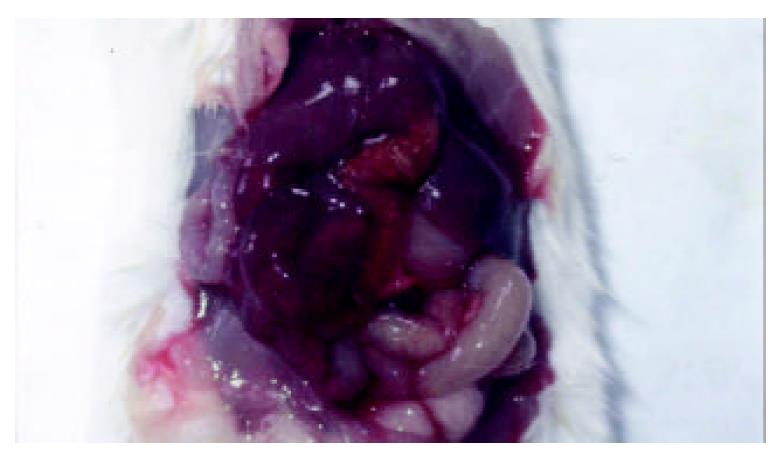
Figure 1 Gross appearance of abdominal cavity in SAP model control.
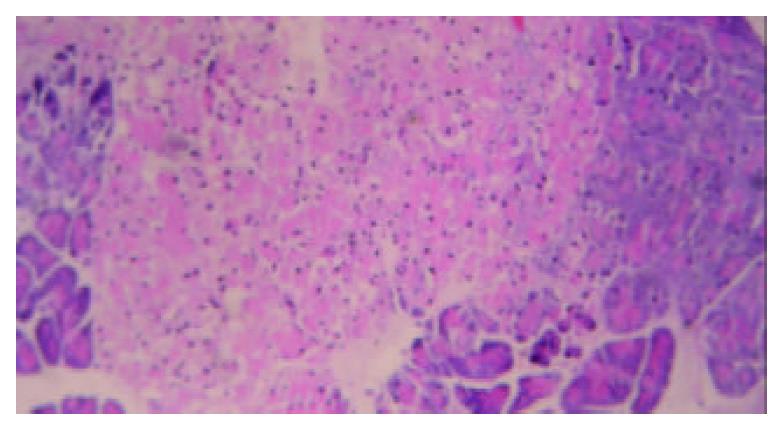
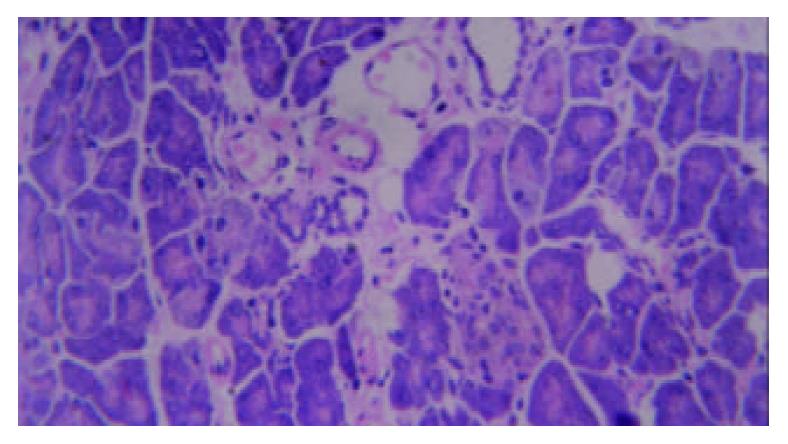
Figure 2 Pathological changes of pancreas at 24 h post SAP induction in mice of model control (HE, × 200).
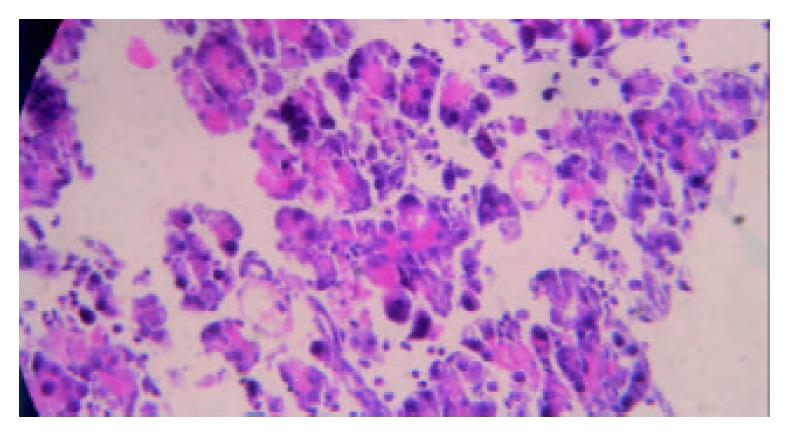
Figure 3 Pathological changes of pancreas at 72 h post SAP induction in mice of model control (HE, × 200).
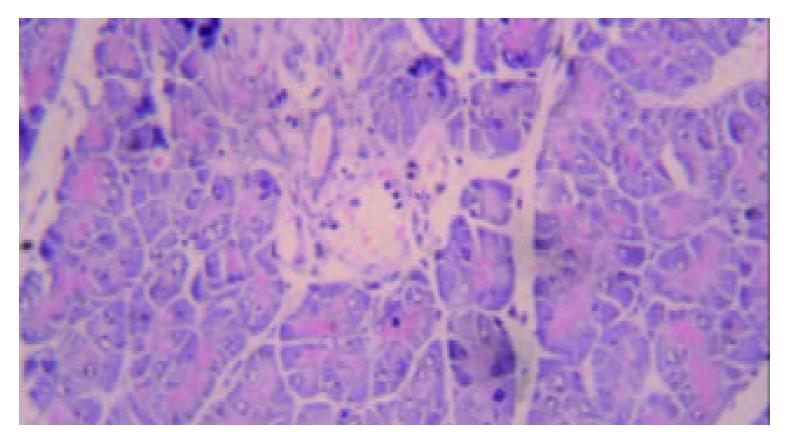
Figure 4 Microscopic changes of pancreas at 72 h after induc-tion of SAP in mice pretreated with G-CSF (HE, × 200).
Figure 5 Microscopic changes of pancreas at 72 h post SAP induction in mice pretreated with BMSCs transplantation (HE, × 200).
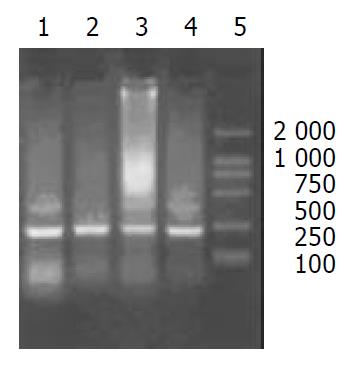
Figure 6 PCR products of Y chromosome Sry region gene existed in some organs of recipient female mice after male BMSCs transplantation demonstrated by agarose gel electrophoresis.
Lane 1: pancreas, Lane 2: liver, Lane 3: liver, Lane 4: spleen, Lane 5: DNA marker.
- Citation: Cui HF, Bai ZL. Protective effects of transplanted and mobilized bone marrow stem cells on mice with severe acute pancreatitis. World J Gastroenterol 2003; 9(10): 2274-2277
- URL: https://www.wjgnet.com/1007-9327/full/v9/i10/2274.htm
- DOI: https://dx.doi.org/10.3748/wjg.v9.i10.2274


