Copyright
©The Author(s) 2002.
World J Gastroenterol. Jun 15, 2002; 8(3): 431-435
Published online Jun 15, 2002. doi: 10.3748/wjg.v8.i3.431
Published online Jun 15, 2002. doi: 10.3748/wjg.v8.i3.431
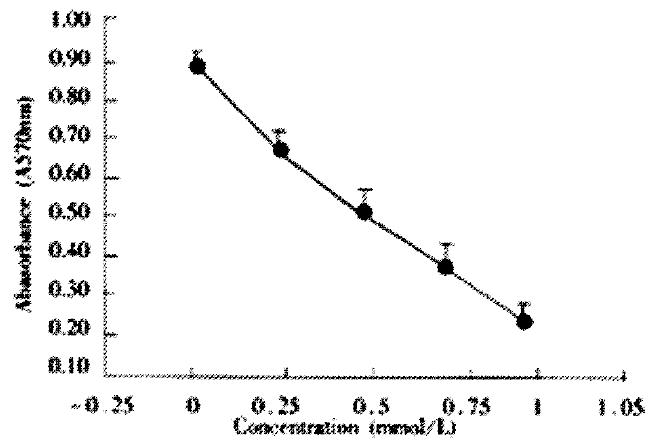
Figure 1 Effect of JTE-522 on cell growth in AGS cells.
The cells were treated with various concentrations of JTE-522 for 72 h. The antiproliferative effect was measured by MTT assay. Results are the means ± SD from three independent determinations.
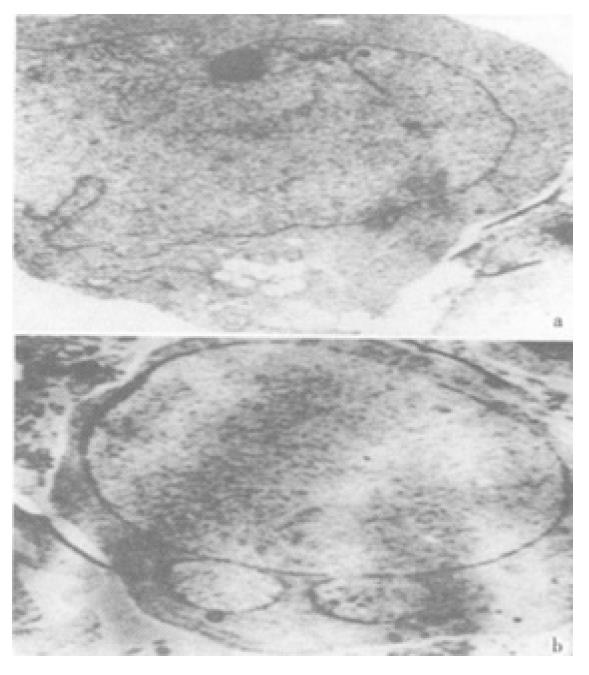
Figure 2 Electro micrographs of JTE-522-treated AGS cells.
Control AGS cells (A), or treated with 1 mmol/L (B) JTE-522 for 72 h, were examined by EM as in "Materials and Methods". Magnification: × 4000
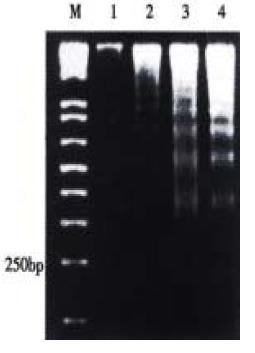
Figure 3 DNA ladder pattern formation of AGS cells.
Cells treated with different concentrations of JTE-522 for 72 h and uhe formation of oligonucleosomal fragments was determined by 1.5% agarose gel electrophoresis. M, DNA markers; lanes 1-4, AGS cells treated with 0, 0.25, 0.50, 1 mmol/L of JTE-522
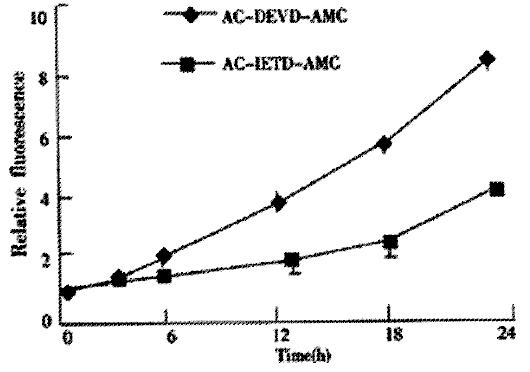
Figure 4 Activation of caspase-3 activities by JTE-522 in AGS cells for indicated time period.
JTE-522 treatment (0.75 mmol/L) induced cleavage of Ac-DEVD-AMC and Ac-IETD-AMC, indicating activation of caspase-3 activity, respectively
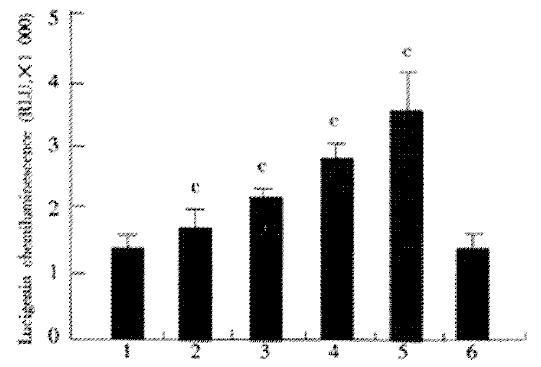
Figure 5 Effect of JTE-522 on the generation of ROS.
AGS cells were incubated for 6 h with JTE-522 (0.25-1 mmol/L) in the presence or absence of PDTC at 100 μmol/L. Lucigenic-associated chemiluminescence was mea-sured for 3 min with a lumirometer. (A). Lane 1: control; lane 2-5: AGS cells treated with 0.25, 0.5, 0.75, 1 mmol/L of JTE-522; lane 6: JTE-522 (1 mmol/L) +PDTC (100 μmol/L) cP < 0.01 vs control. Results are the means ± SD from three independent determinations.
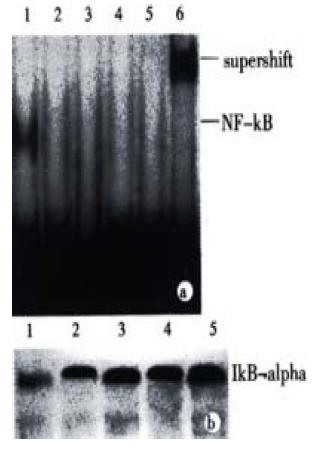
Figure 6 Effect of JTE-522 on NF-κB binding activity and IkBα degradation.
Cells were treated with JTE-522 for 6 h. Cells were harvested and EMSA was performed as described (A). Lane 1: control; lane 2-5: AGS cells treated with 0.25, 0.50, 0.75, 1 mmol/L of JTE-522. The identity of DNA-complexed pro-teins was confirmed by supershift assays using antibodies against p65 sub-unit of NF-κB (lane 6). Immunobolt analysis of IkBα of corresponding cytosilic supernatant (B). Representative results from four independent experiments.
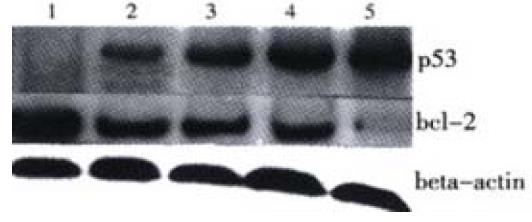
Figure 7 P53, bcl-2 protein levels in AGS cells treated with JTE-522.
Cell lysates were collected and processed at 6 h. The whole cellular protein was electrophoresed in SDS-PAGE gel, Western blot was performed using antibodies against p53, bcl-2. Beta actin was used as a lane-loading control. (1) control; (2) 0.25 mmol/L; (3) 0.5 mmol/L; (4) 0.75 mmol/L; (5) 1 mmol/L. Representative results from three independent experiments.
- Citation: Li HL, Chen DD, Li XH, Zhang HW, Lü YQ, Ye CL, Ren XD. Changes of NF-κB, p53, Bcl-2 and caspase in apoptosis induced by JTE-522 in human gastric adenocarcinoma cell line AGS cells: role of reactive oxygen species. World J Gastroenterol 2002; 8(3): 431-435
- URL: https://www.wjgnet.com/1007-9327/full/v8/i3/431.htm
- DOI: https://dx.doi.org/10.3748/wjg.v8.i3.431


