Copyright
©The Author(s) 2000.
World J Gastroenterol. Jun 15, 2000; 6(3): 365-370
Published online Jun 15, 2000. doi: 10.3748/wjg.v6.i3.365
Published online Jun 15, 2000. doi: 10.3748/wjg.v6.i3.365
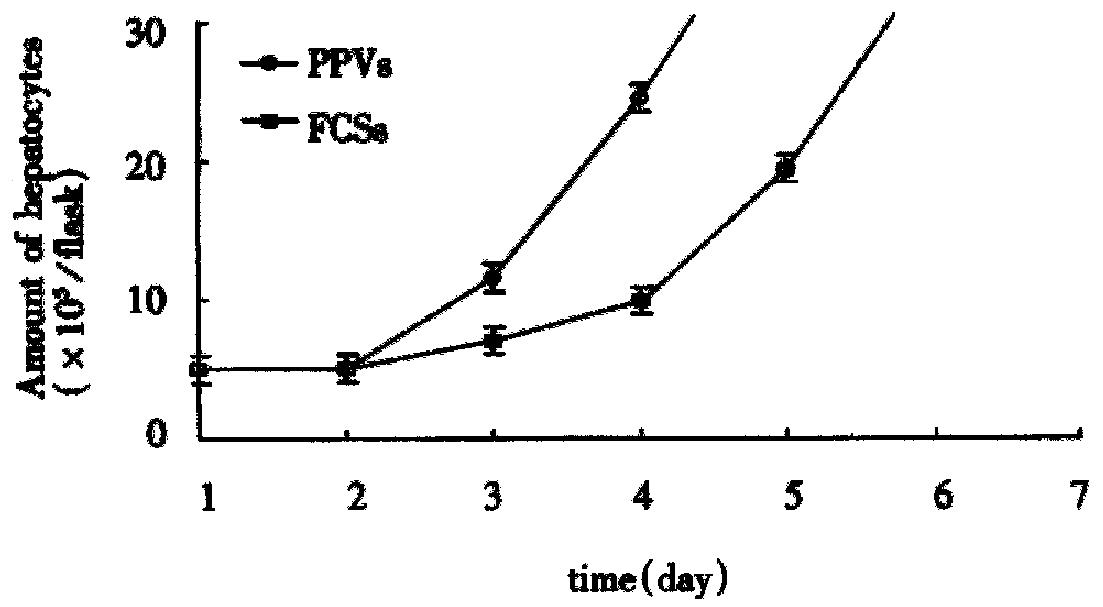
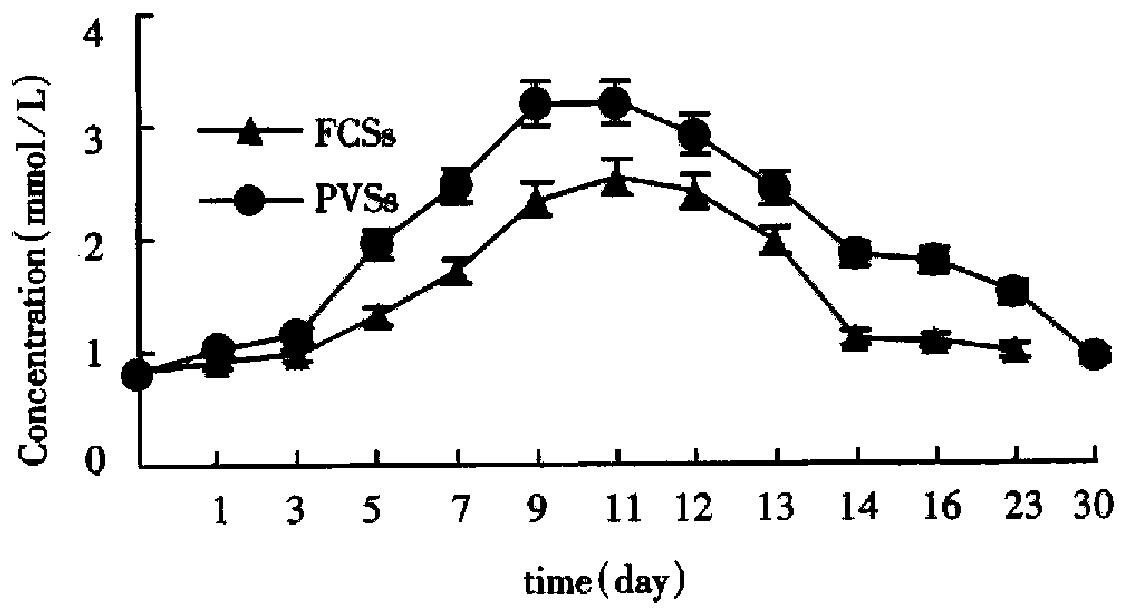
Figure 1 Hepatocytes growth curve in different culture systems on microcarriers.
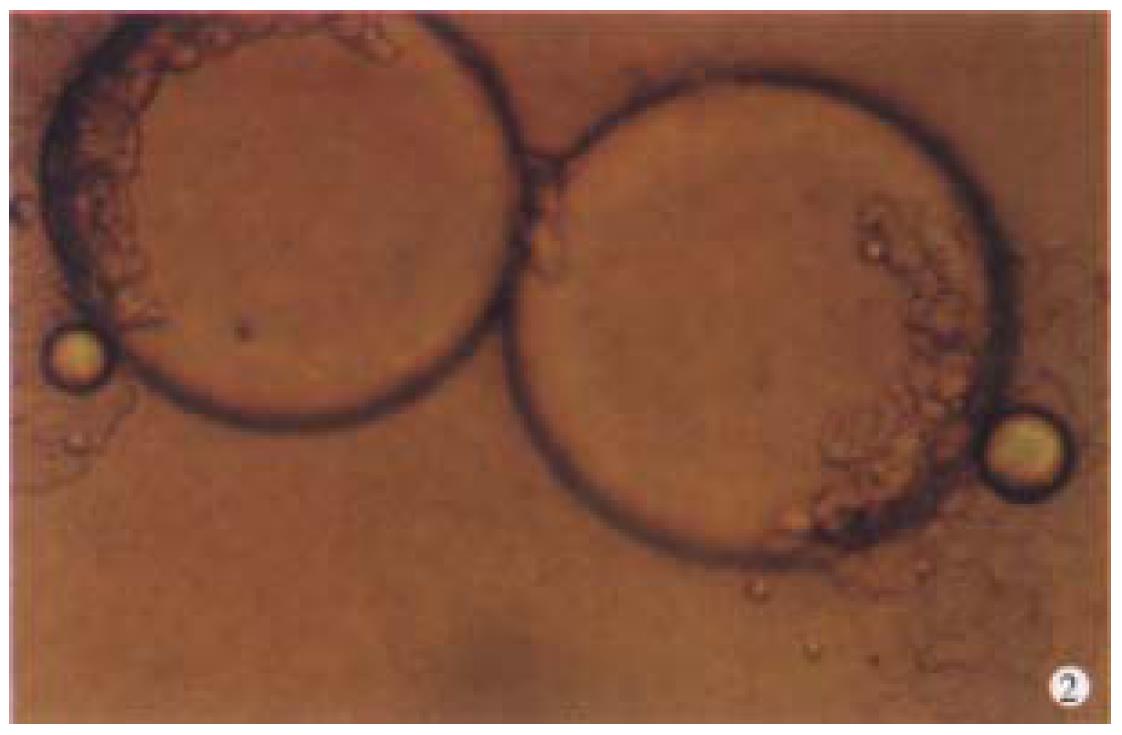
Figure 2 Four hours after inoculation cell-bridge could be observed between microcarriers (under phase-contrast microscope × 200).
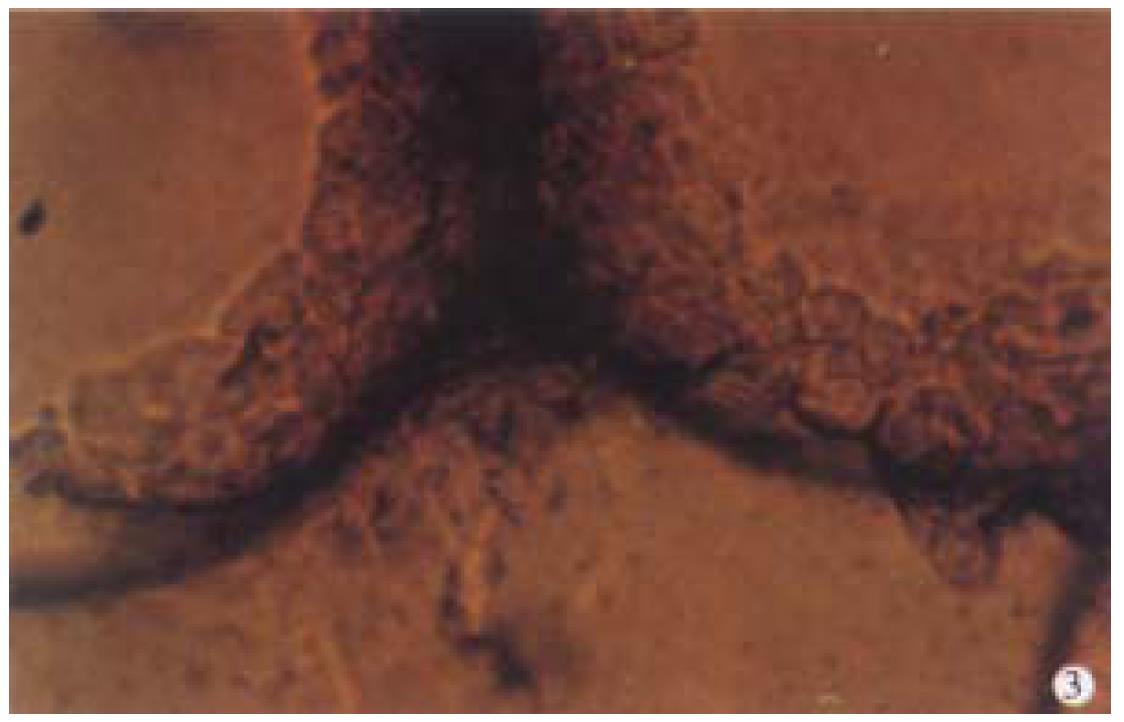
Figure 3 Microcarriers were arranged as a string of beads by adhered hepatocytes (under phase-contrast microscope × 400).
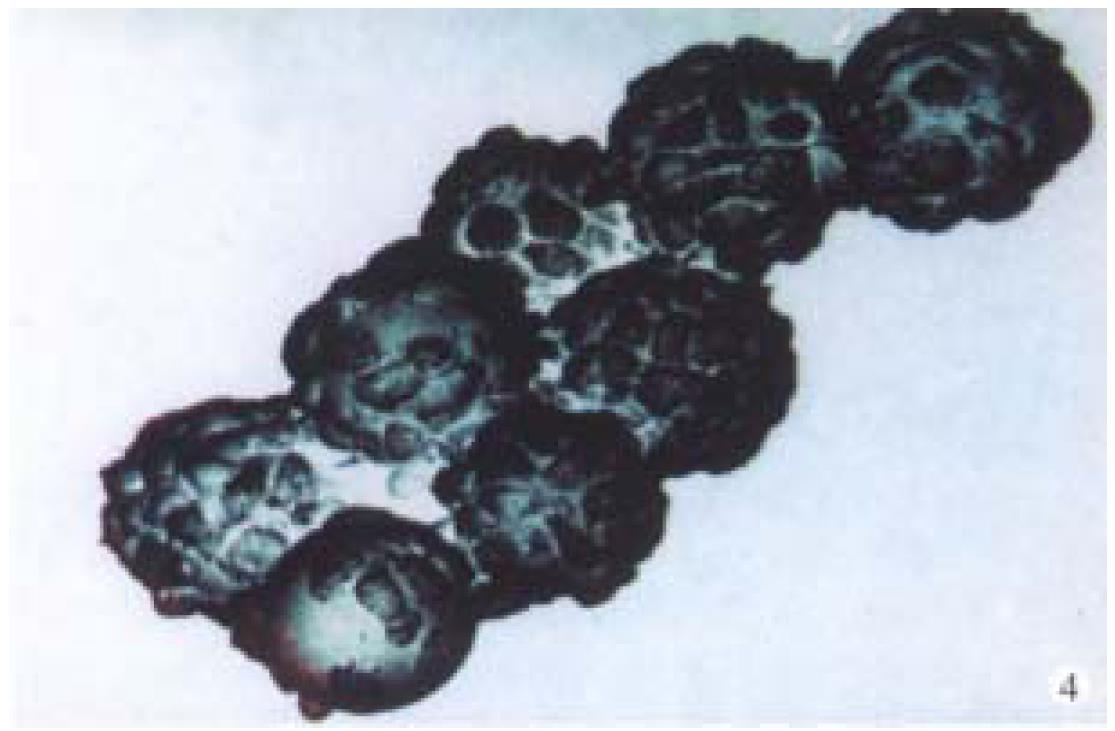
Figure 4 Stringed microcarriers with adhered hepatocytes (under phase contrast microscope × 730).
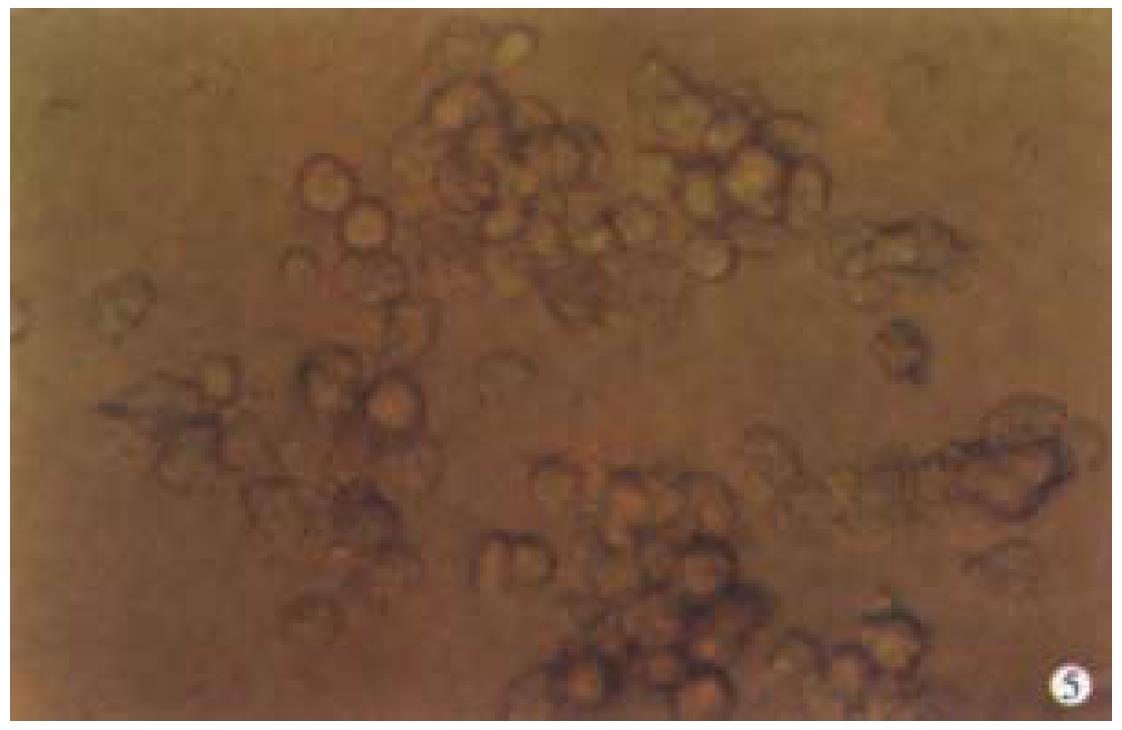
Figure 5 Hepatocytes looked like "cell flowers" 24 h after being cultivated in suspension and aggregated spheroids (under phase contrast microscope × 400).
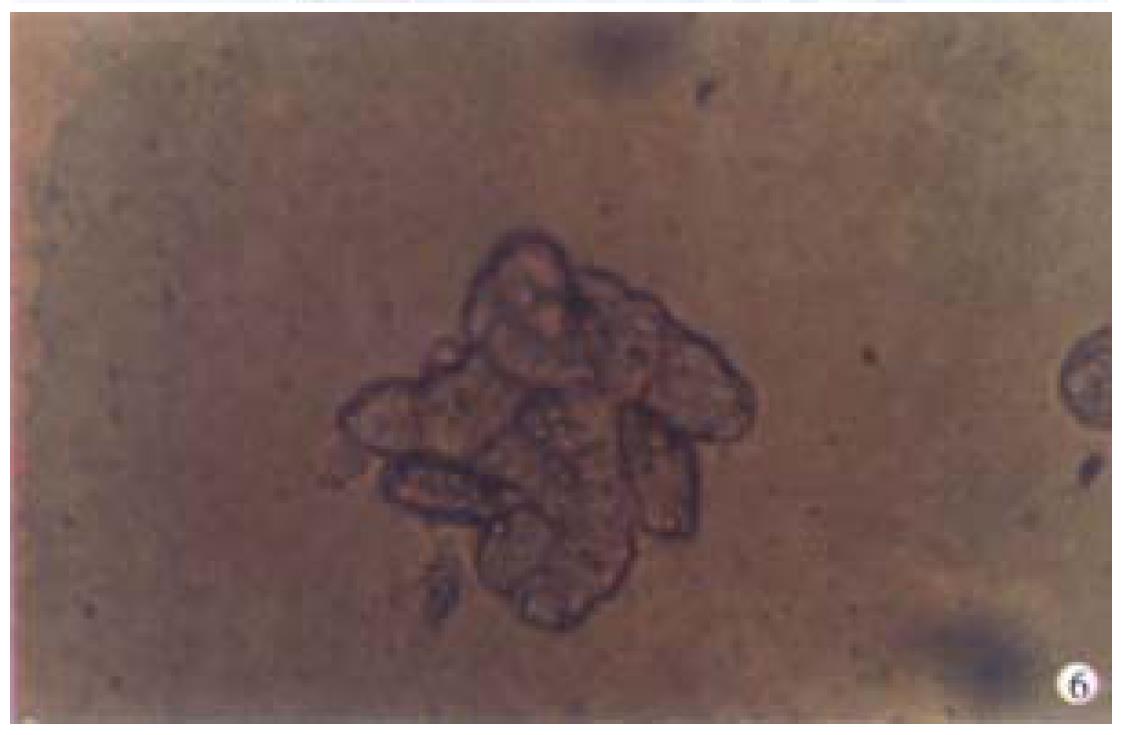
Figure 6 On the d7 hepatocytes aggregated into "cell spheroids" (under phase contrast microscope × 400).
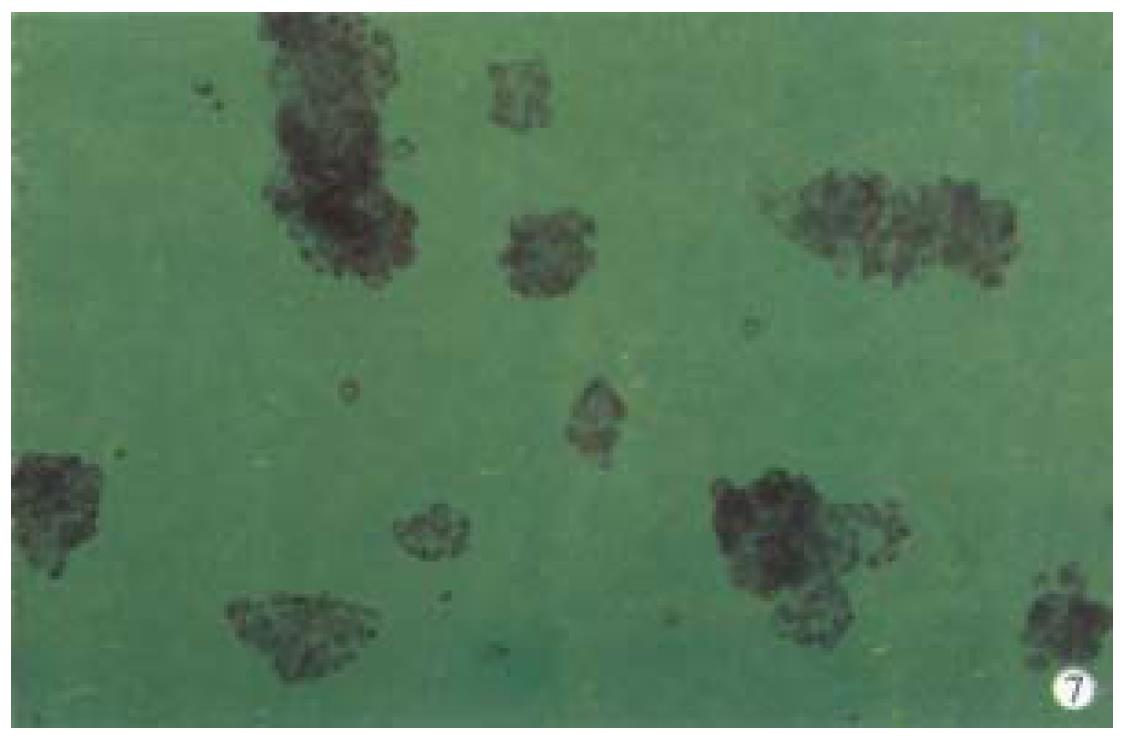
Figure 7 On the d10 hepatocytes in the forms of algoid plants (under phase contrast microscope × 200).
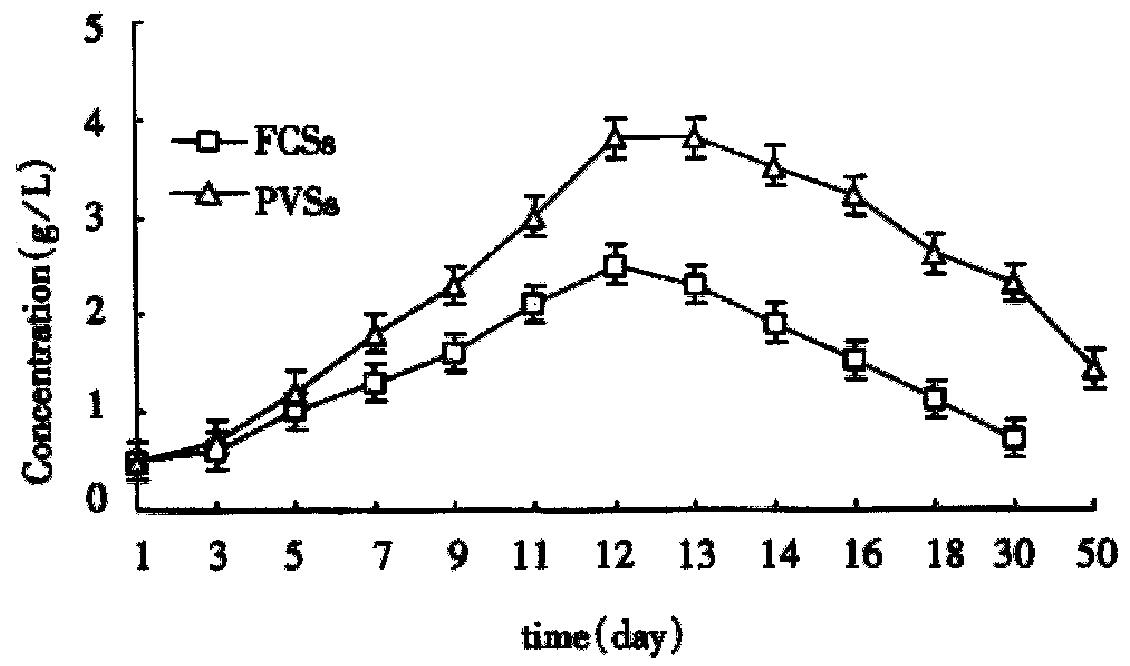
Figure 8 Changes of albumin synthesis in hepatocytes from different culture systems on microcarriers.
Figure 9 Changes of urea secretion in hepatocytes from different culture systems on microcarriers.
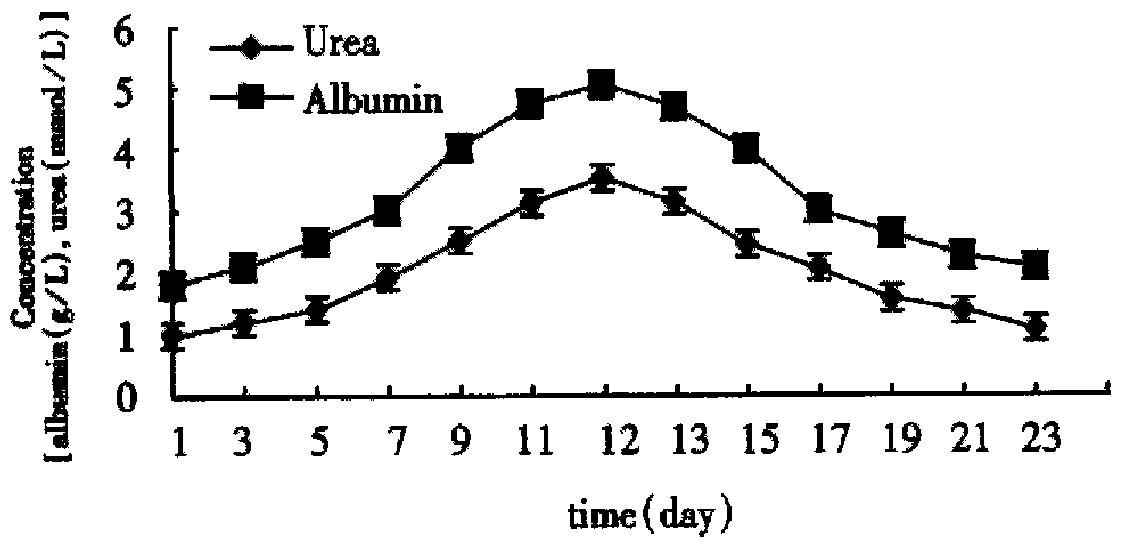
Figure 10 Dynamic changes of albumin and urea in the supernatant fluid.
- Citation: Gao Y, Hu HZ, Yang JZ, Chen K. Primary porcine hepatocytes with portal vein serum cultured on microcarriers or in spheroidal aggregates. World J Gastroenterol 2000; 6(3): 365-370
- URL: https://www.wjgnet.com/1007-9327/full/v6/i3/365.htm
- DOI: https://dx.doi.org/10.3748/wjg.v6.i3.365


