Copyright
©The Author(s) 2024.
World J Gastroenterol. Jan 28, 2024; 30(4): 381-417
Published online Jan 28, 2024. doi: 10.3748/wjg.v30.i4.381
Published online Jan 28, 2024. doi: 10.3748/wjg.v30.i4.381
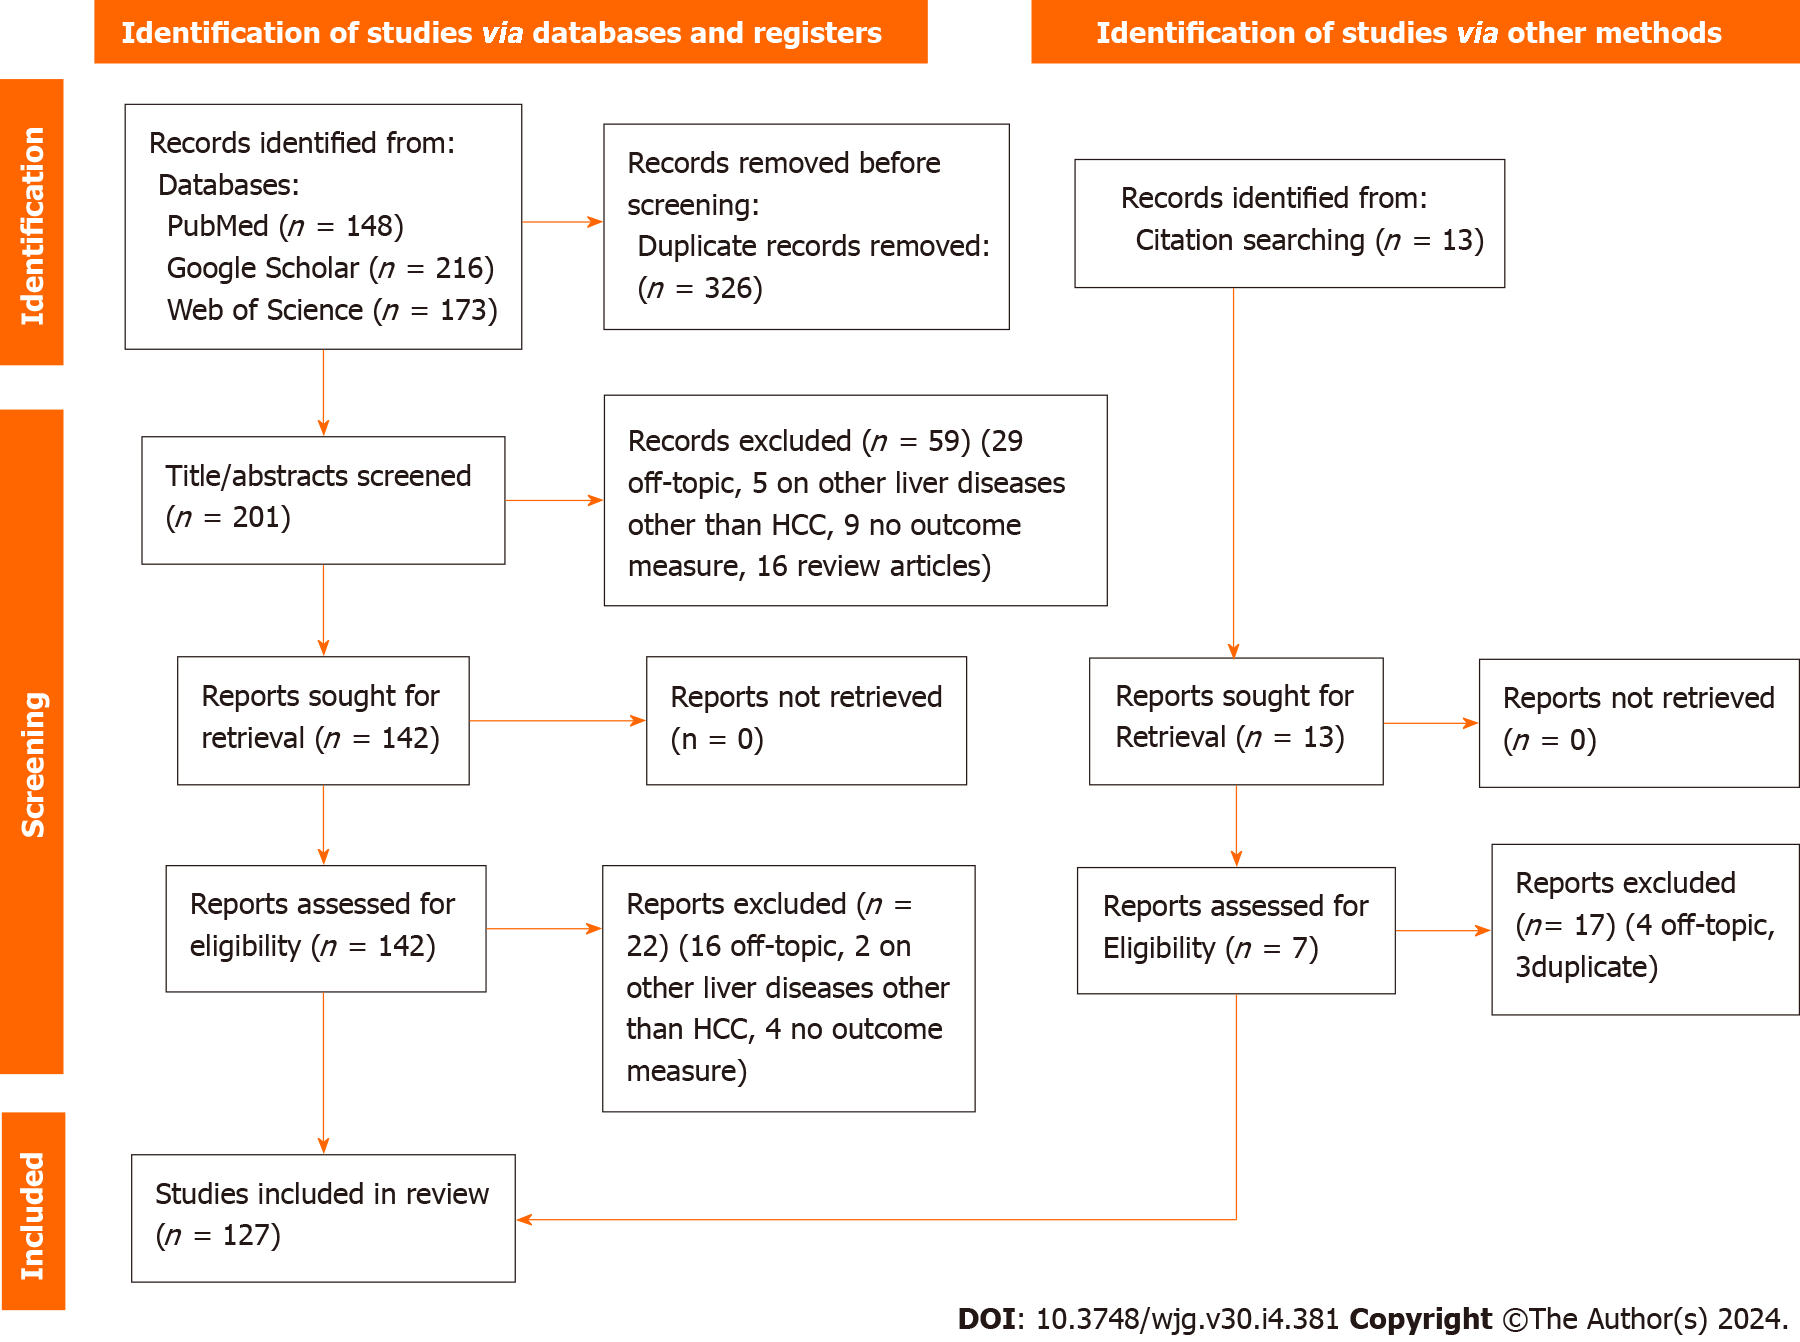
Figure 1 PRISMA flow diagram of included studies.
HCC: Hepatocellular carcinoma.
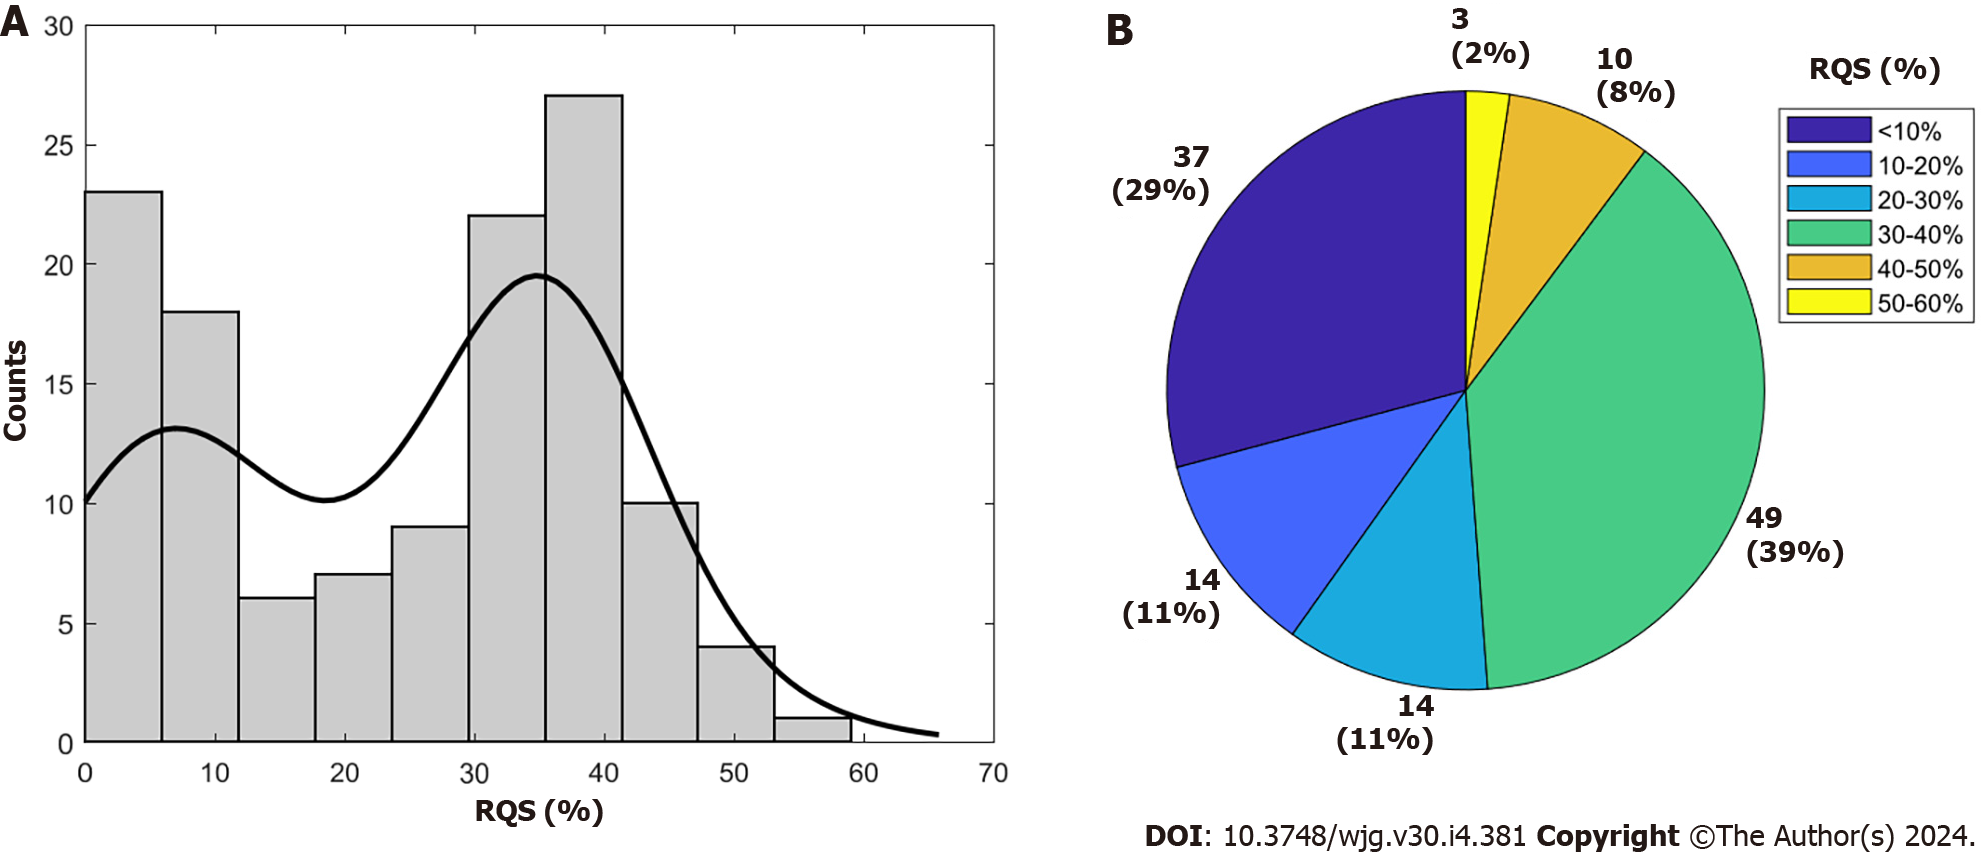
Figure 2 Results of Radiomics Quality Score assessment.
A: Histogram plot of row counts of included studies according to Results of Radiomics Quality Score (RQS) percentage; B: Pie chart of the mean RQS of included studies. RQS: Radiomics Quality Score.
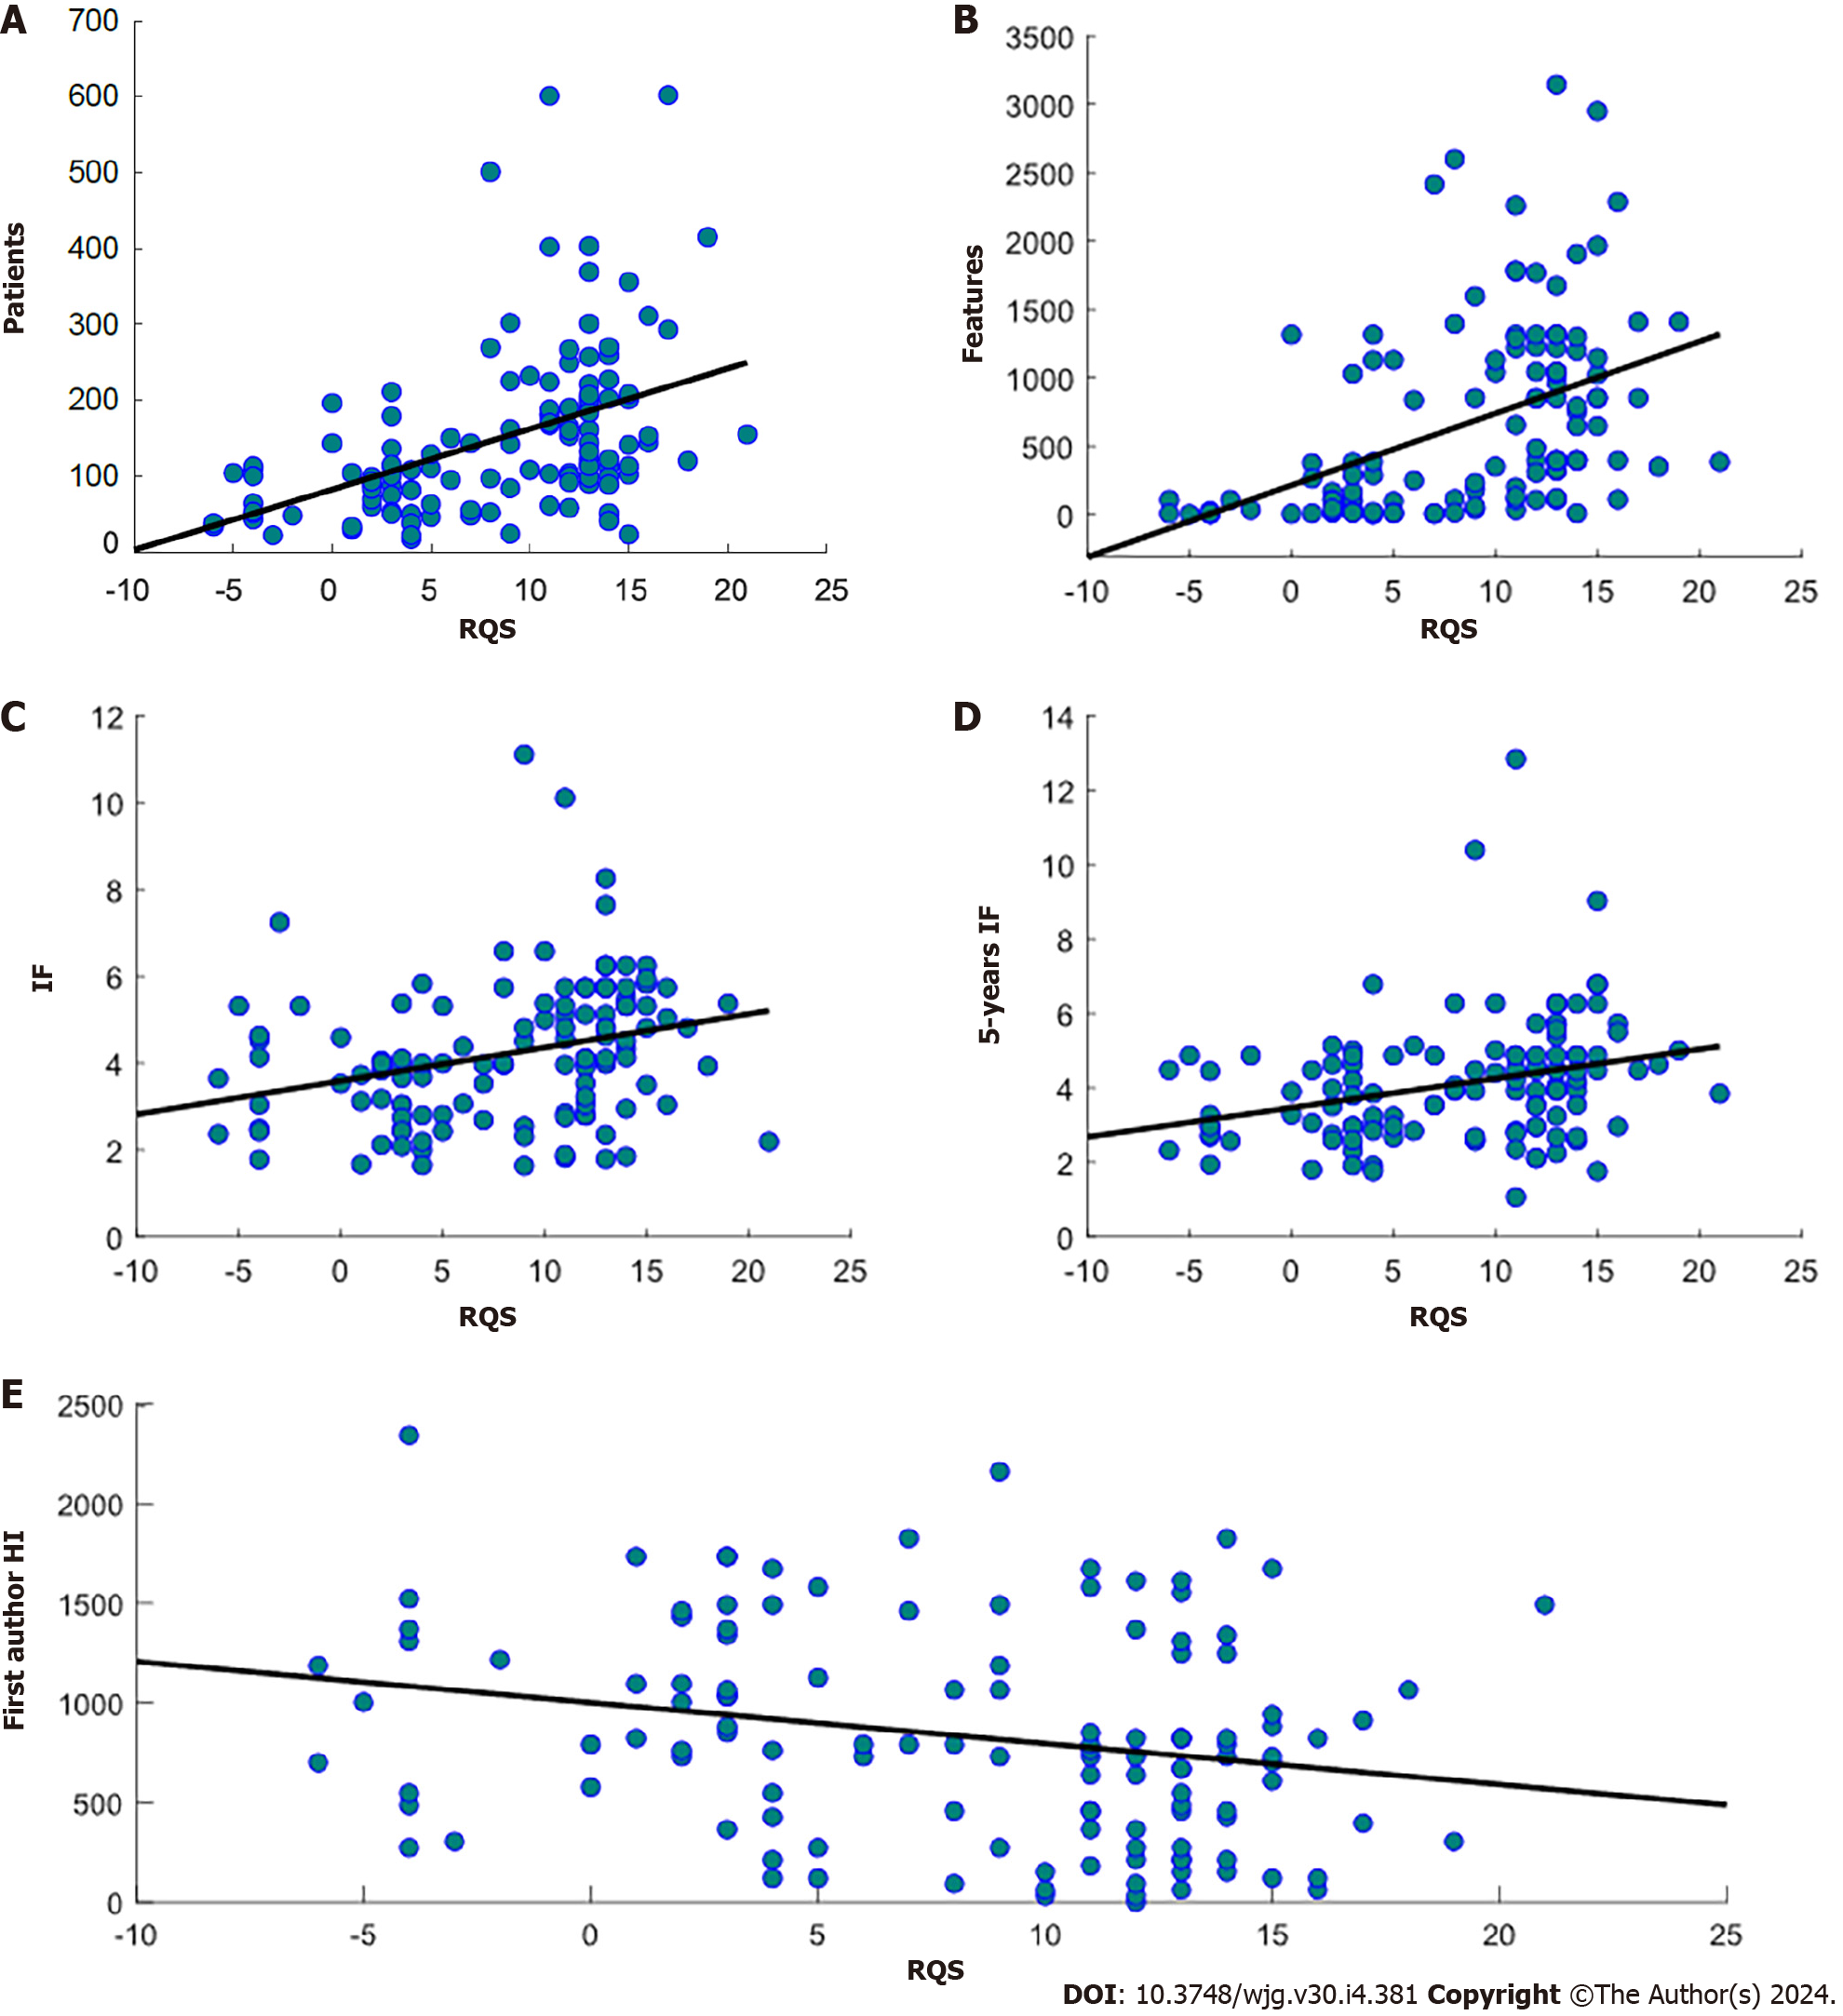
Figure 3 Scatterplots with regression lines showing correlations between Radiomics Quality Score and journal metrics.
A: Correlation between Radiomics Quality Score (RQS) and number of included patients; B: Correlation between RQS and number of radiomic features extracted; C: Correlation between RQS and impact factor (IF); D: Correlation between RQS and 5-years IF; E: Correlation between RQS and first author. Each point corresponds to a study. RQS: Radiomics Quality Score; IF: Impact factor; HI: H-Index.
- Citation: Brancato V, Cerrone M, Garbino N, Salvatore M, Cavaliere C. Current status of magnetic resonance imaging radiomics in hepatocellular carcinoma: A quantitative review with Radiomics Quality Score. World J Gastroenterol 2024; 30(4): 381-417
- URL: https://www.wjgnet.com/1007-9327/full/v30/i4/381.htm
- DOI: https://dx.doi.org/10.3748/wjg.v30.i4.381


