Copyright
©The Author(s) 2024.
World J Gastroenterol. Jan 14, 2024; 30(2): 170-183
Published online Jan 14, 2024. doi: 10.3748/wjg.v30.i2.170
Published online Jan 14, 2024. doi: 10.3748/wjg.v30.i2.170
Figure 1 Visible light image decomposed into R, G, and B channels.
A: Visible light image (original image); B: R channel image; C: G channel image; D: B channel image.
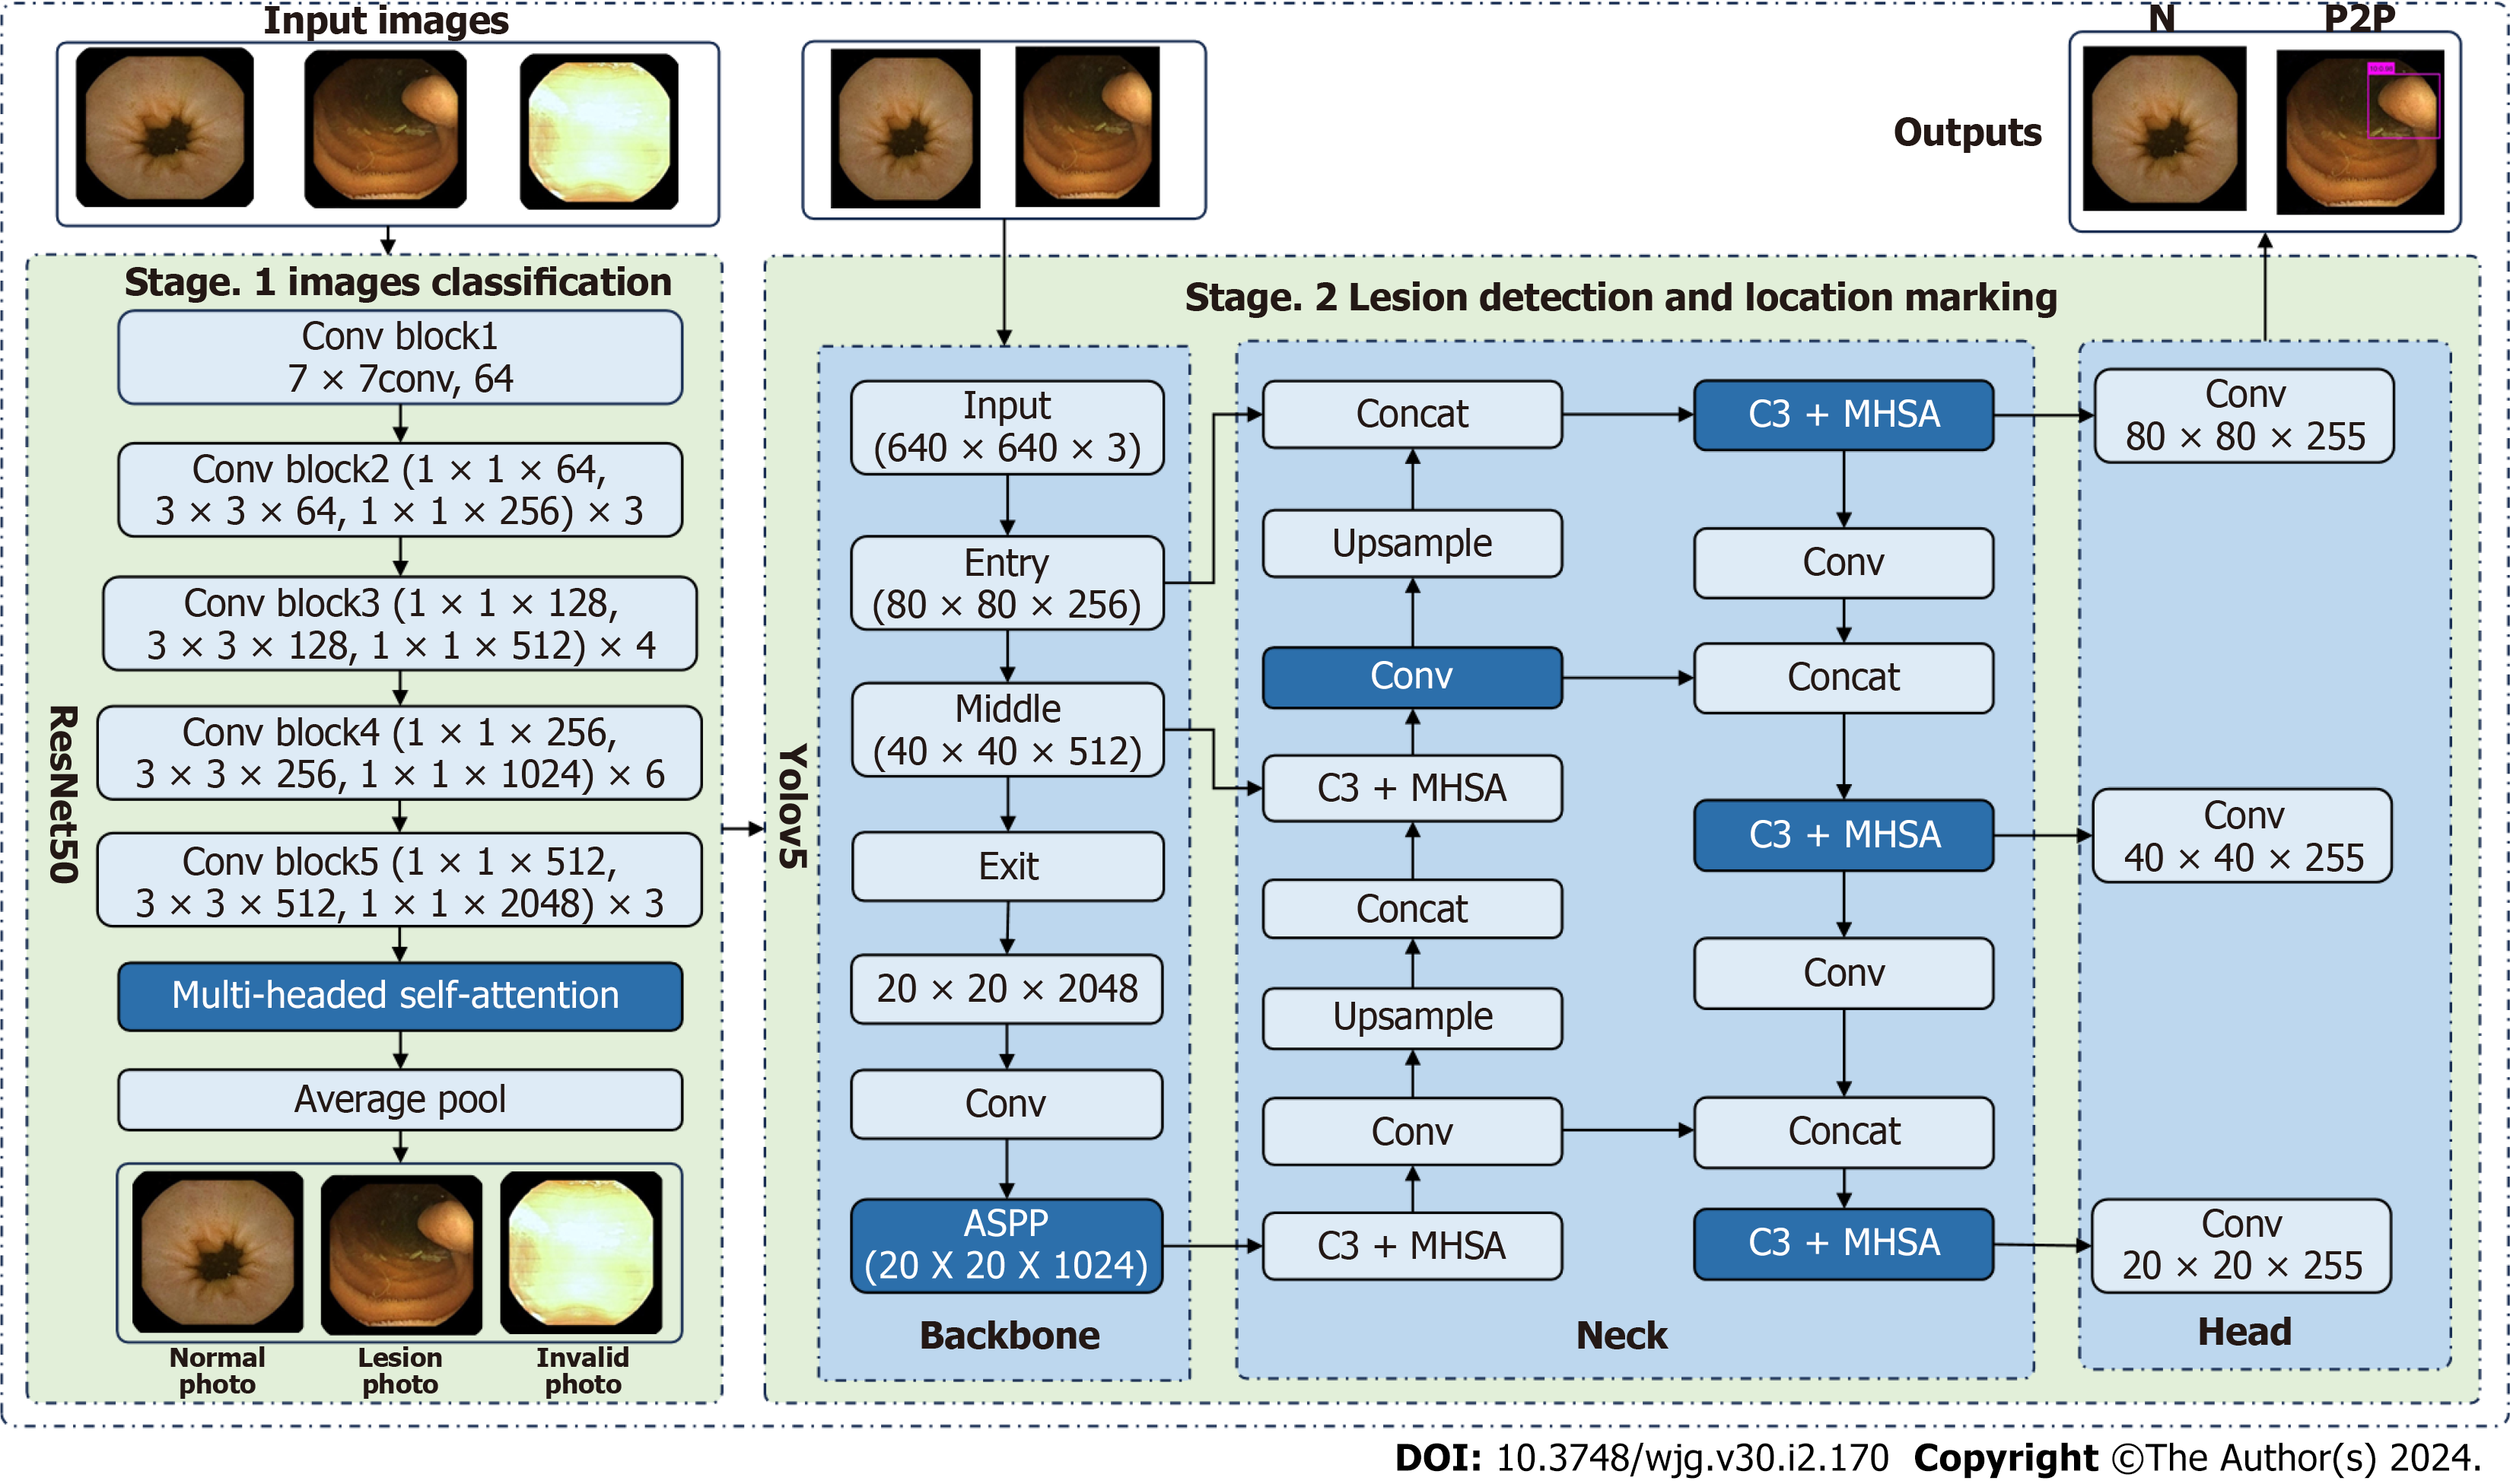
Figure 2 Overview of the proposed framework.
ASPP: Atrous Spatial Pyramid Pooling; MHSA: Multi-head self-attention; N: Normal; P2P: Protruding lesion larger than 1 cm.
Figure 3 Representative examples of invalid images and normal small bowel mucosa images.
A: Bowel contents; B: Air bubbles; C: Overexposure; D: Oral cavity; E: Normal small bowel mucosa.
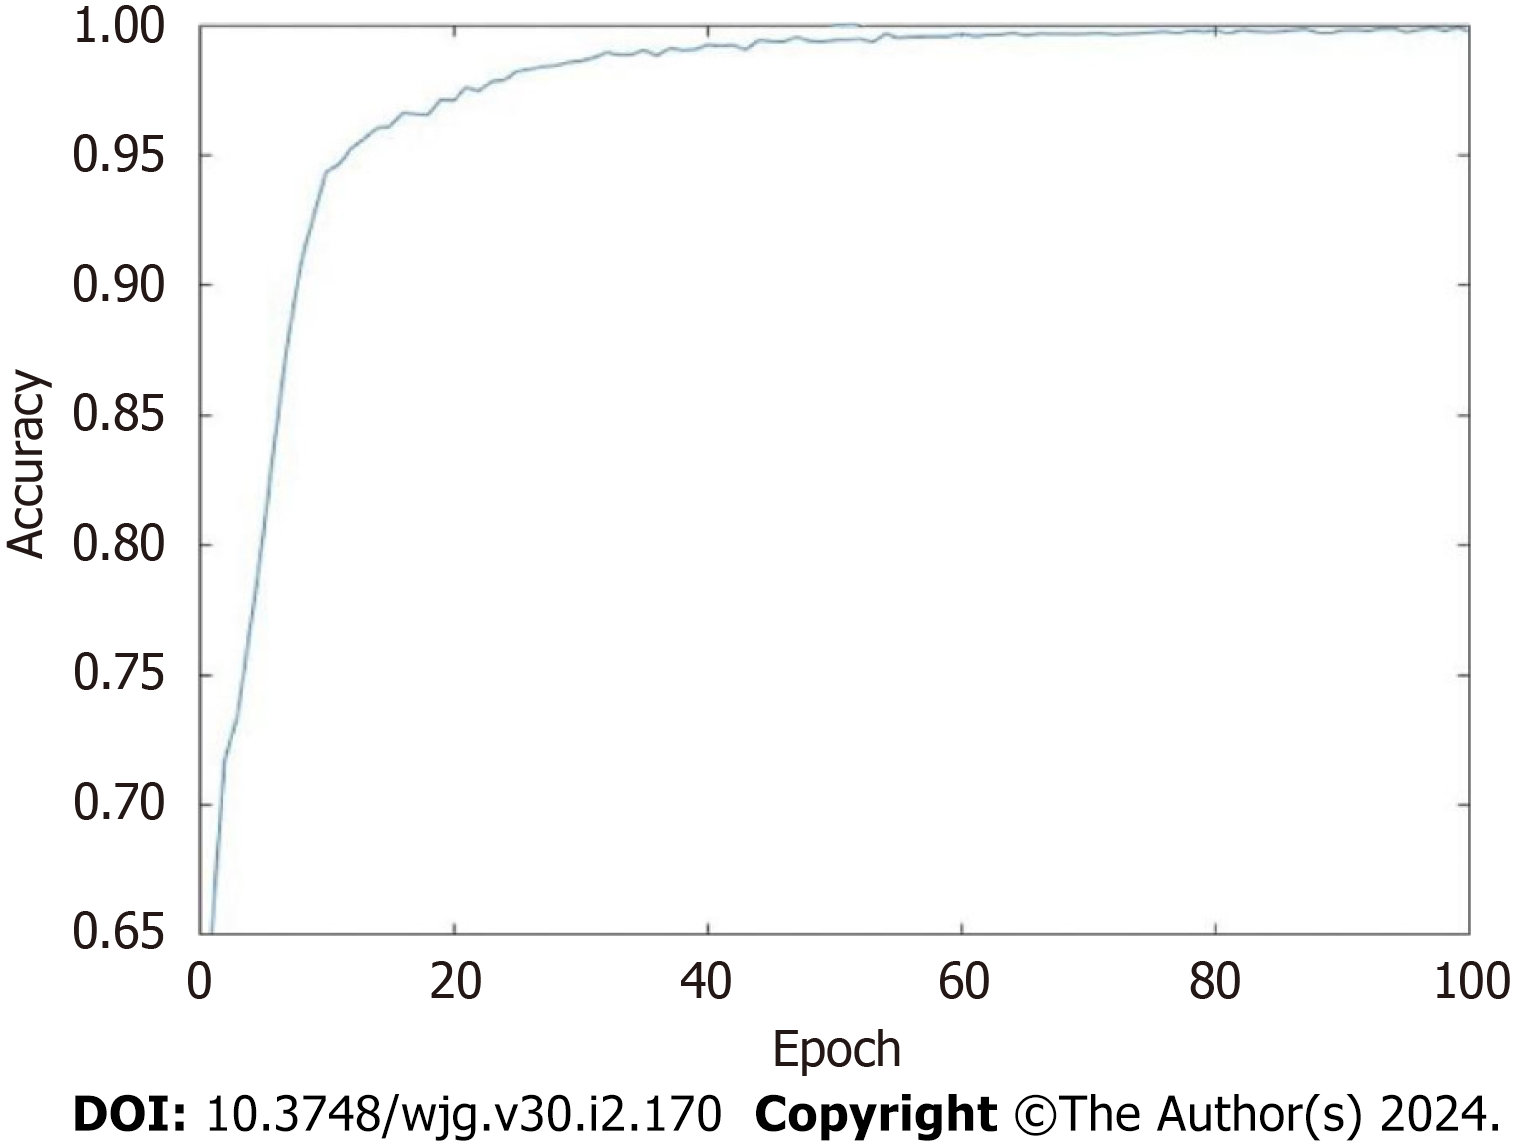
Figure 4 Trend plot of accuracy vs epoch.
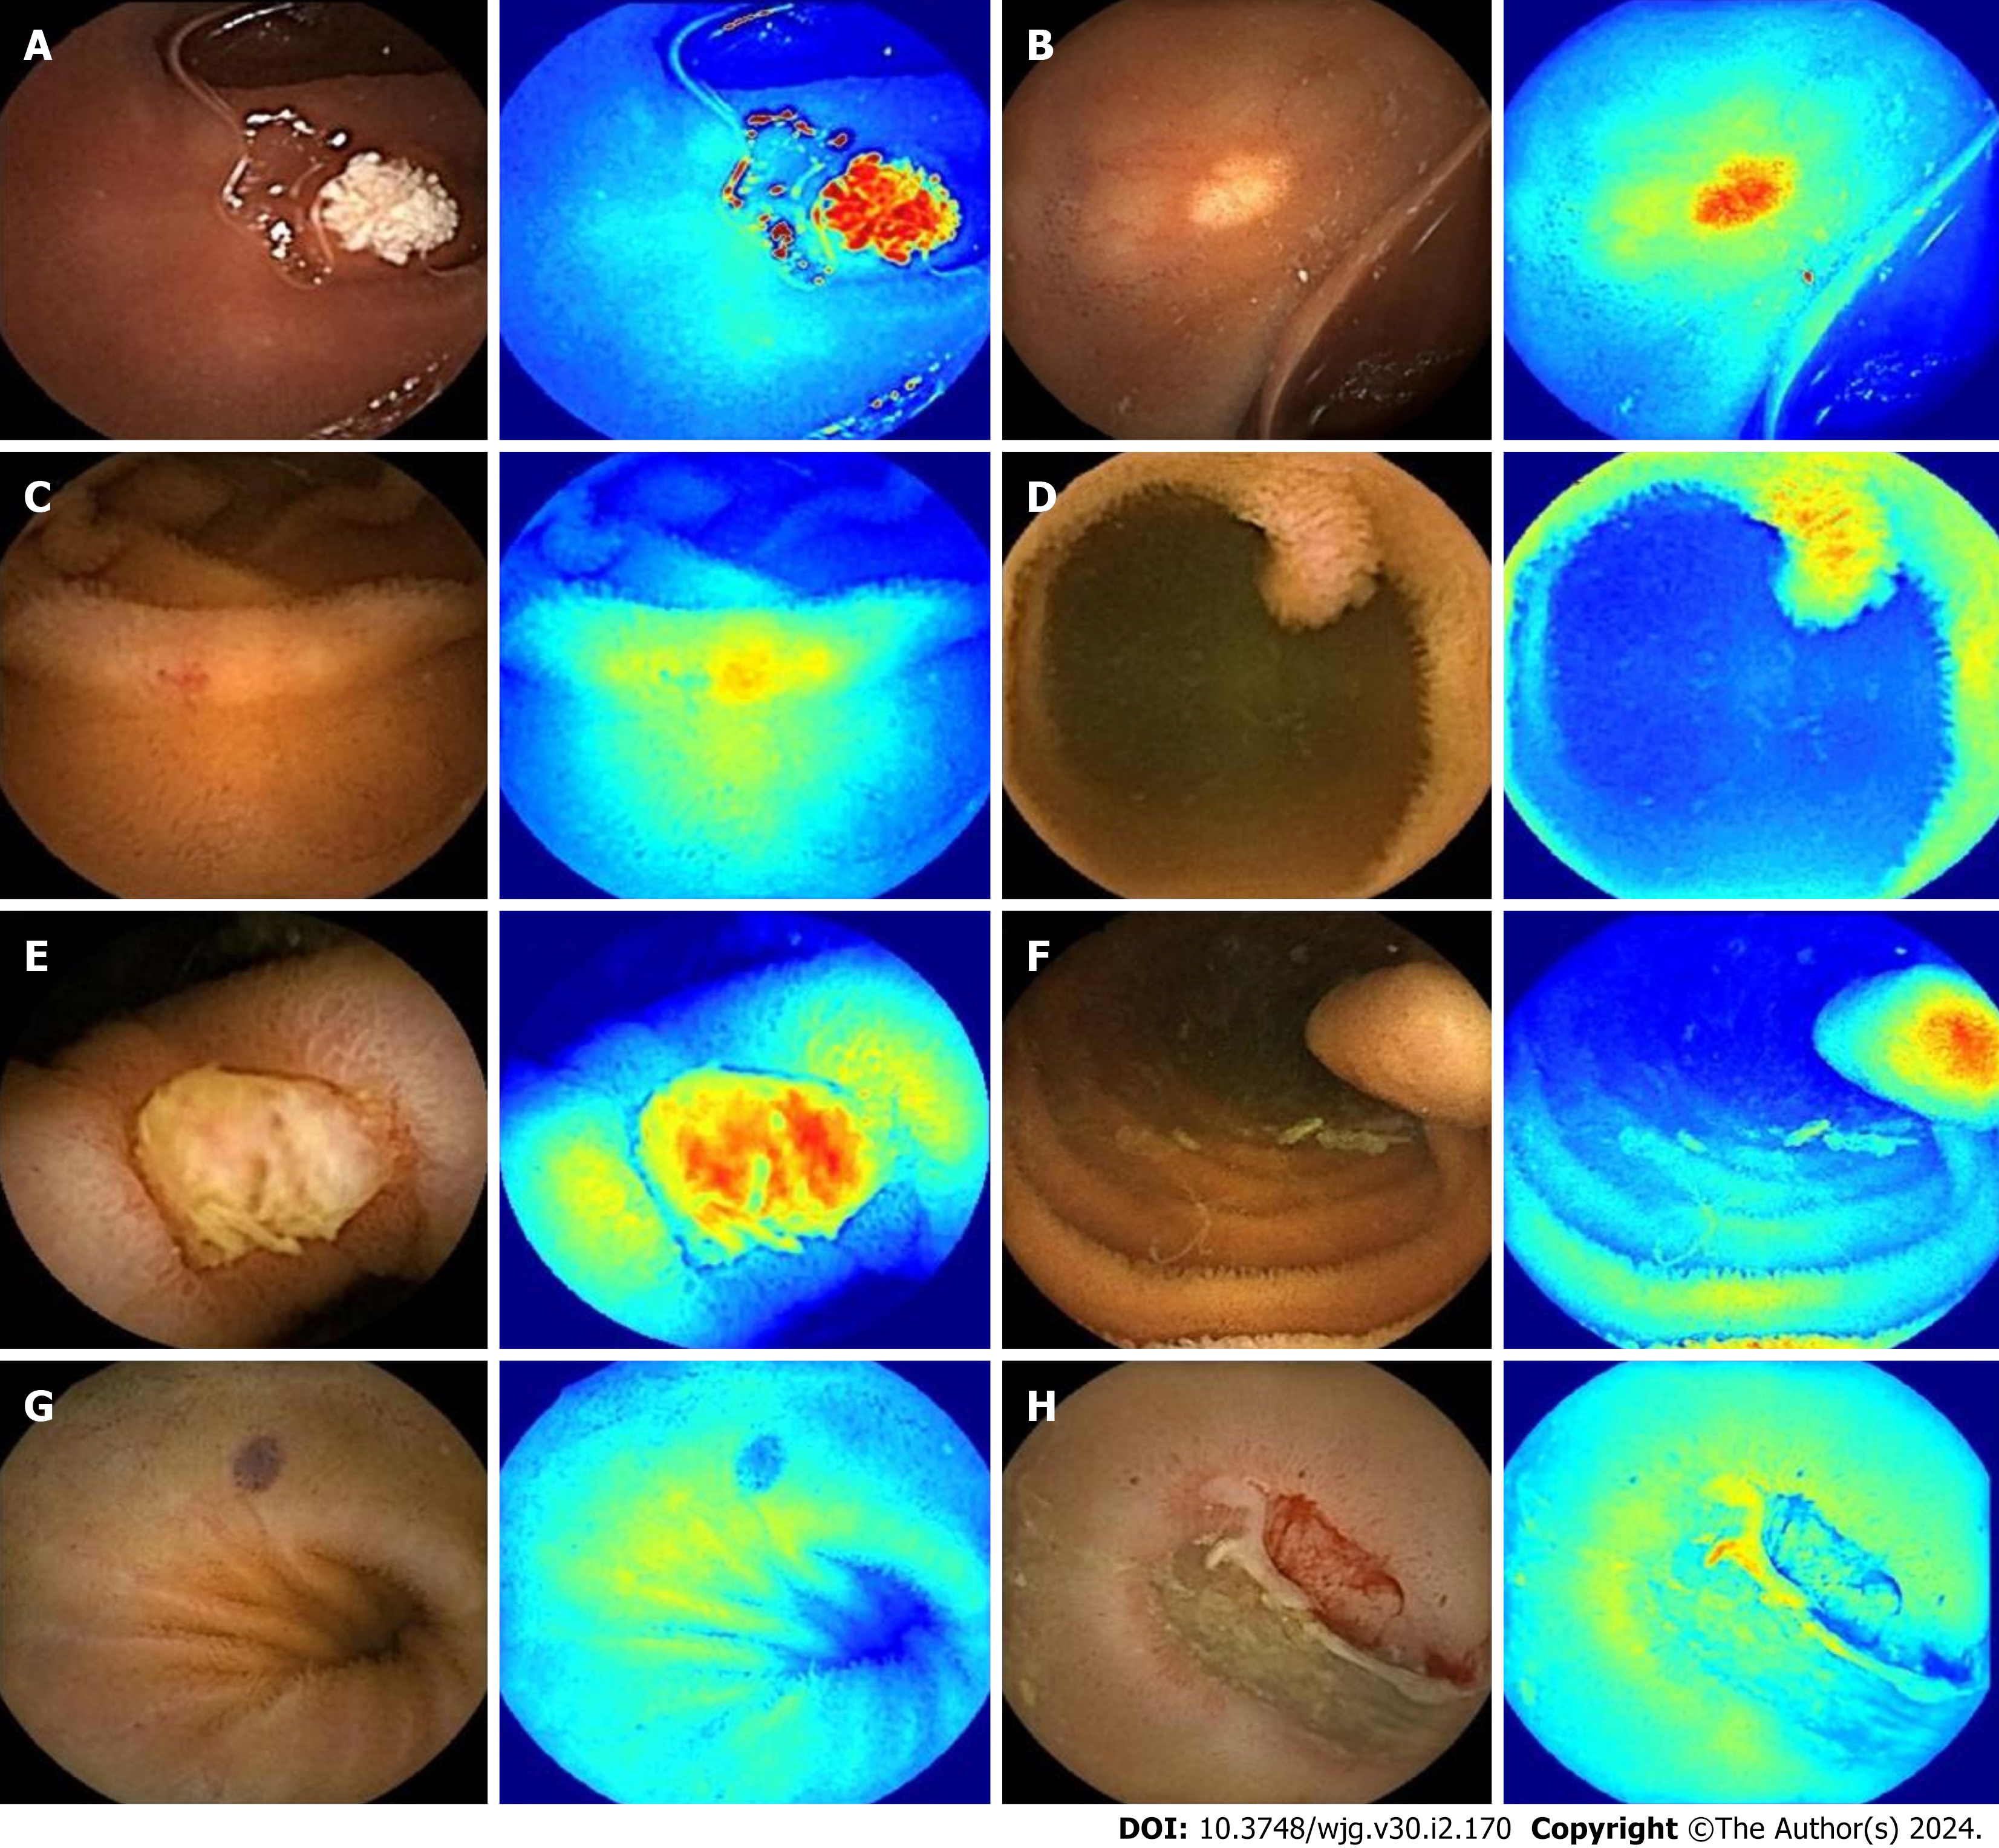
Figure 5 Software-generated image representation of the heat map.
A: P0Lk (lymphangiectasia); B: P0X (xanthoma); C: P1E (erosion); D: P1P (protruding lesion smaller than 1 cm); E: P2U (ulcer larger than 2 cm); F: P2P (protruding lesion larger than 1 cm); G: P2V (vascular lesion); H: B (bleeding).
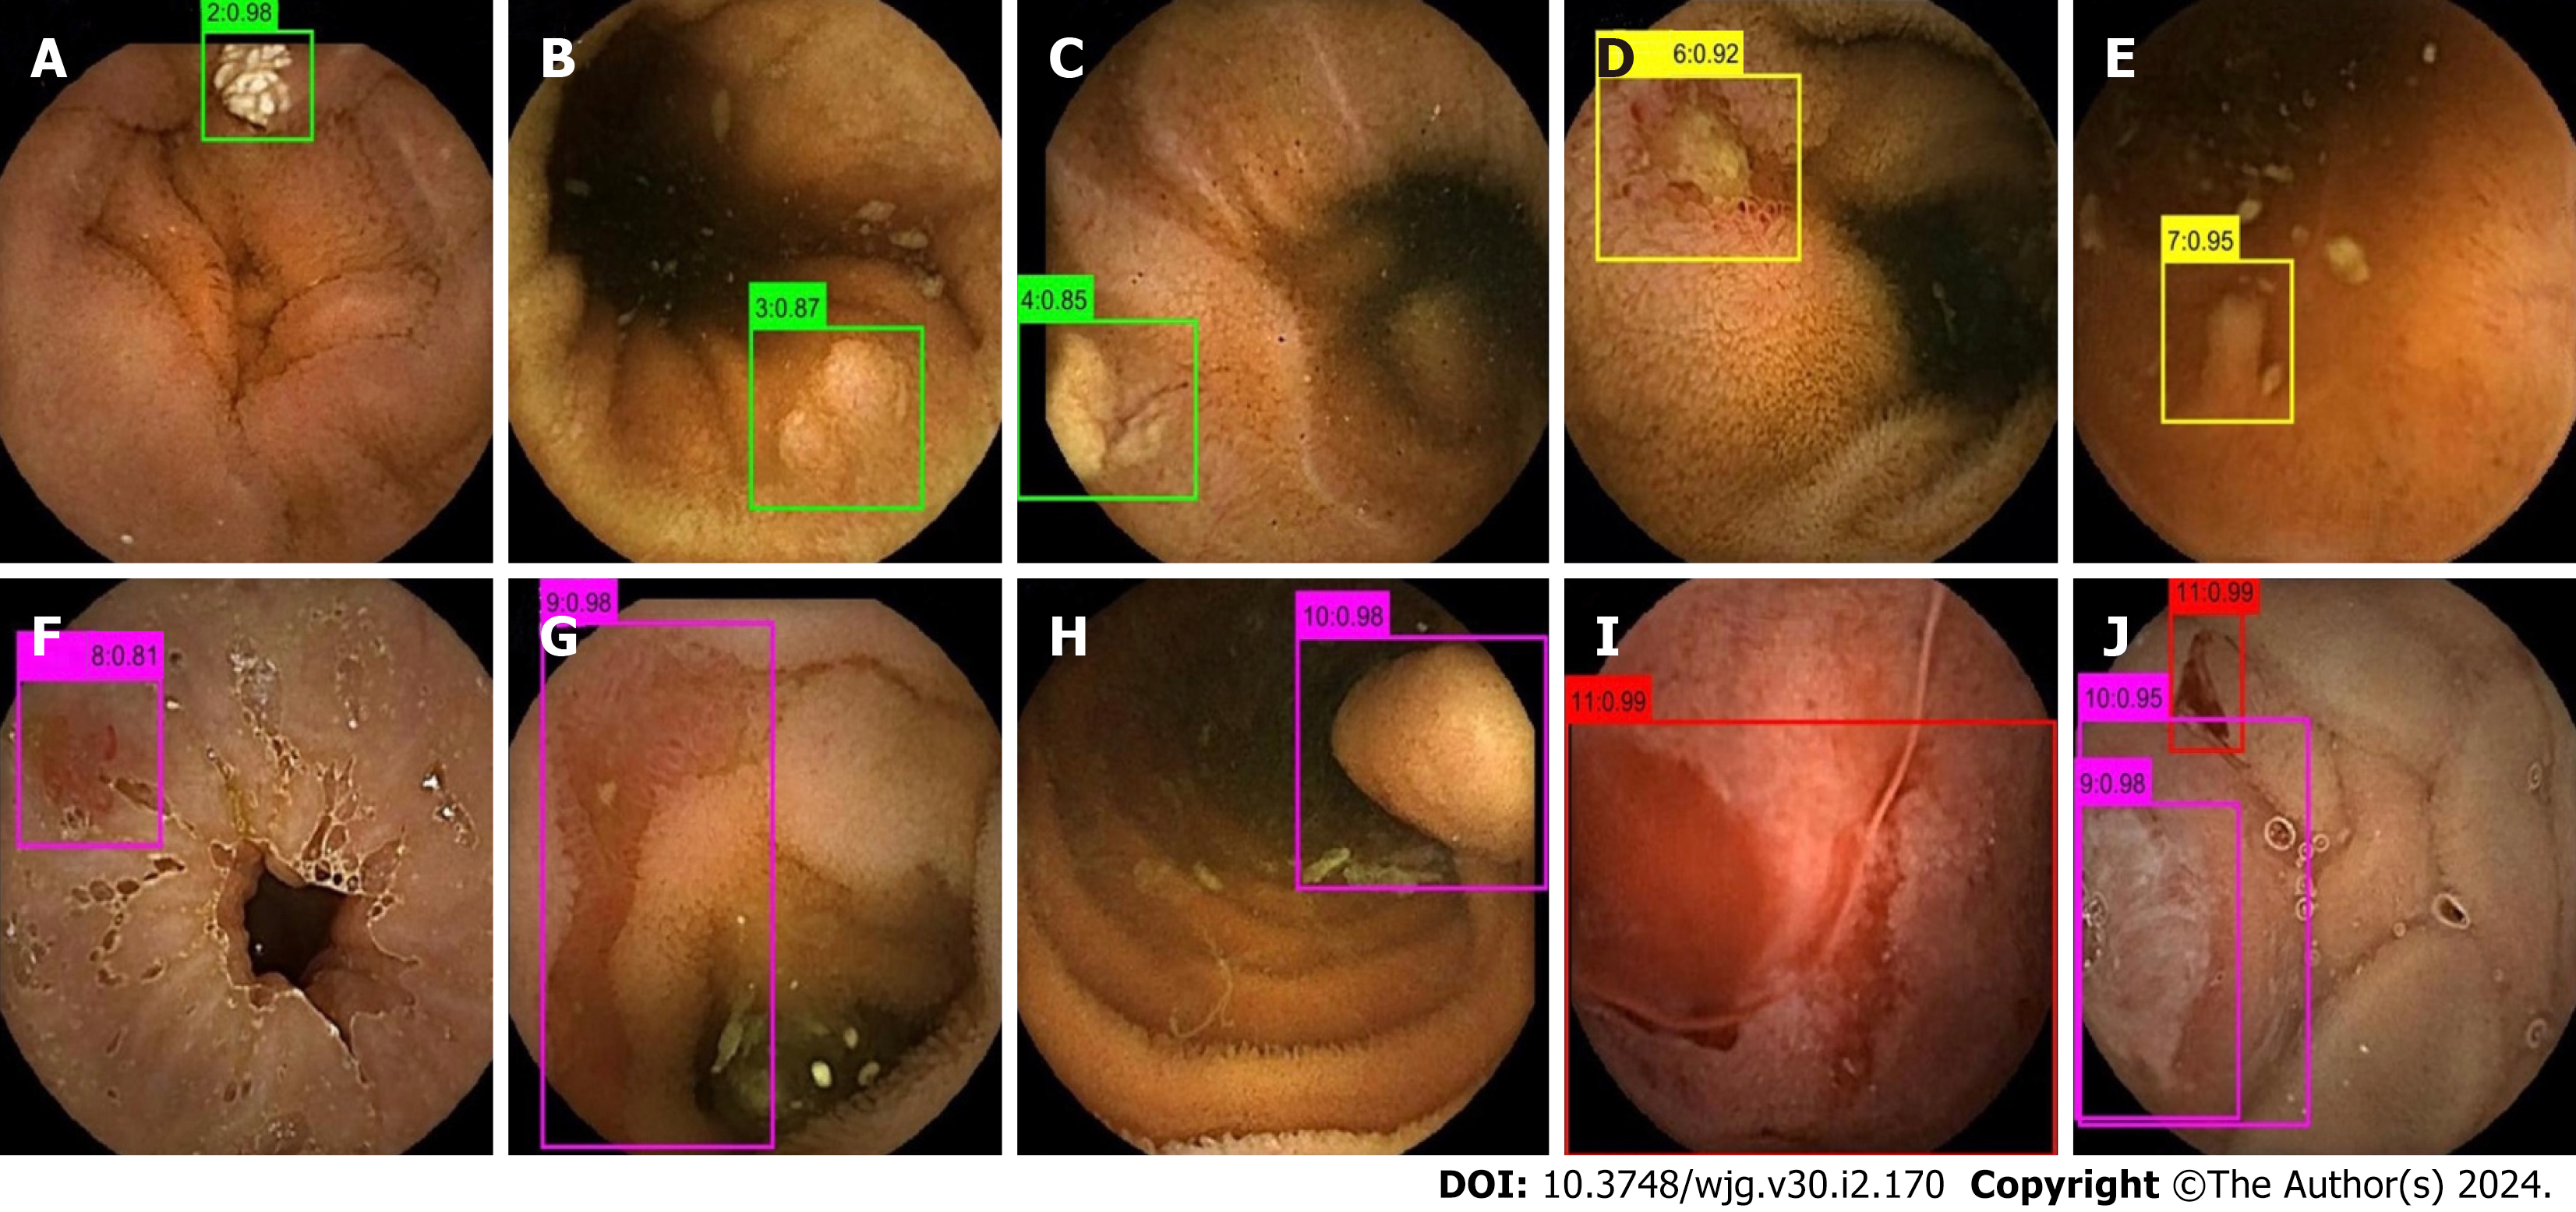
Figure 6 Output of YOLO-V5.
Boxes with different colors in the output image represent different bleeding risks; Green represents no bleeding risk; Yellow represents uncertain risk of bleeding; Magenta represents high bleeding risk; Red represents bleeding. Different numbers in the output image represent different lesion types. A: P0Lk (lymphangiectasia); B: P0Lz (lymphoid follicular hyperplasia); C: P0X (xanthoma); D: P1U (ulcer smaller than 2 cm); E: P1P (protruding lesion smaller than 1 cm); F: P2V (vascular lesion); G: P2U (ulcer larger than 2 cm); H: P2P (protruding lesion larger than 1 cm); I: Bleeding (B); J: P2P (protruding lesion larger than 1 cm), P2U (ulcer larger than 2 cm), and B. Decimal point represents probability.
- Citation: Zhang RY, Qiang PP, Cai LJ, Li T, Qin Y, Zhang Y, Zhao YQ, Wang JP. Automatic detection of small bowel lesions with different bleeding risks based on deep learning models. World J Gastroenterol 2024; 30(2): 170-183
- URL: https://www.wjgnet.com/1007-9327/full/v30/i2/170.htm
- DOI: https://dx.doi.org/10.3748/wjg.v30.i2.170


