Copyright
©The Author(s) 2023.
World J Gastroenterol. Nov 21, 2023; 29(43): 5804-5817
Published online Nov 21, 2023. doi: 10.3748/wjg.v29.i43.5804
Published online Nov 21, 2023. doi: 10.3748/wjg.v29.i43.5804
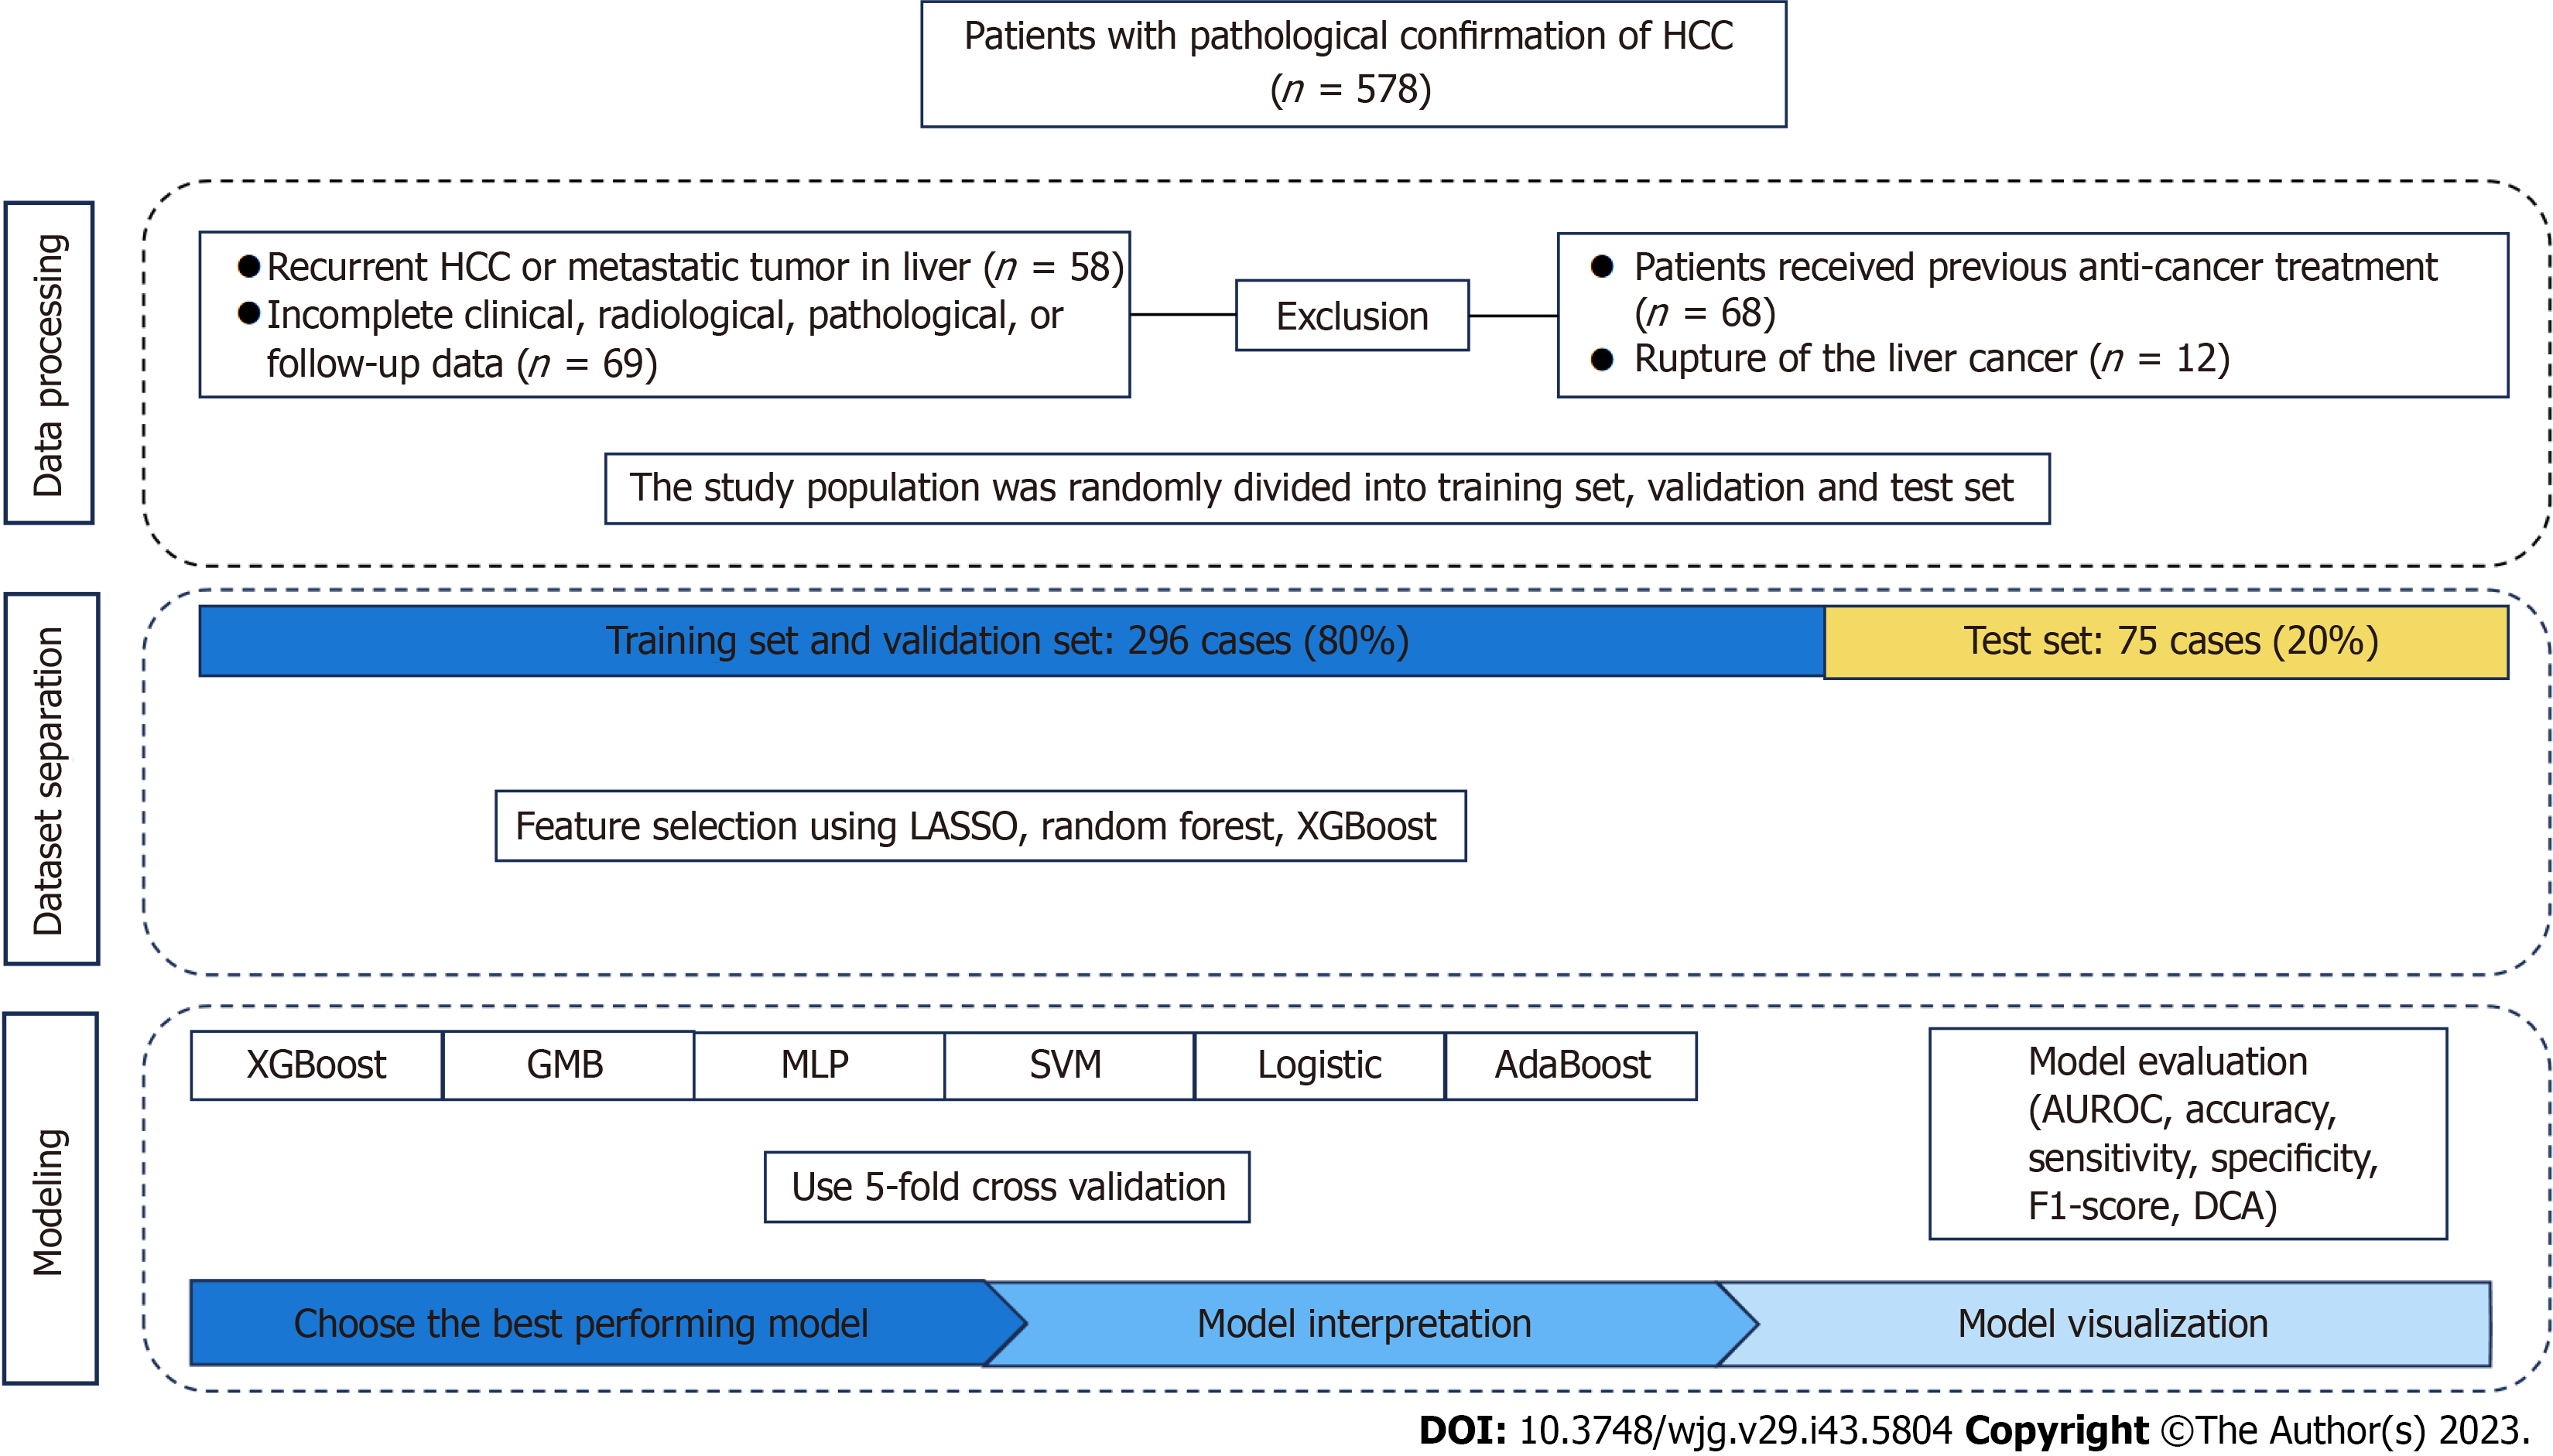
Figure 1 Flow chart of the study process.
HCC: Hepatocellular carcinoma; AUROC: Area under the receiver operating characteristic curve; DCA: Decision curve analysis; GNB: Complement NB; MLP: Multilayer perceptron; SVM: Support vector machine.
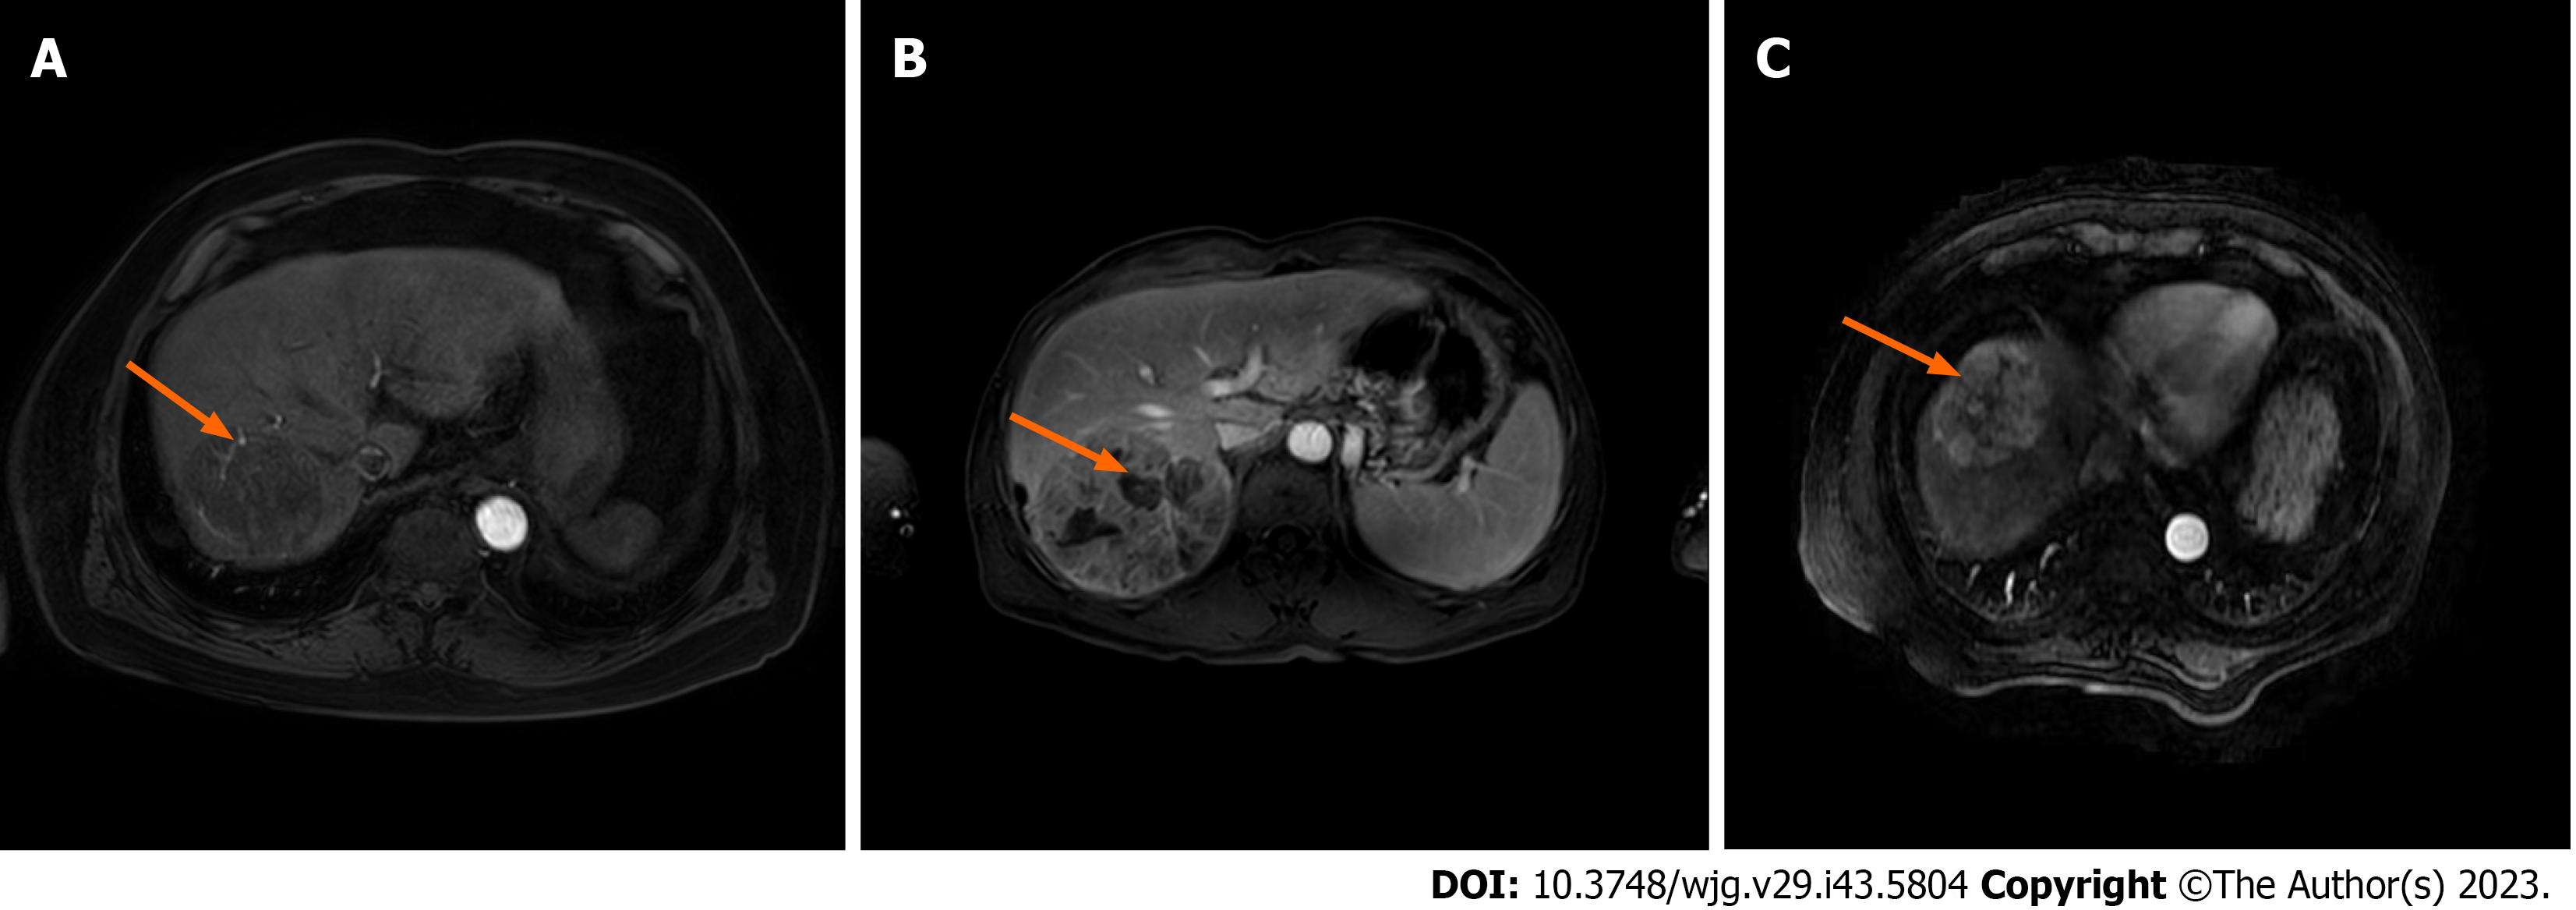
Figure 2 Representative magnetic resonance imaging images.
A: Intratumoral arteries; B: Intratumoral necrosis; C: Uniform tumor enhancement.
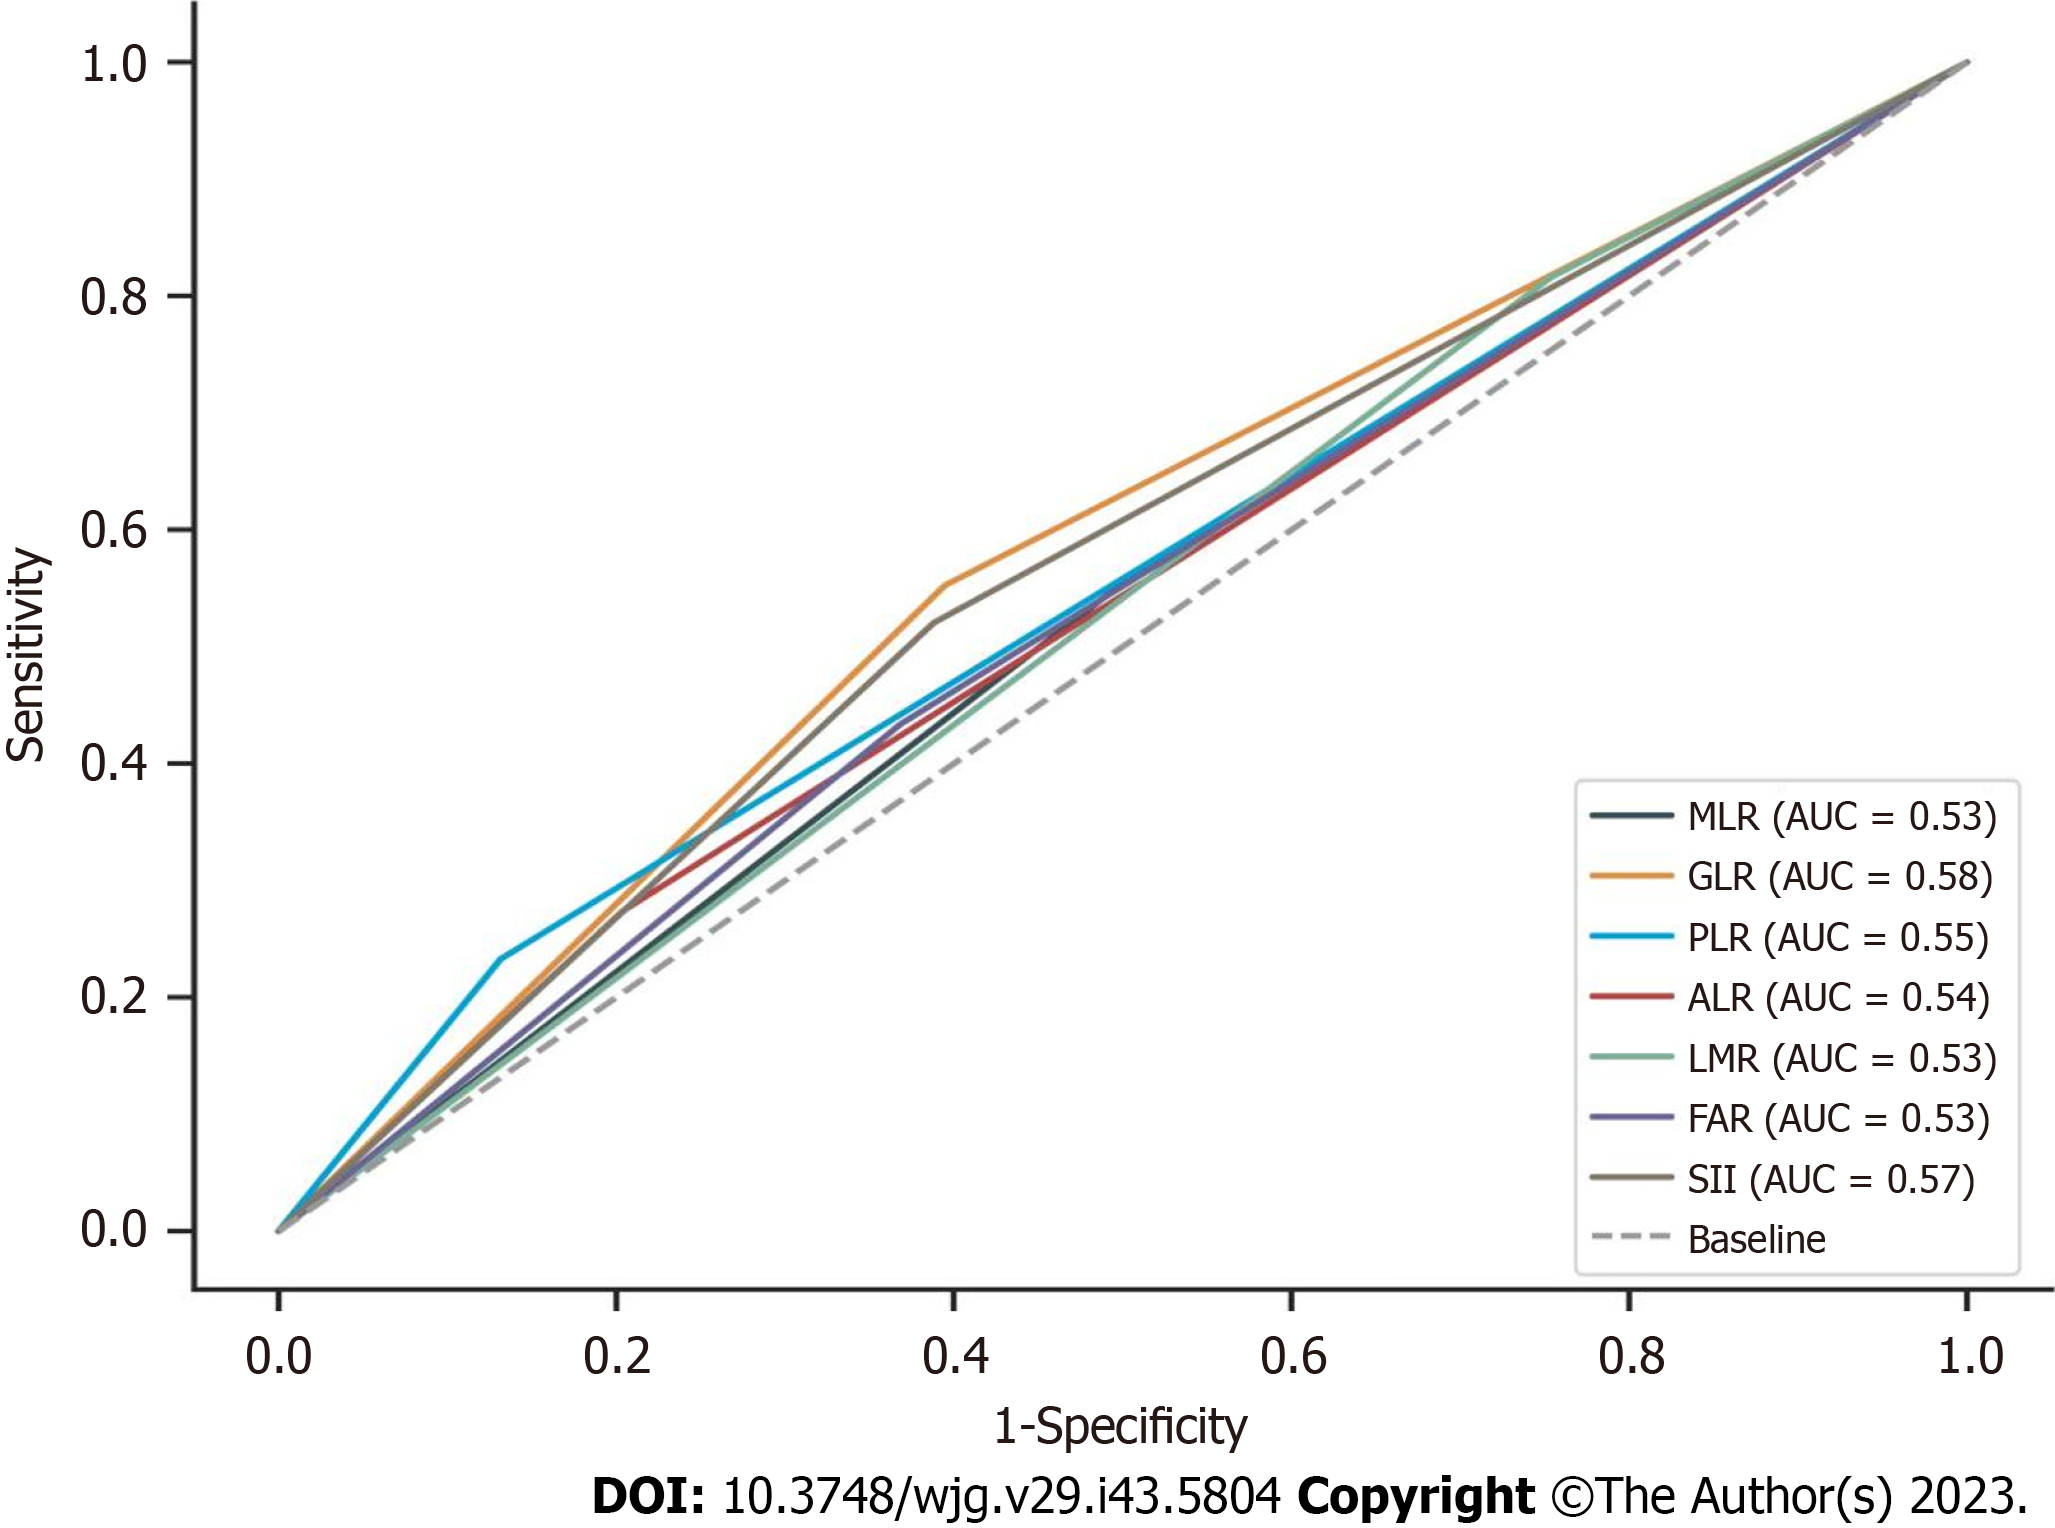
Figure 3 Receiver operating characteristic curve analyses of diagnostic performance of monocyte to lymphocyte ratio, γ-glutamyl transferase to lymphocyte ratio, platelet count to lymphocyte count ratio, alkaline phosphatase to lymphocyte count ratio, lymphocyte to monocyte count ratio, fibrinogen to albumin level ratio, or systemic immune-inflammation index.
AUC: Area under the curve; MLR: Monocyte to lymphocyte ratio; GLR: γ-glutamyl transferase to lymphocyte ratio; PLR: Platelet count to lymphocyte count ratio; ALR: Alkaline phosphatase to lymphocyte count ratio; LMR: Lymphocyte to monocyte count; FAR: Fibrinogen to albumin level ratio; SII: Systemic immune-inflammation index.
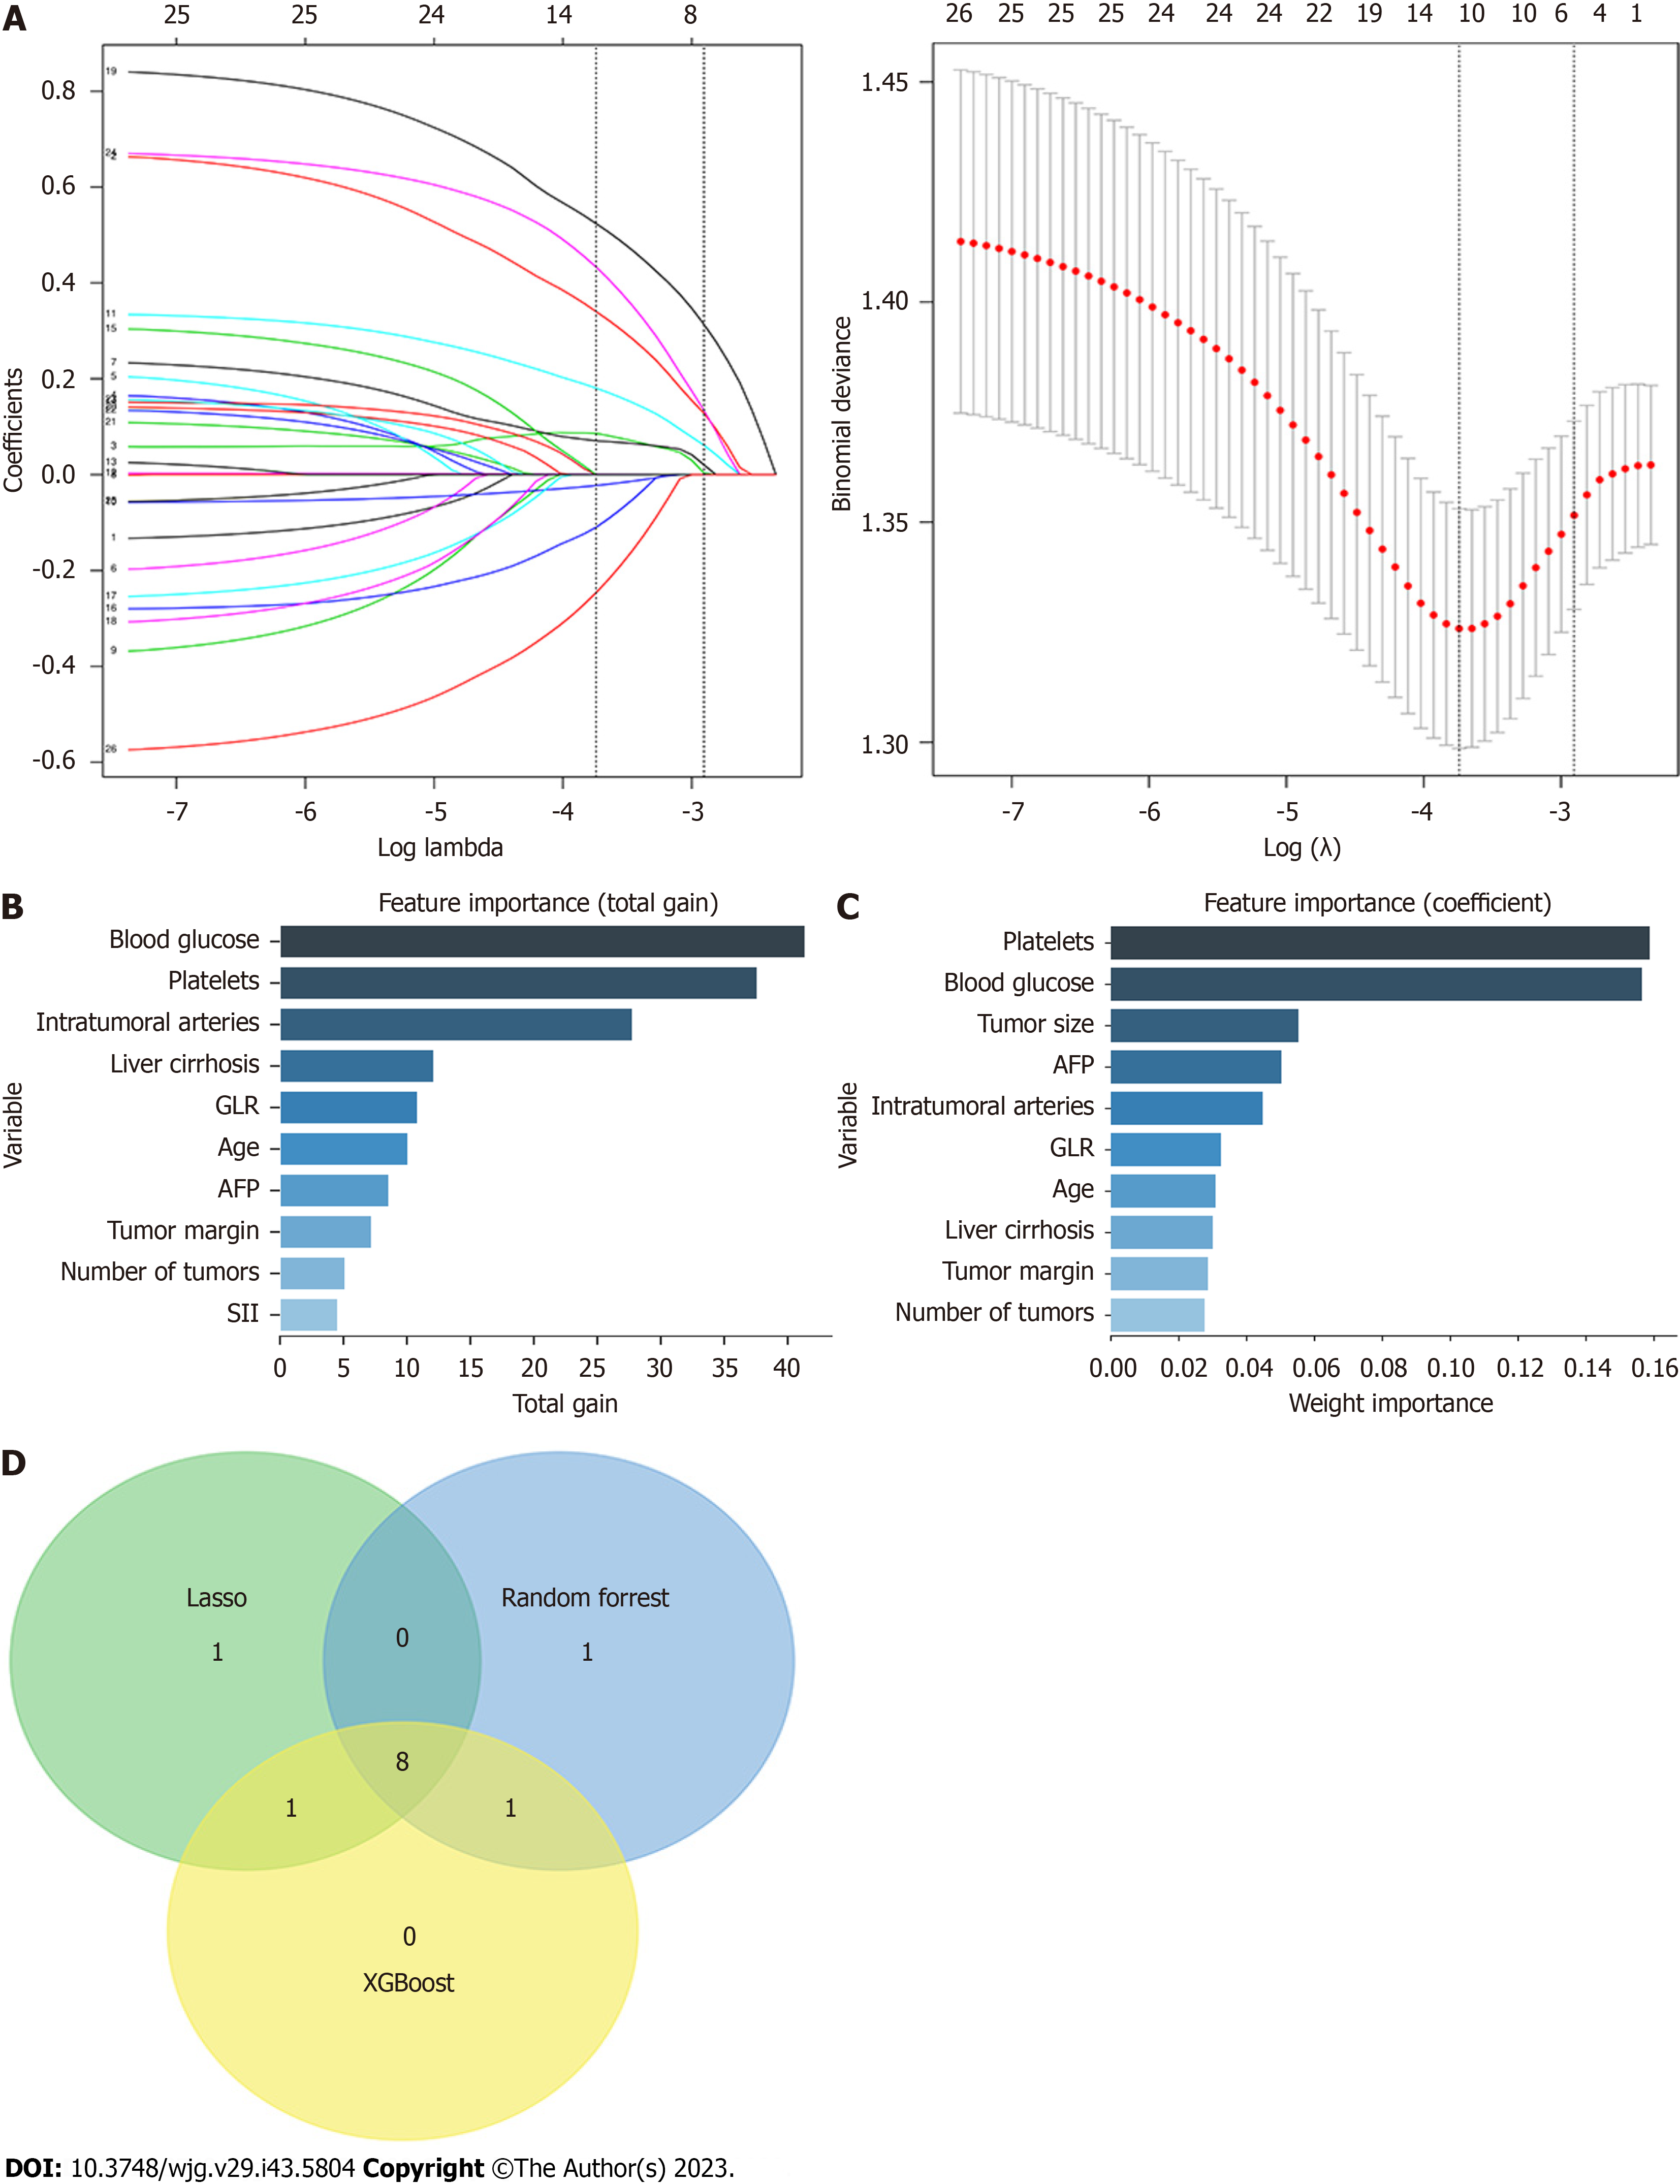
Figure 4 Importance of feature variables analyzed by LASSO regression, XGBoost, and random forest, and top 10 variables ranked in their importance from the highest to lowest and selected.
The Venn diagram was drawn by selecting the features common to all three models (taking the intersection). A: LASSO regression with a vertical line was drawn at the value selected using the ten-fold cross-validation, and a minimum mean square error of λ of 0.024 was chosen to obtain the characteristics of the 11 non-zero coefficients; B: The importance of variable features was analyzed using the XGBoost algorithm; C: The importance of variable features was analyzed using the random forest algorithm; D: Venn diagram with eight key characteristic variables at the intersection: Age, intratumoral arteries, alpha-fetoprotein, blood glucose, number of tumors, γ-glutamyl transferase to lymphocyte ratio, liver cirrhosis, and platelets. AFP: alpha-fetoprotein; GLR: γ-glutamyl transferase to lymphocyte ratio; SII: Systemic immune-inflammation index.
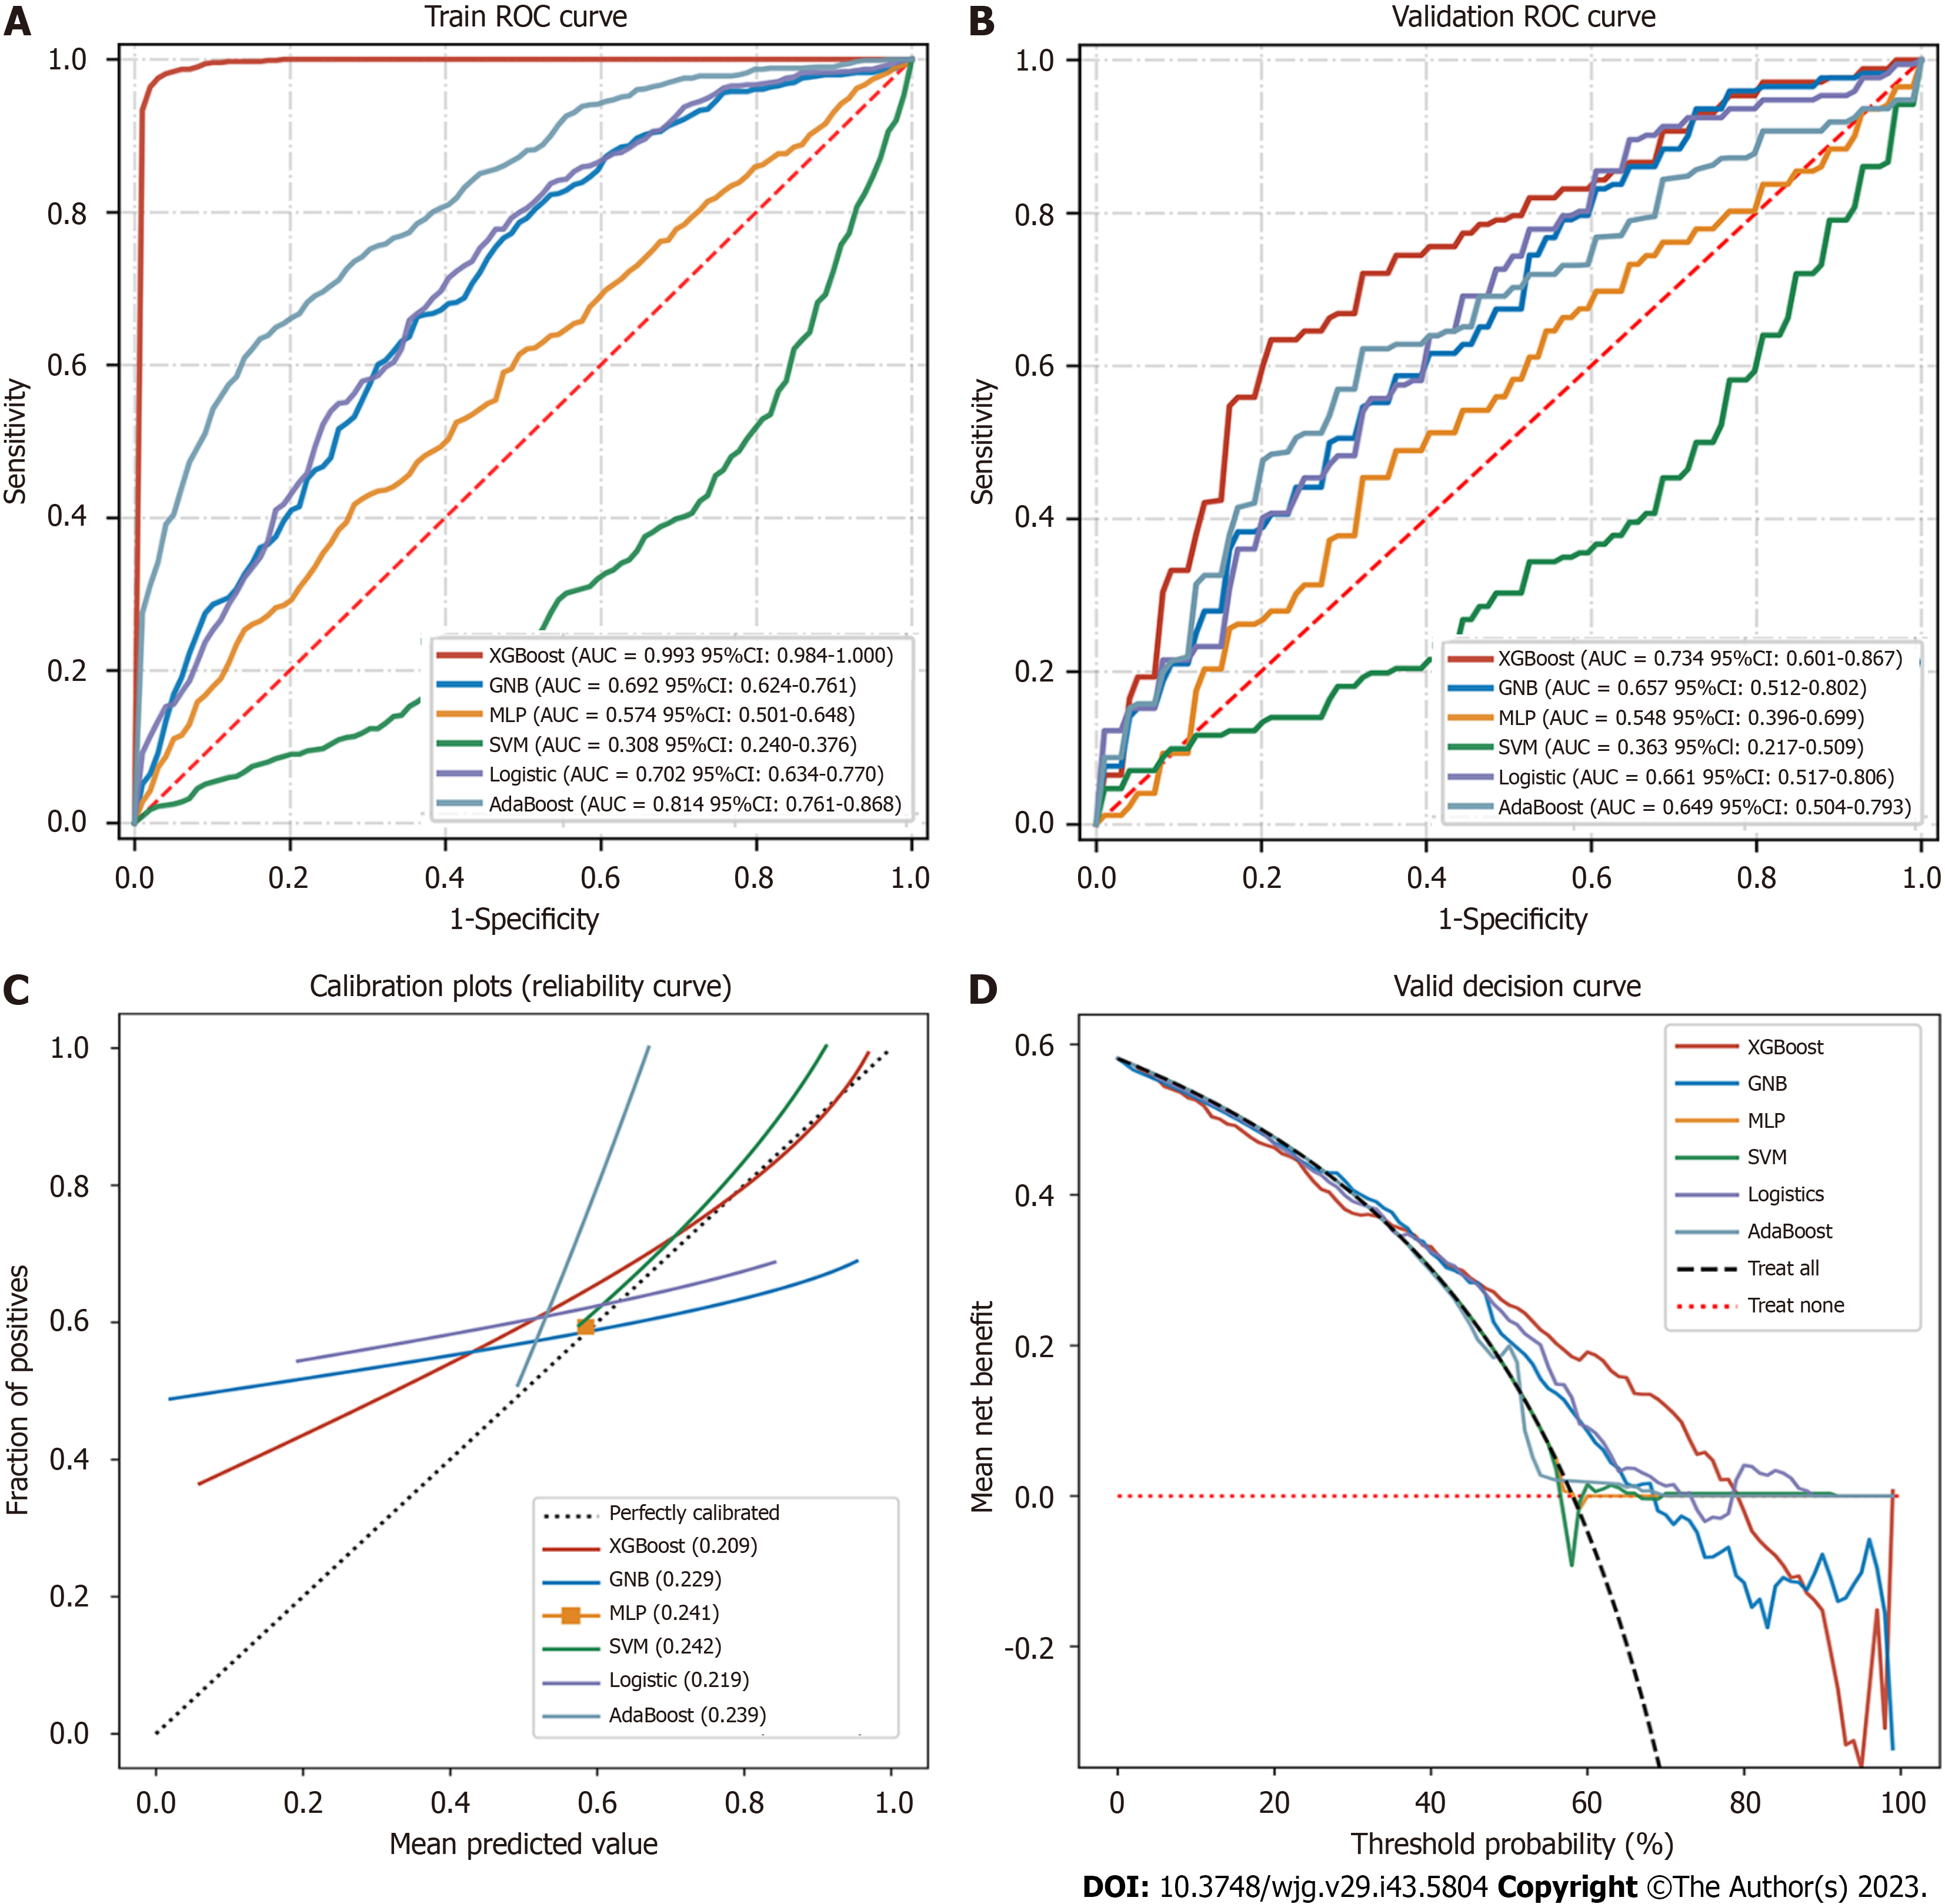
Figure 5 Receiver operating characteristic analyses and validation of six prediction models.
A: Receiver operating characteristic (ROC) curves of the six prediction models in the training dataset; B: ROC curves of the six prediction models in the validation dataset after five-fold cross-validation; C: Calibration plots of nine models. The XGBoost achieved lower (better) Brier scores than the other models; D: Decision curve analysis of six machine learning models. The XGBoost model is the best diagnostic tool for early postoperative hepatocellular carcinoma recurrence. ROC: Receiver operating characteristic.
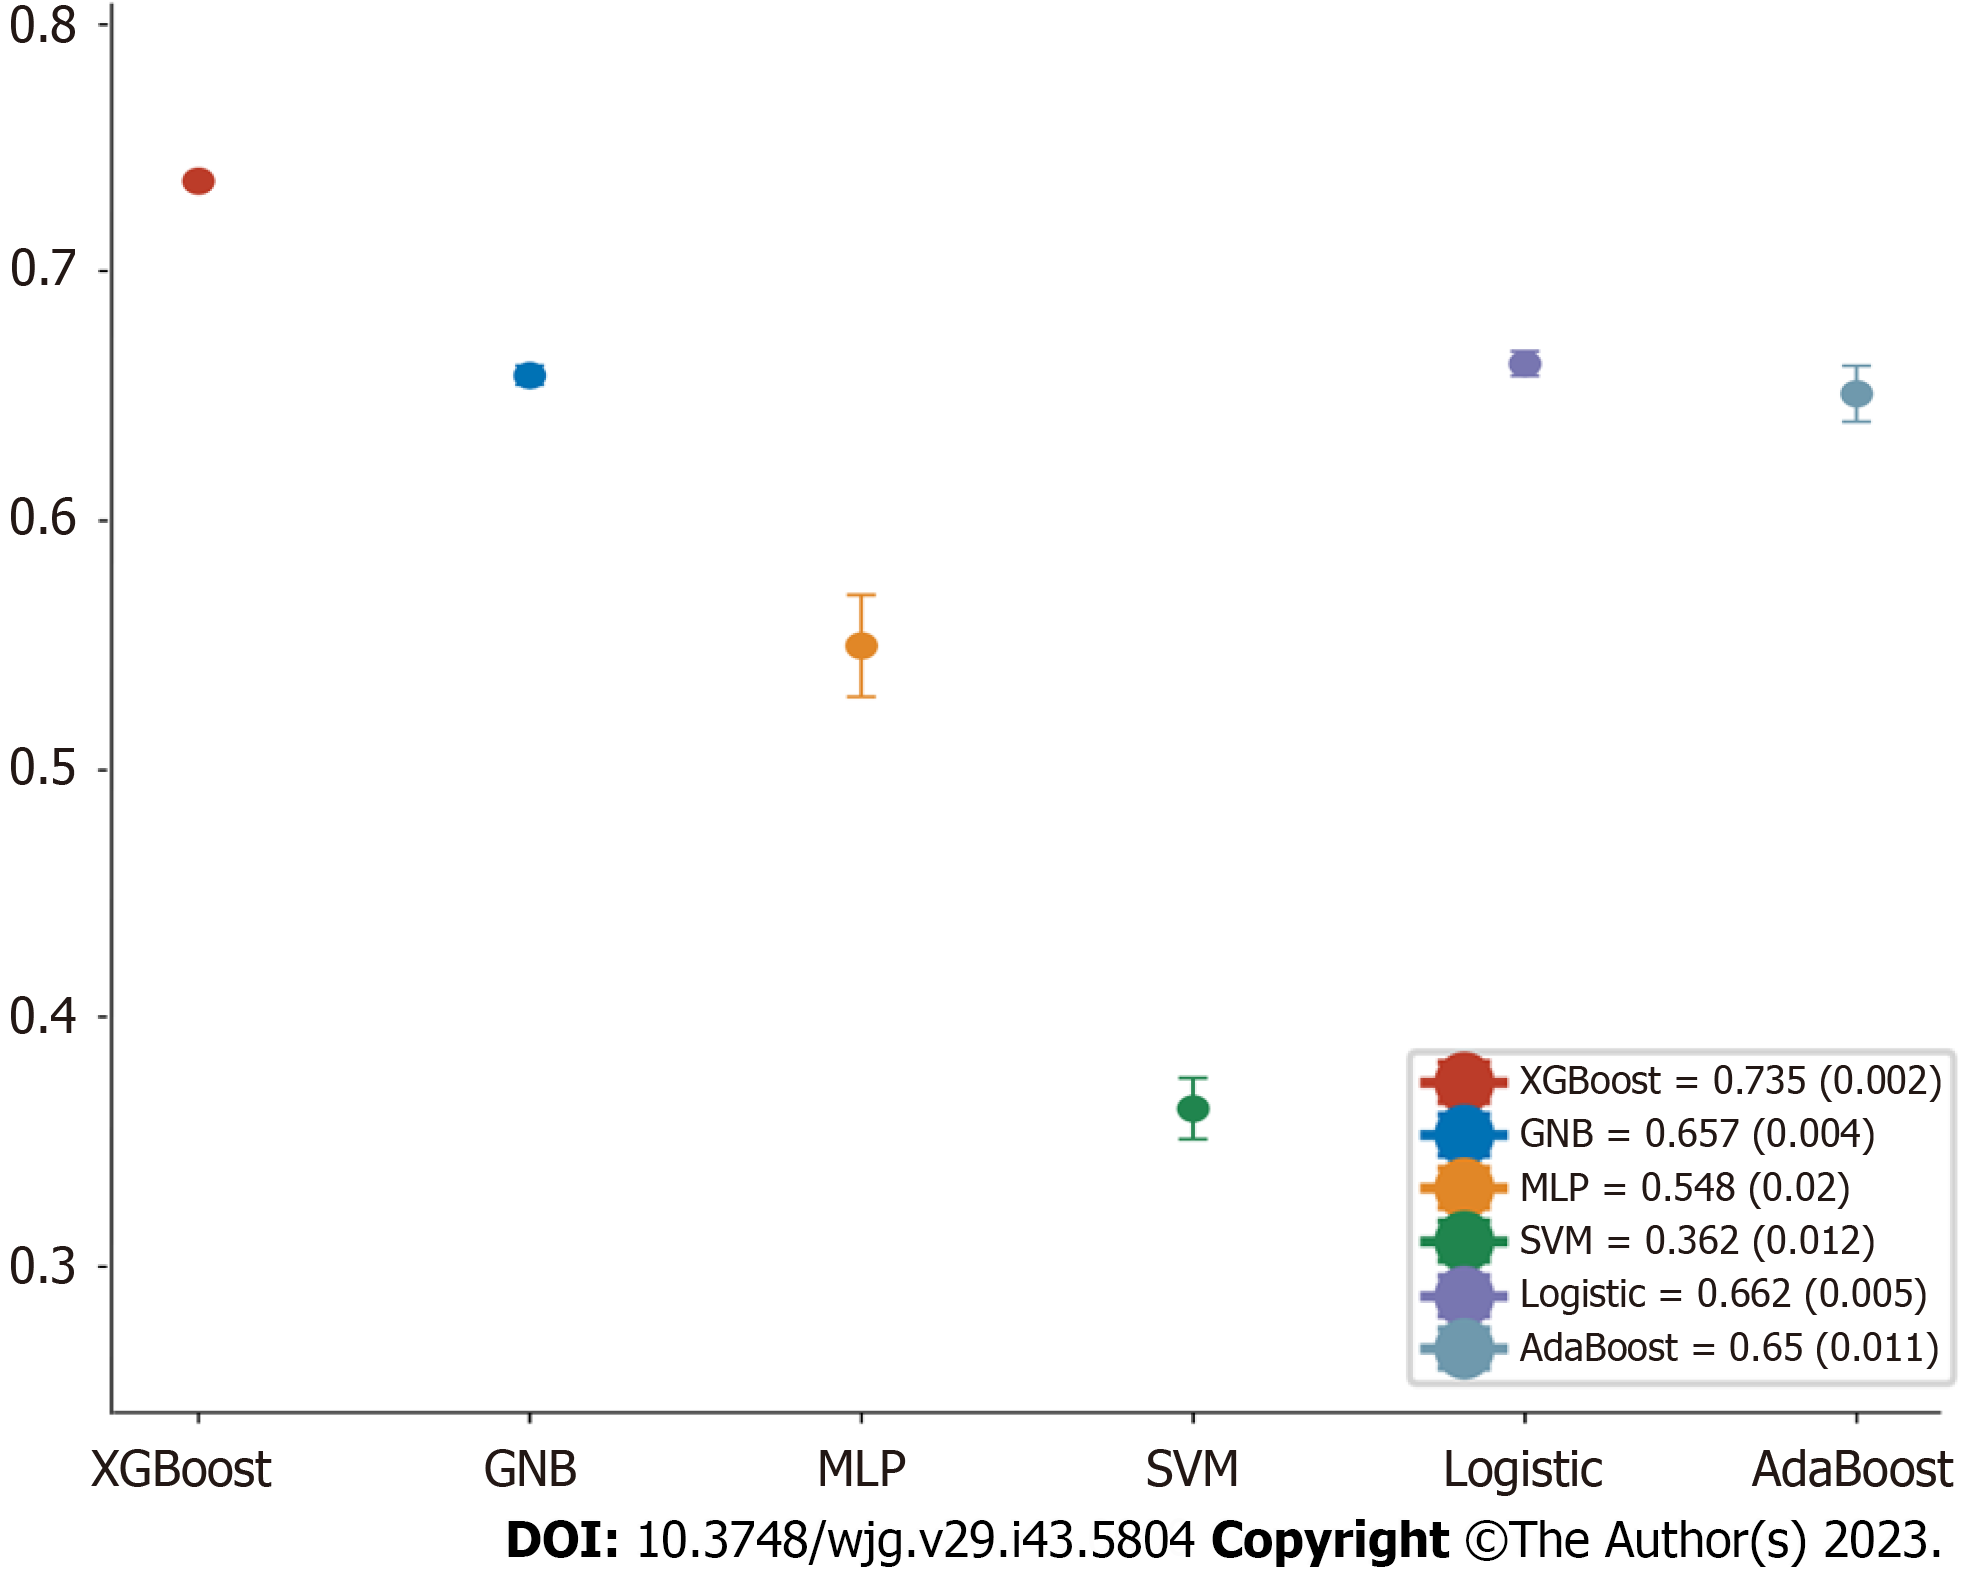
Figure 6 Forest plot of the area under the curve scores of the six models.
The XGBoost model achieved a smaller (better) SD compared with the other models. GNB: Complement NB; MLP: Multilayer perceptron; SVM: Support vector machine.
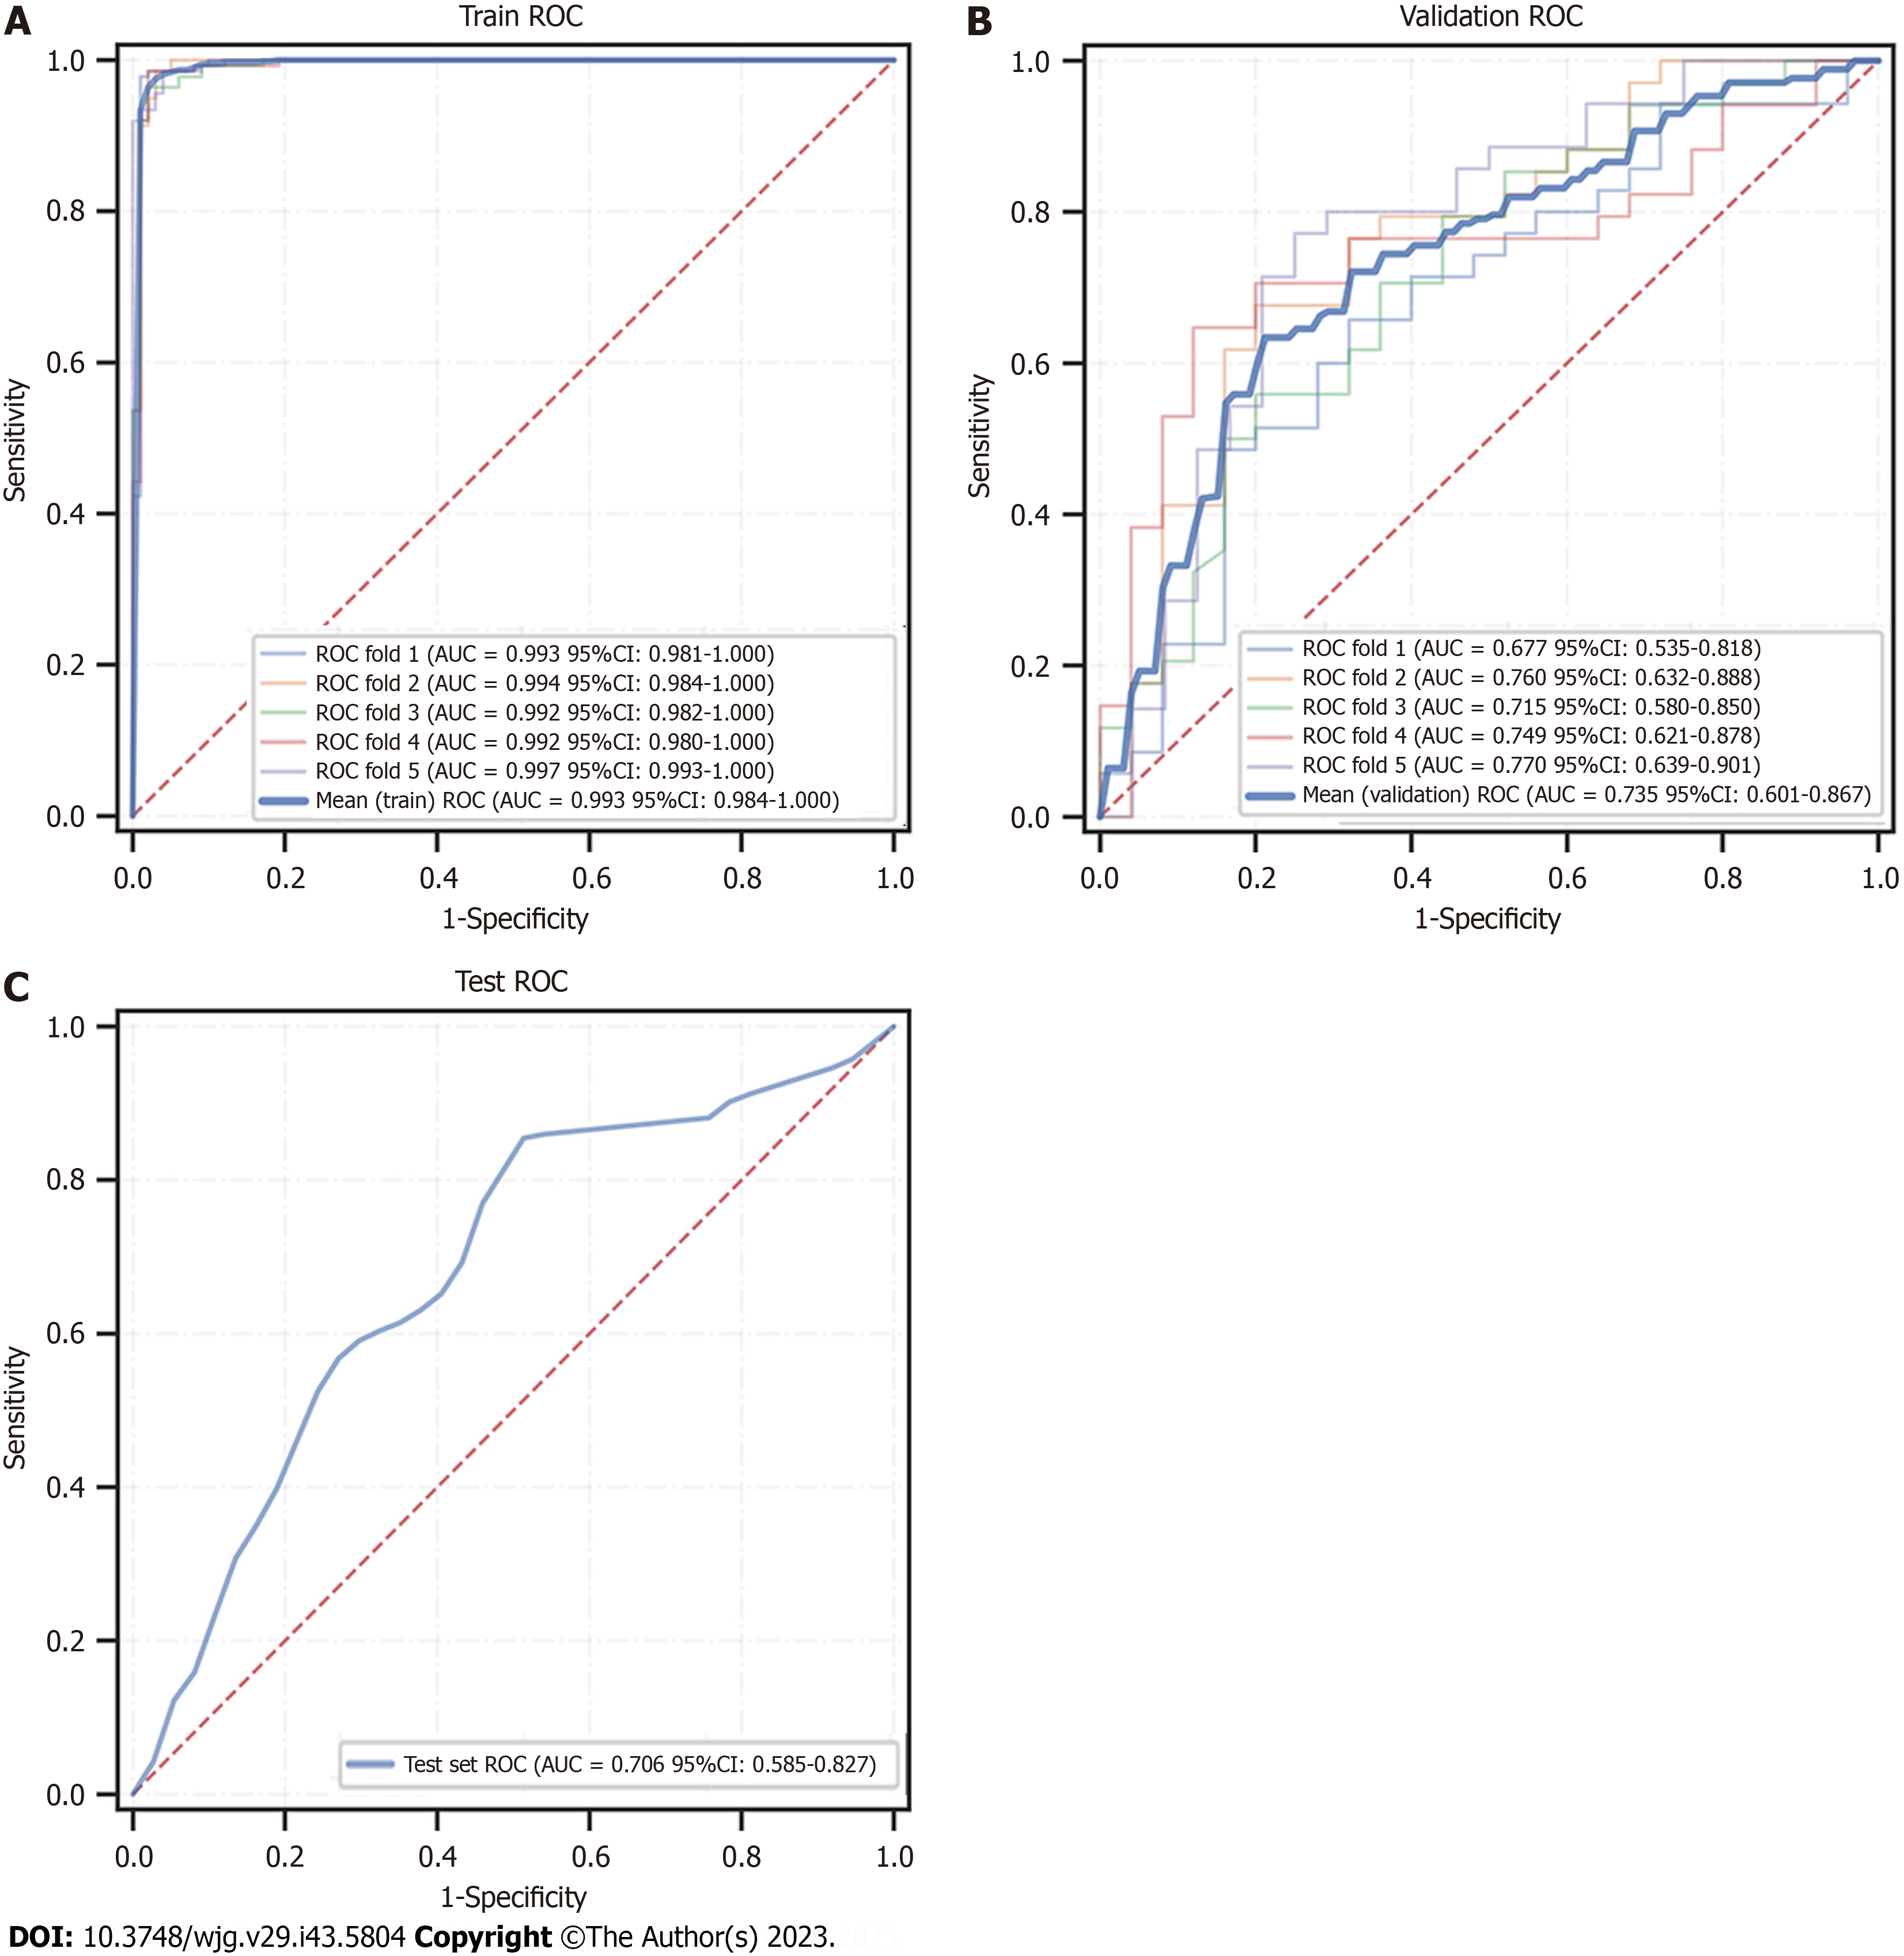
Figure 7 Receiver operating characteristic curves of the XGBoost model in training, validation, and test datasets.
ROC: Receiver operating characteristic; 95%CI: 95% confidence interval.
Figure 8 SHAP analysis of the XGBoost model.
A: Visual representation of each feature in the XGBoost model and the relationship between the importance of each feature. The color represents the value of the variable, with red representing the larger value and blue representing the smaller value. AFP: Alpha-fetoprotein; GLR: γ-glutamyl transferase to lymphocyte ratio.
- Citation: Zhang YB, Yang G, Bu Y, Lei P, Zhang W, Zhang DY. Development of a machine learning-based model for predicting risk of early postoperative recurrence of hepatocellular carcinoma. World J Gastroenterol 2023; 29(43): 5804-5817
- URL: https://www.wjgnet.com/1007-9327/full/v29/i43/5804.htm
- DOI: https://dx.doi.org/10.3748/wjg.v29.i43.5804


