Copyright
©The Author(s) 2023.
World J Gastroenterol. Jun 14, 2023; 29(22): 3561-3573
Published online Jun 14, 2023. doi: 10.3748/wjg.v29.i22.3561
Published online Jun 14, 2023. doi: 10.3748/wjg.v29.i22.3561
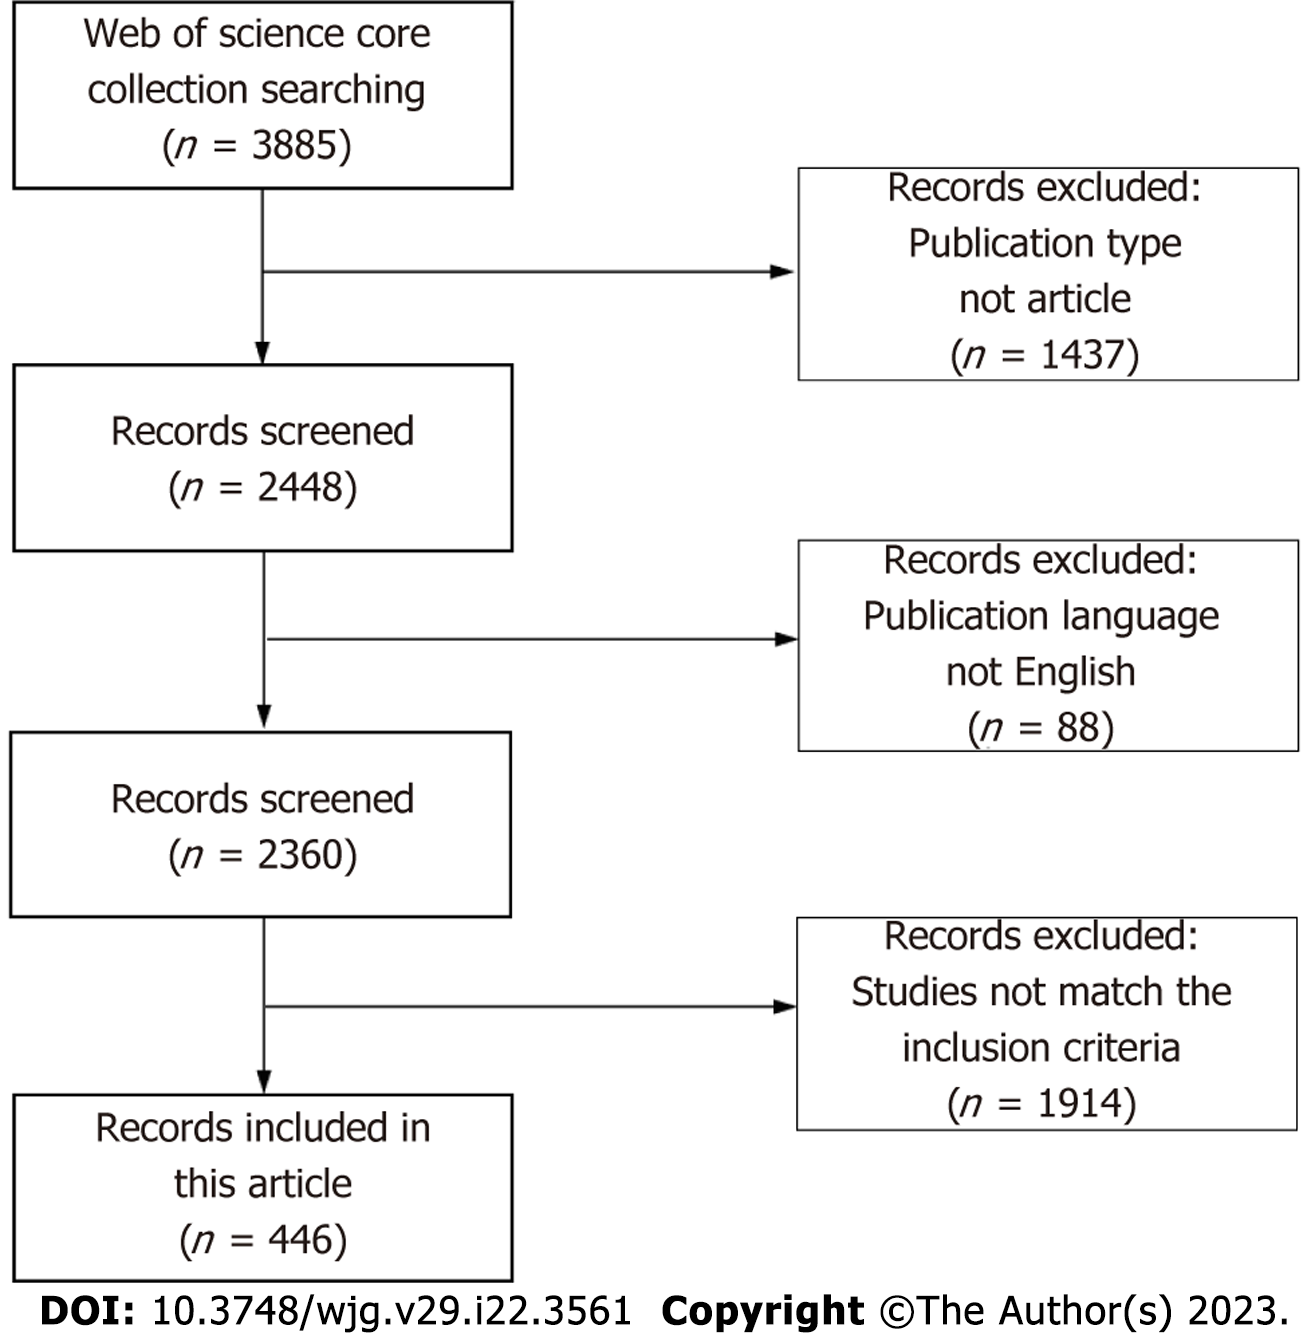
Figure 1 Flowchart of study enrollment.
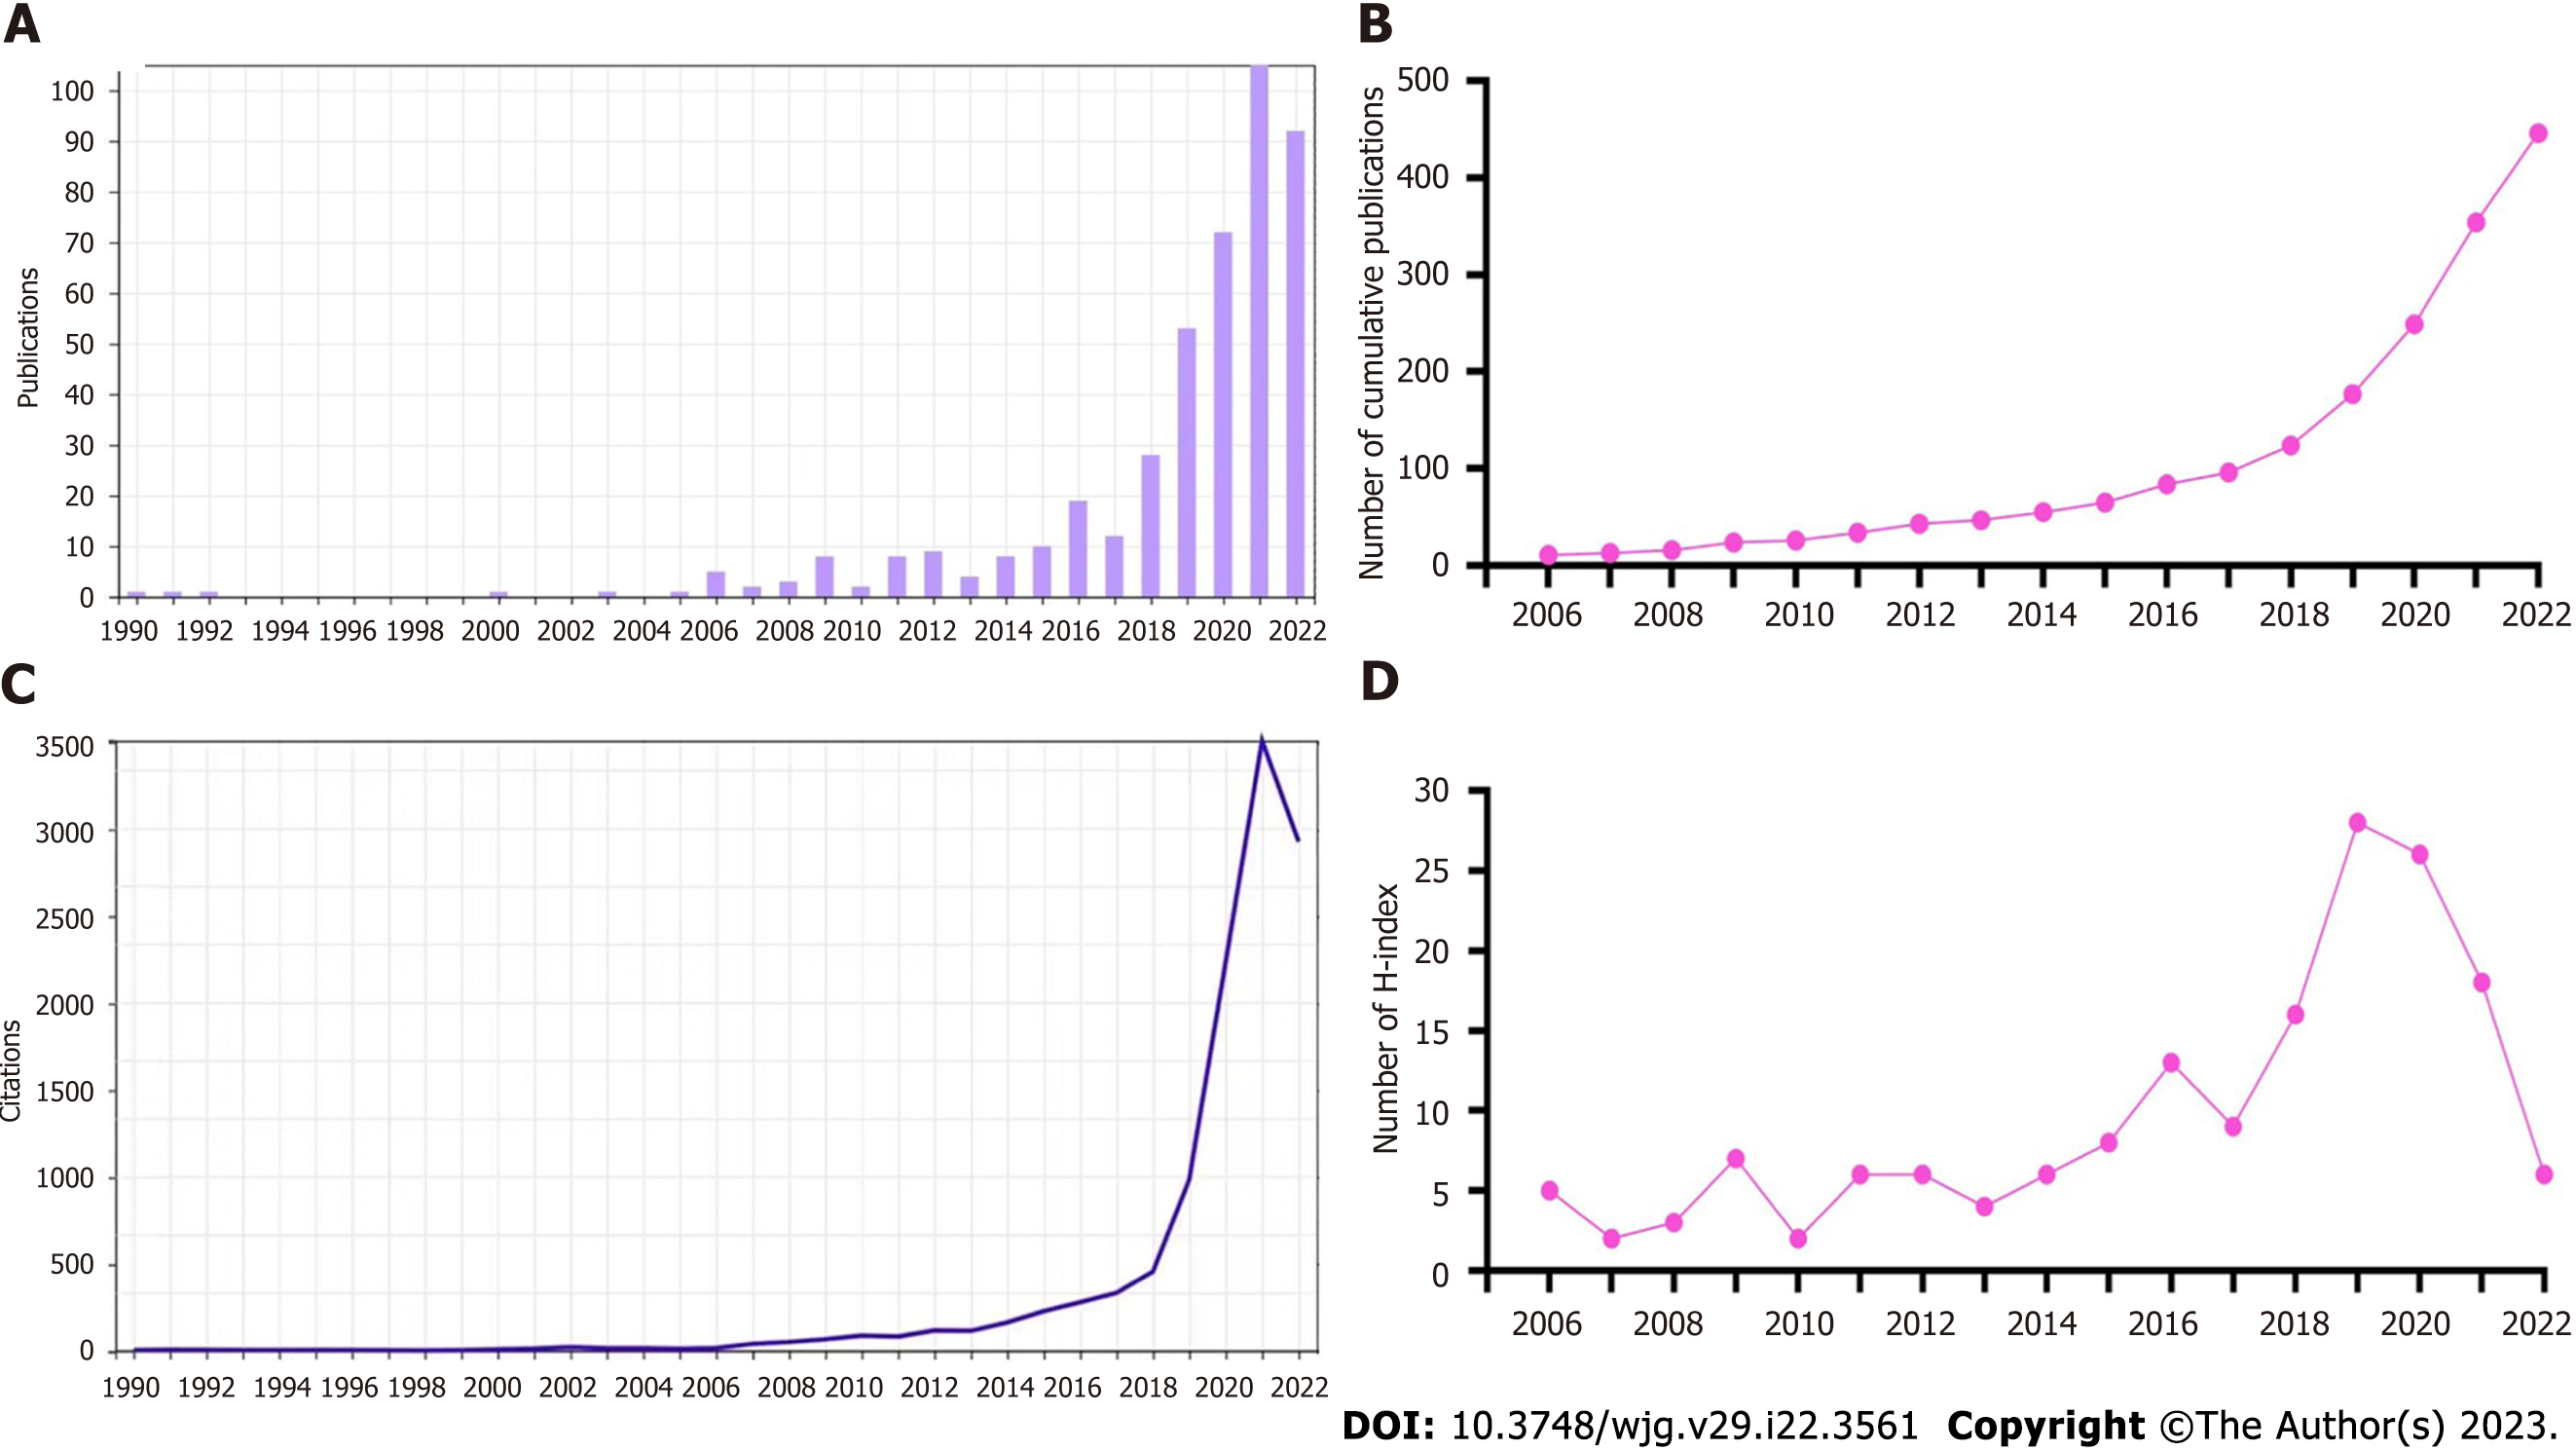
Figure 2 The annual number and H-index values.
A: Annual number of published articles; B: Number of annual cumulative articles; C: Global annual number of the publications; D: Annual H-index values of the publications.
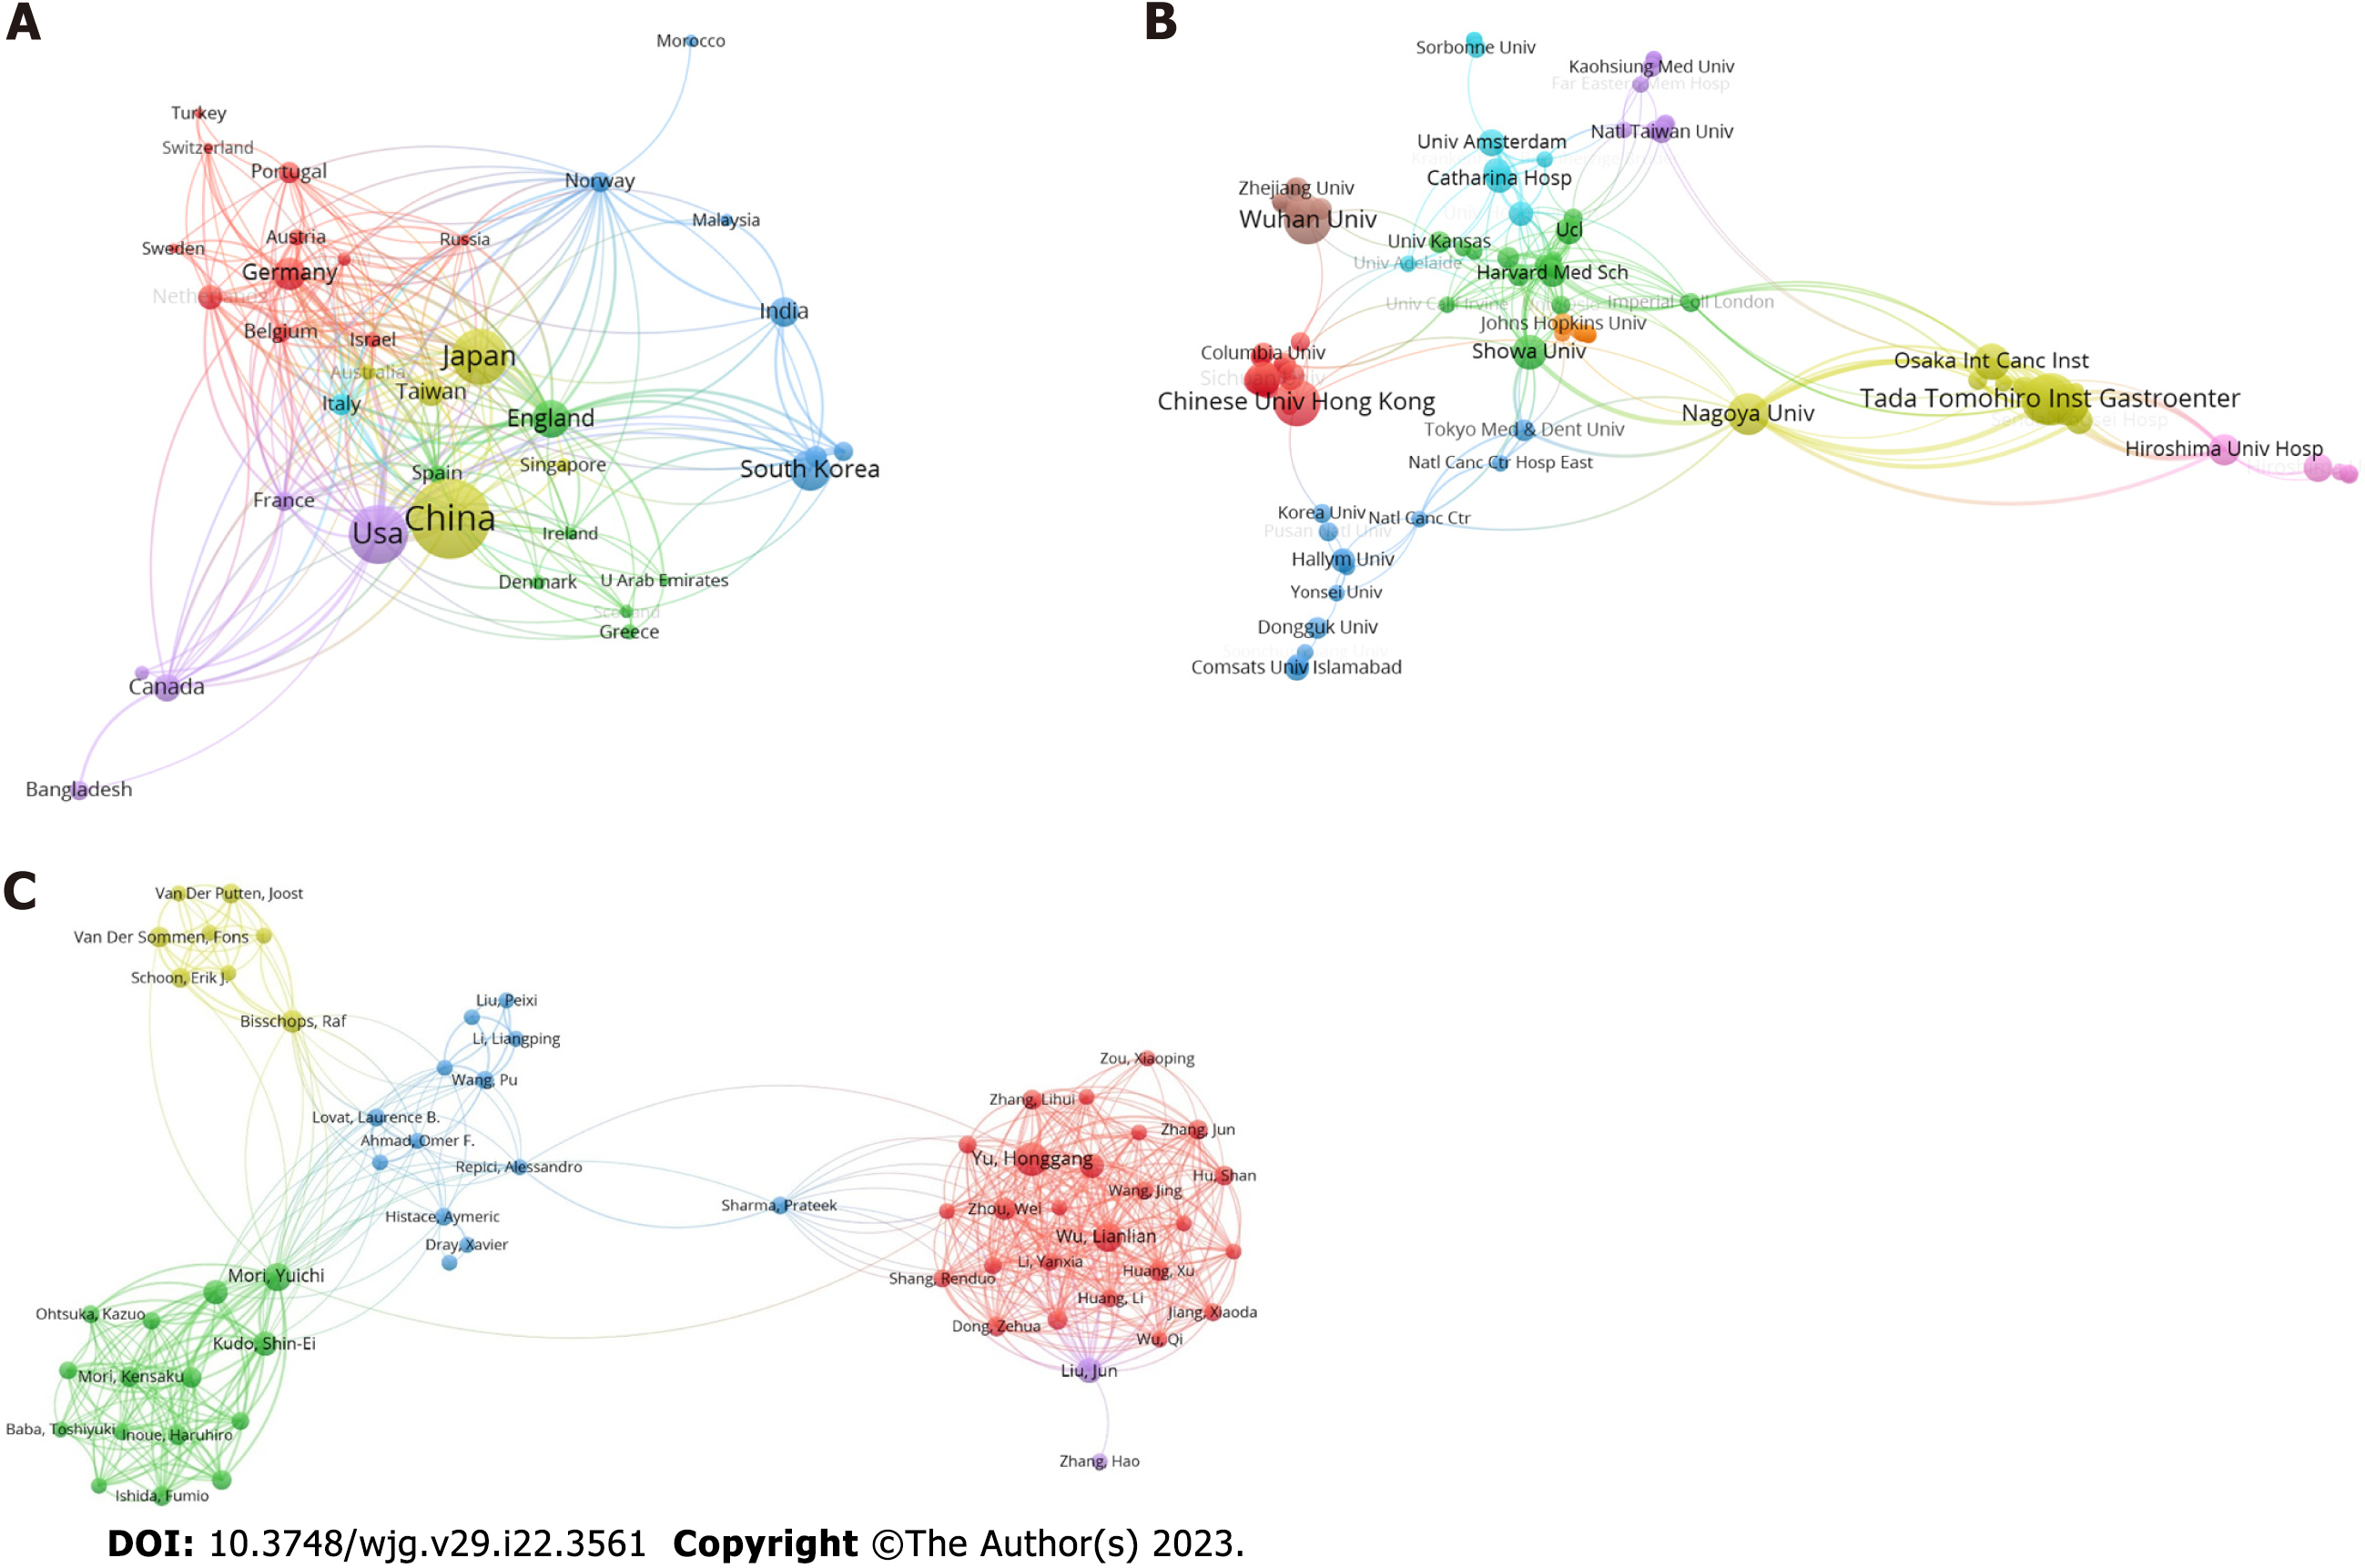
Figure 3 Cooperation network.
A-C: Cooperation network of countries (A), institutions (B), and authors (C) in the field of artificial intelligence and endoscopy from 1990-2022.
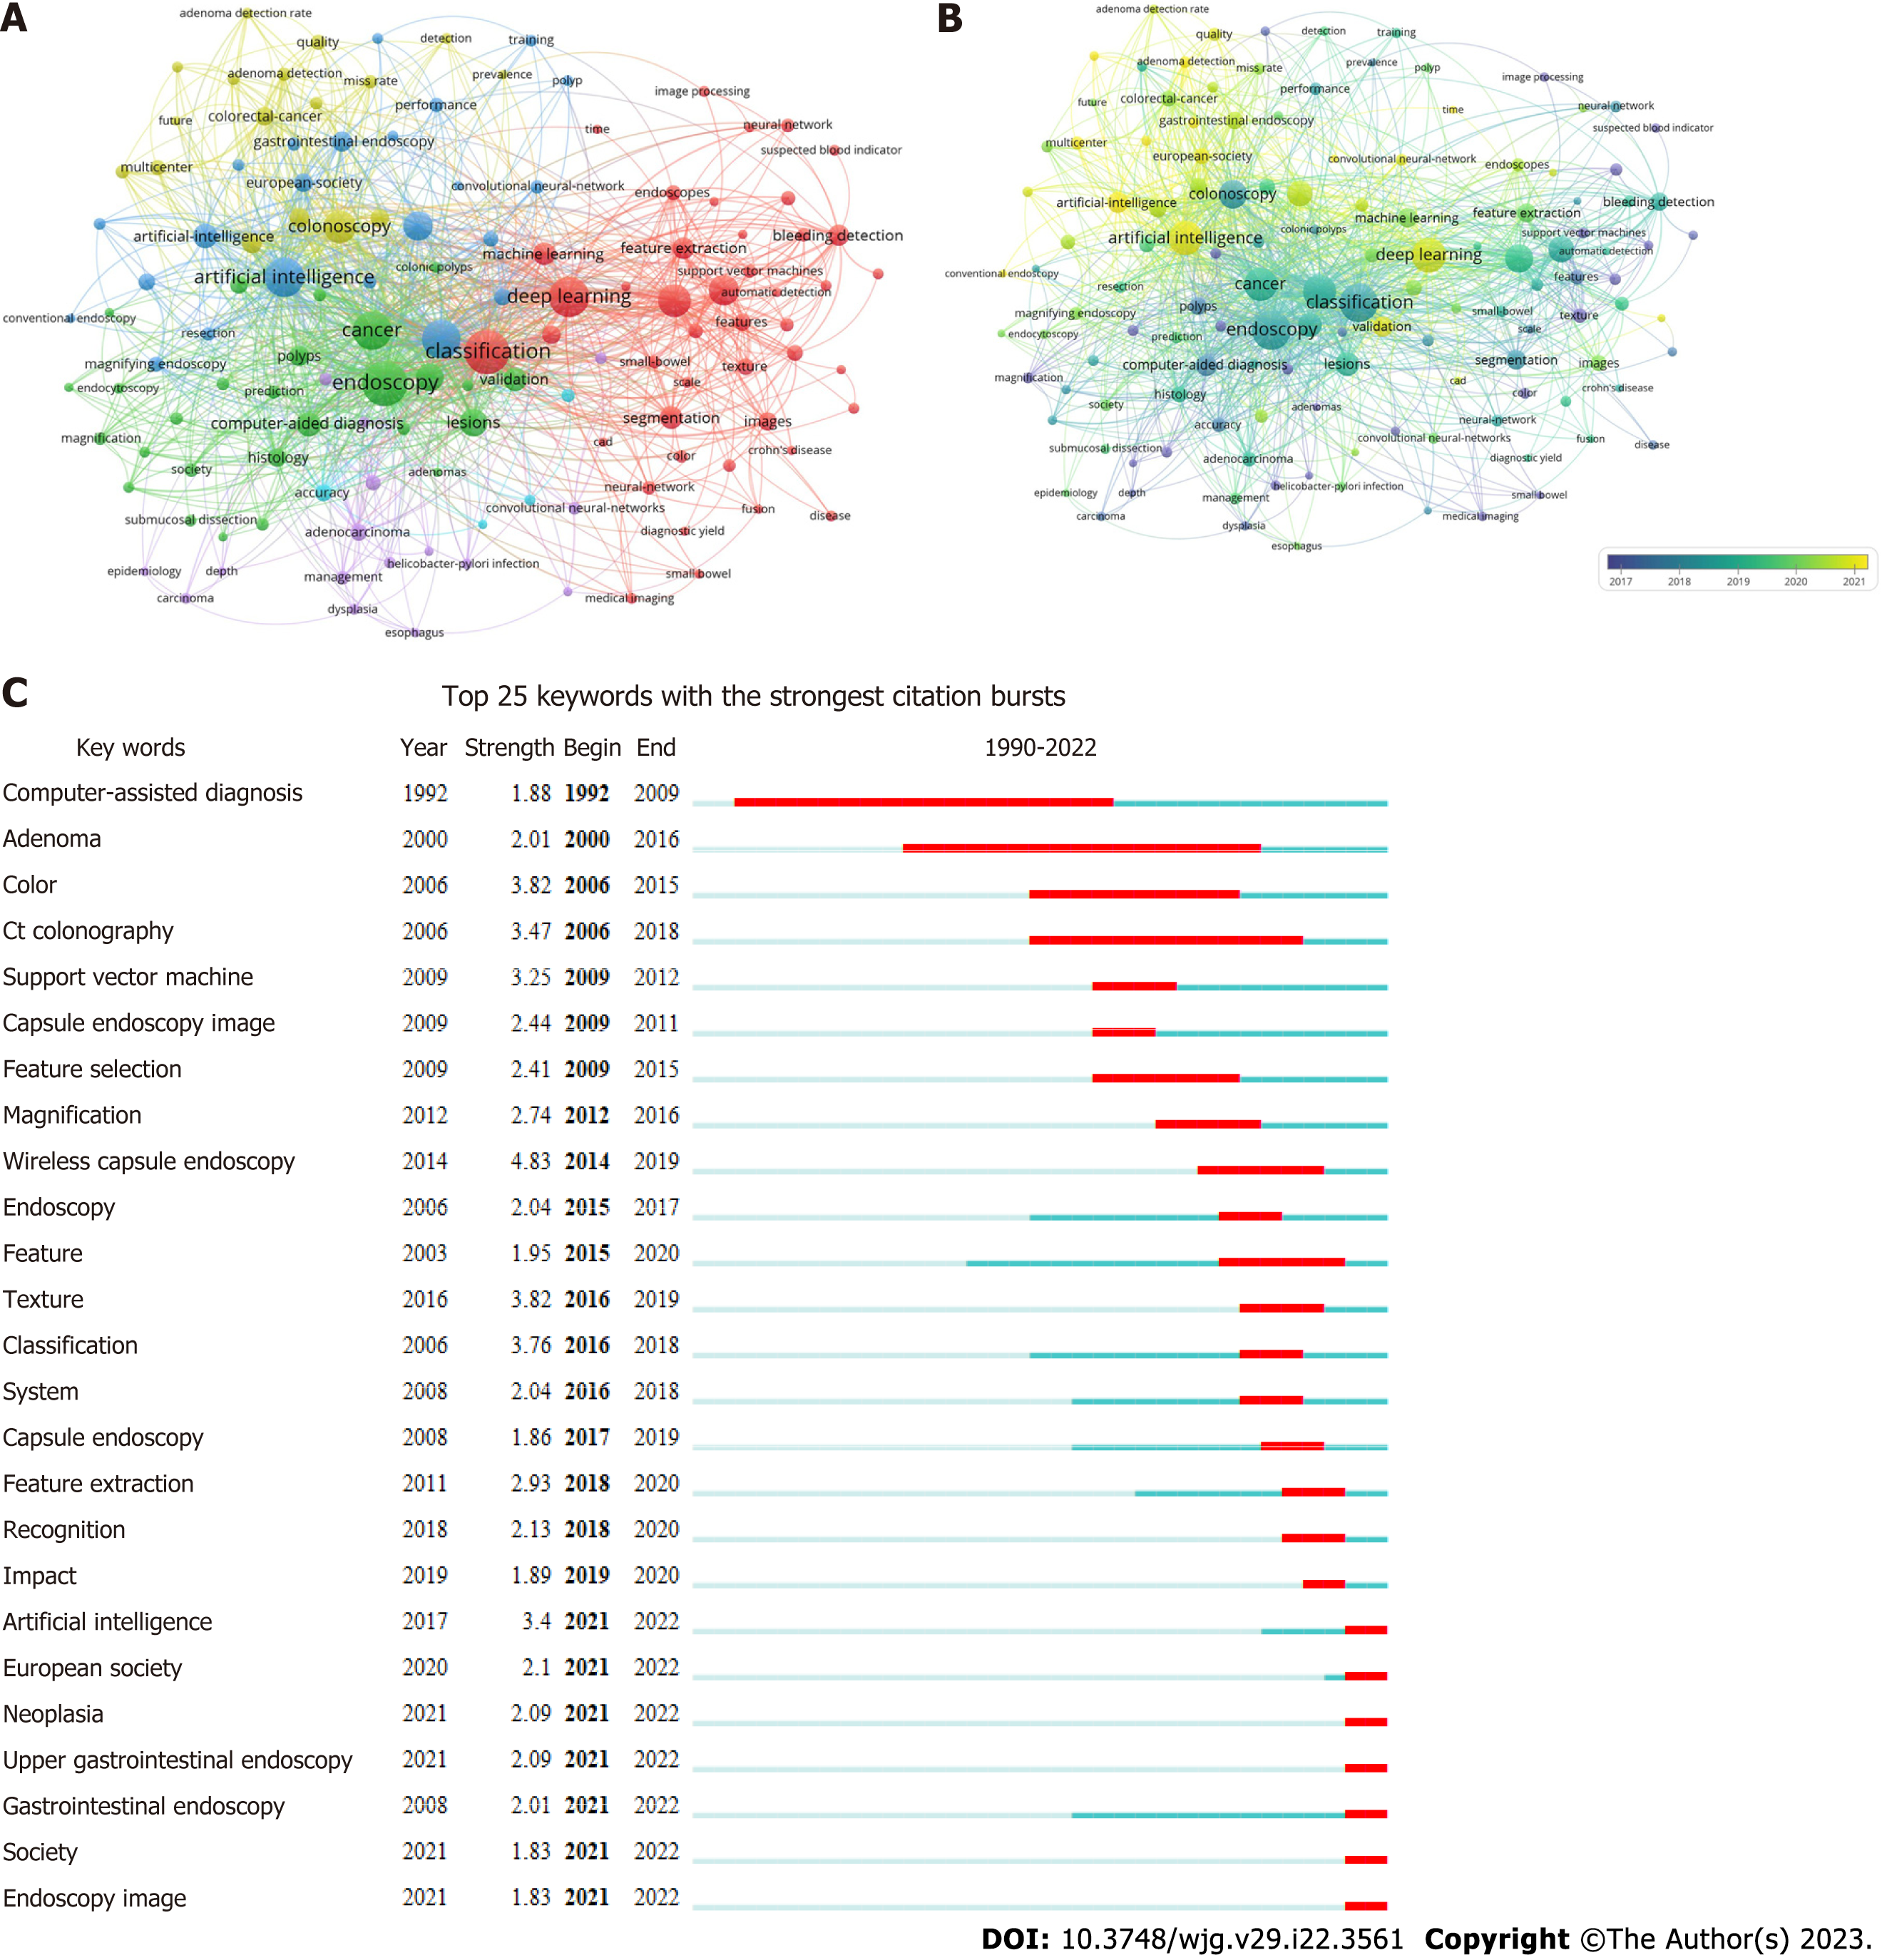
Figure 4 Co-occurrence map.
A and B: Co-occurrence map based on keywords; C: Top 25 keywords with the strongest citation bursts.
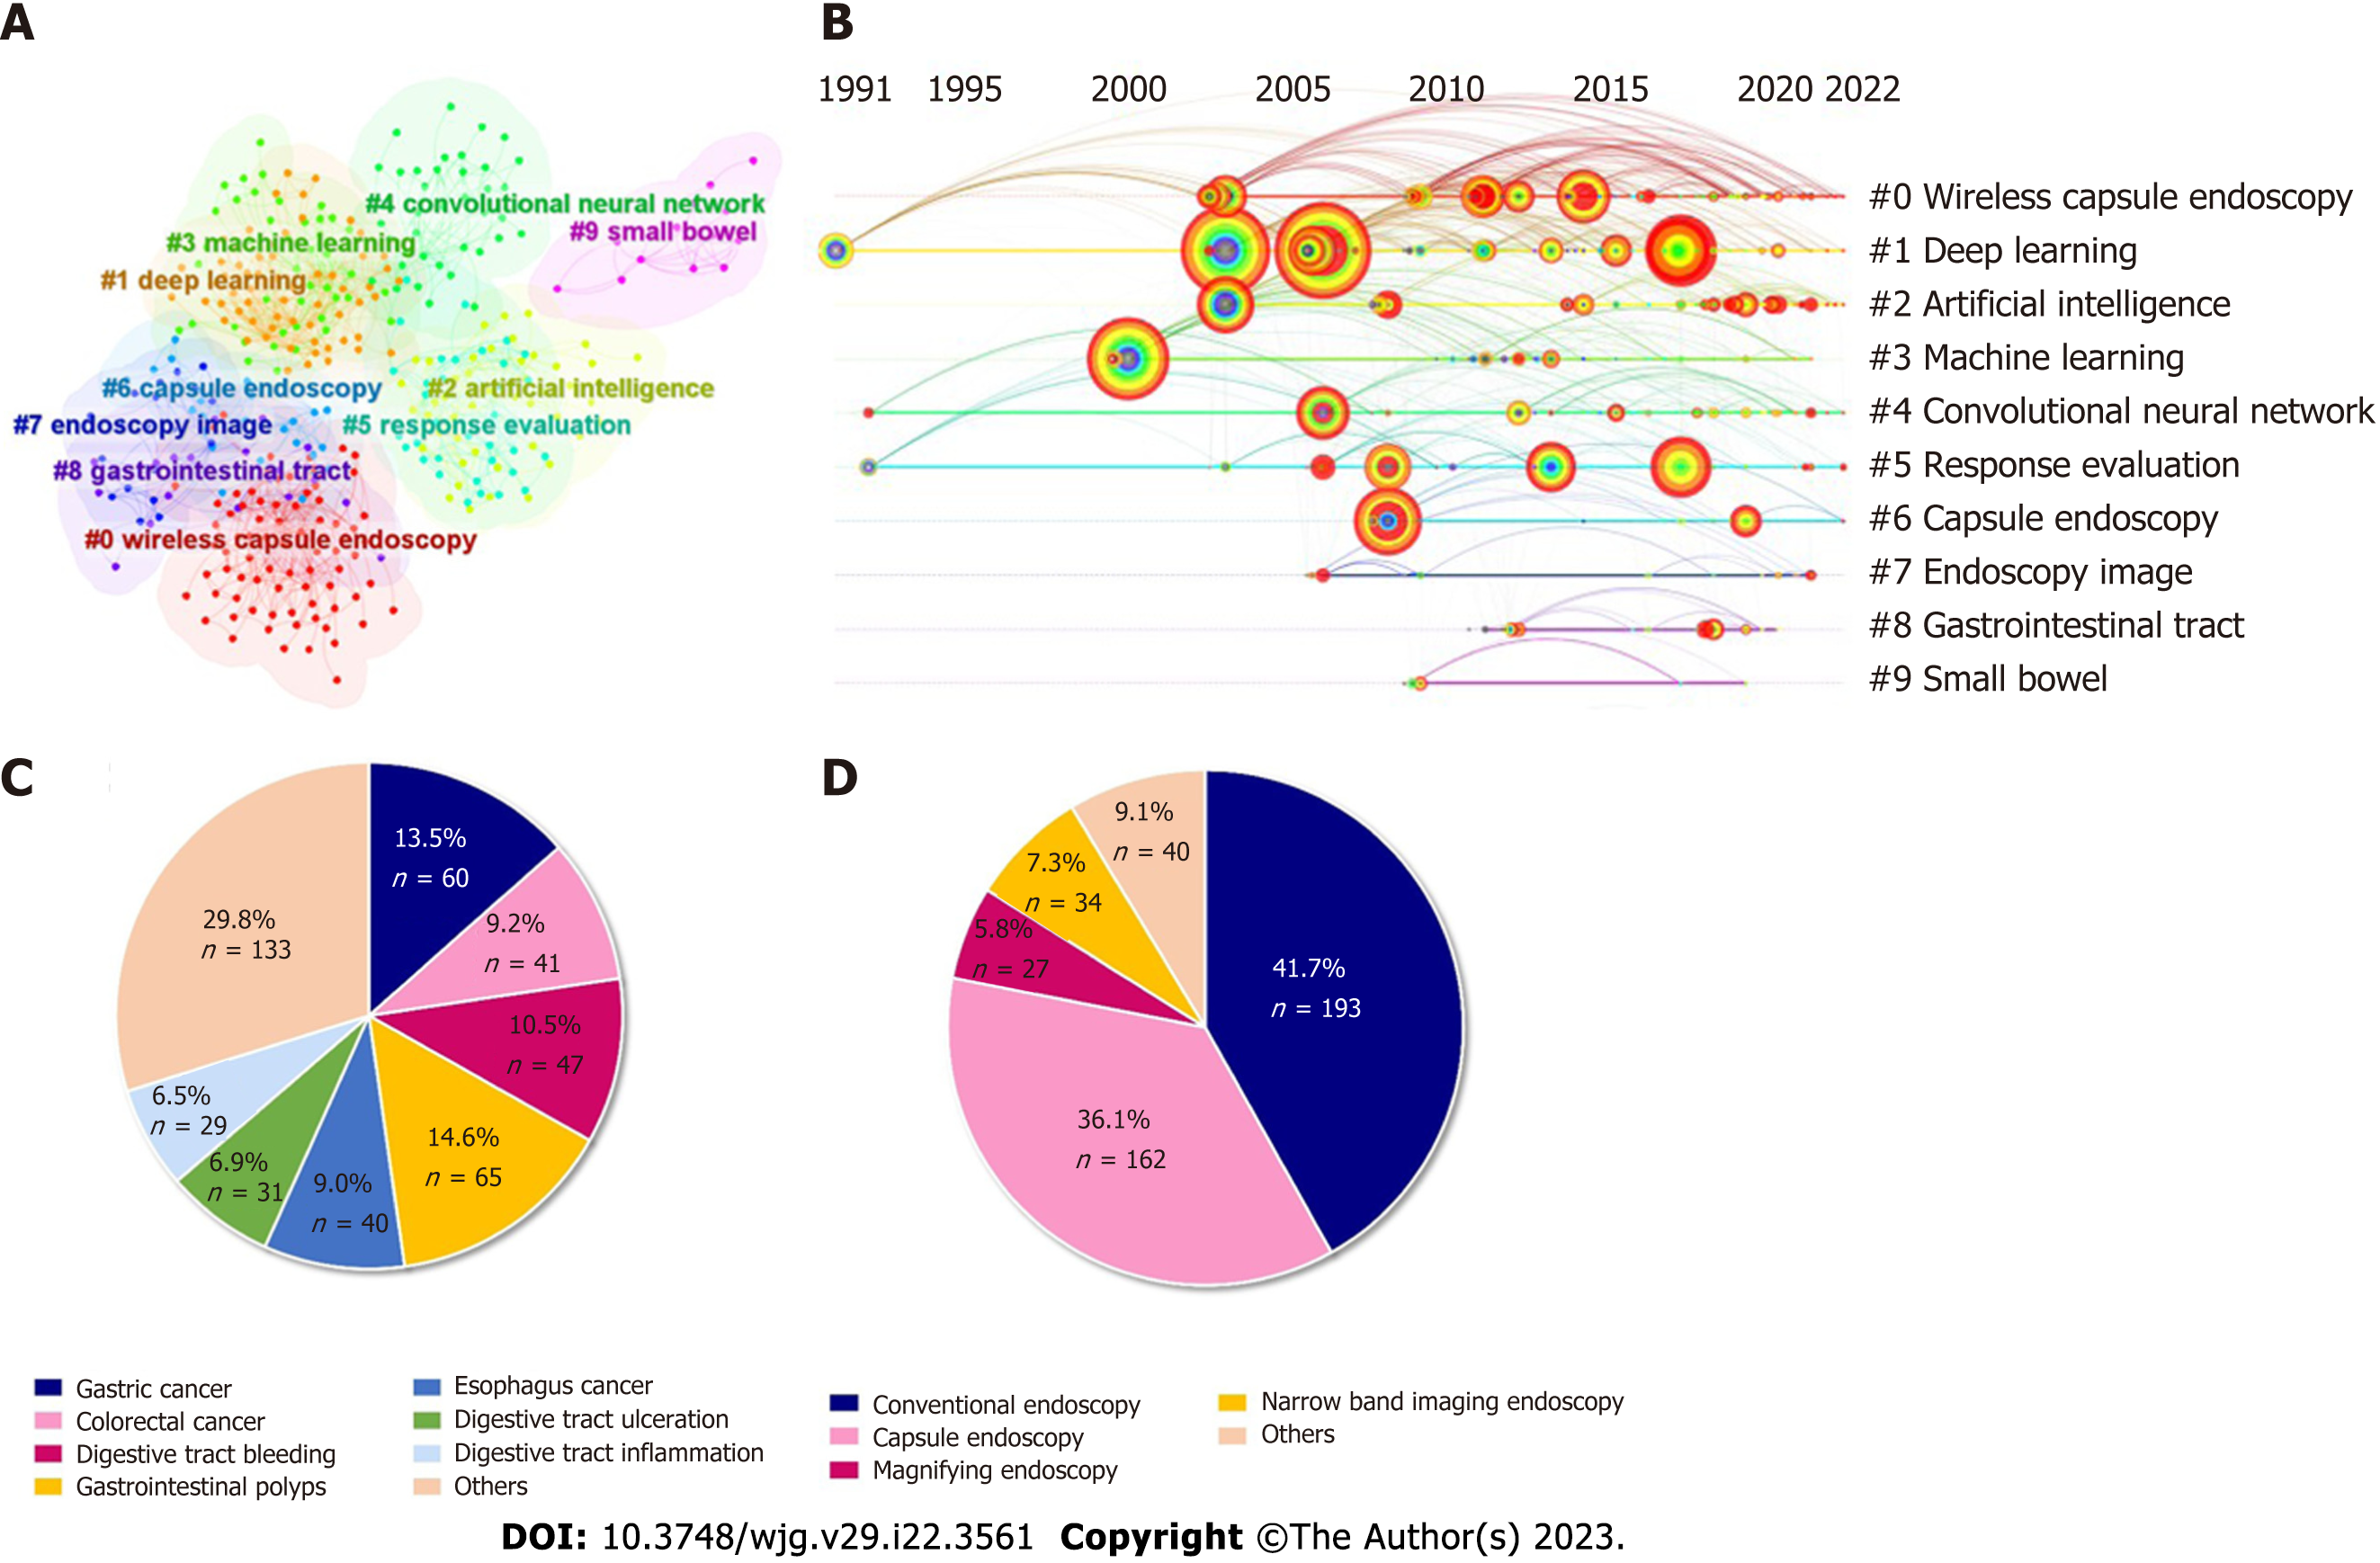
Figure 5 Diagrams.
A: Cluster network diagrams; B: Literature cocitation diagrams; C and D: Proportion of the number of diseases (C) and endoscopy type (D) in the field of AI and endoscopy.
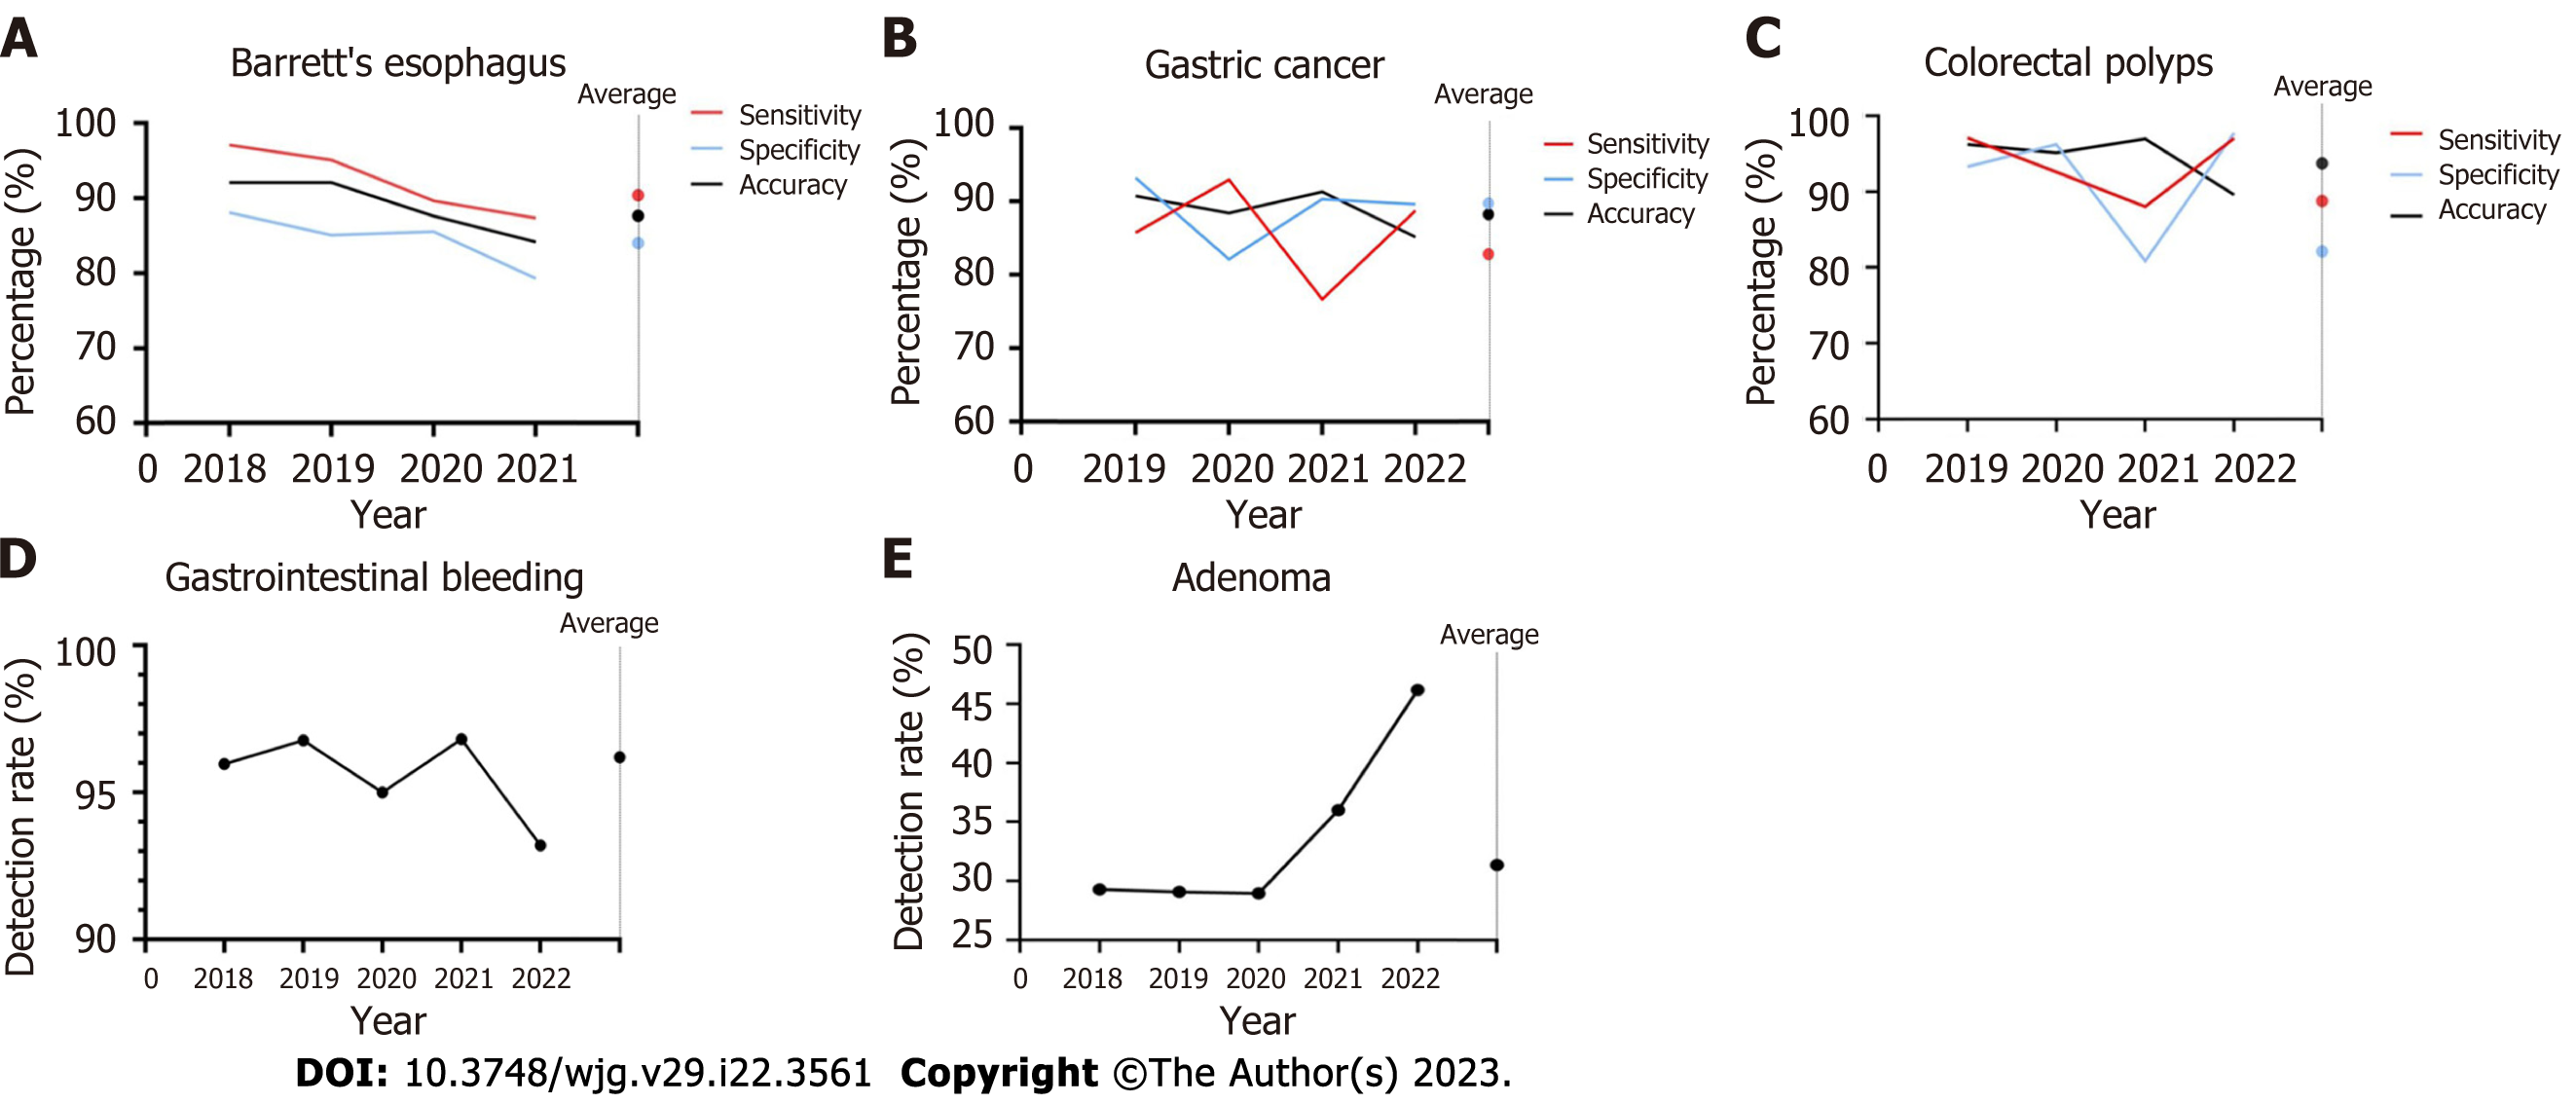
Figure 6 Temporal variation in the diagnostic performance of artificial intelligence-assisted endoscopy for digestive diseases.
A-C: Temporal variation in the sensitivity, specificity and accuracy of artificial intelligence (AI)-assisted endoscopy in Barrett’s esophagus (A), gastric cancer (B), and polyps (C); D and E: Temporal variation in the detection rate of AI-assisted endoscopy in bleeding (D) and adenoma (E).
- Citation: Du RC, Ouyang YB, Hu Y. Research trends on artificial intelligence and endoscopy in digestive diseases: A bibliometric analysis from 1990 to 2022. World J Gastroenterol 2023; 29(22): 3561-3573
- URL: https://www.wjgnet.com/1007-9327/full/v29/i22/3561.htm
- DOI: https://dx.doi.org/10.3748/wjg.v29.i22.3561


