Copyright
©The Author(s) 2023.
World J Gastroenterol. Jun 14, 2023; 29(22): 3534-3547
Published online Jun 14, 2023. doi: 10.3748/wjg.v29.i22.3534
Published online Jun 14, 2023. doi: 10.3748/wjg.v29.i22.3534
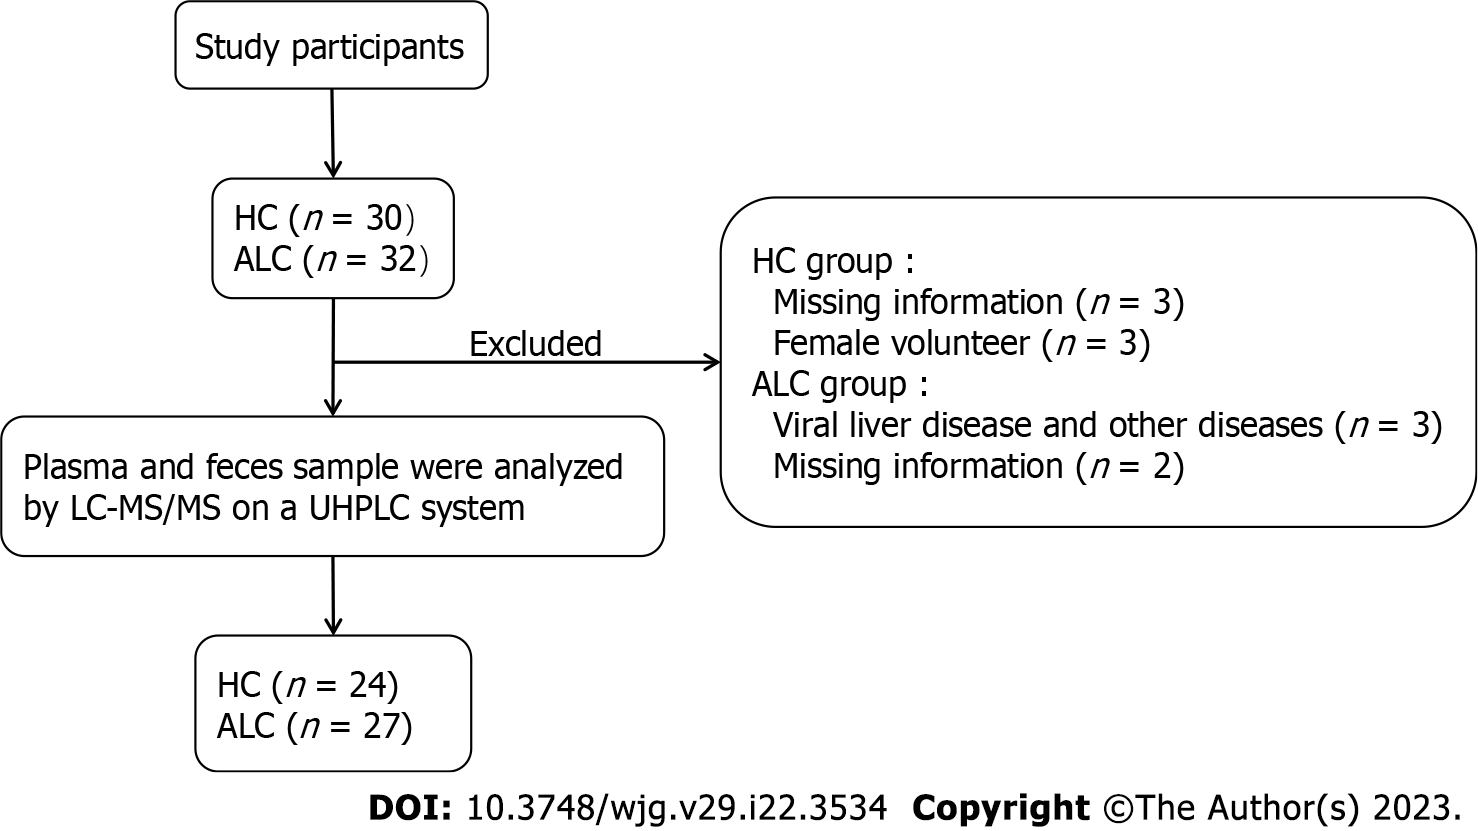
Figure 1 Flow chart demonstrating the selection of study participants.
HC: Healthy control group; ALC: Alcohol-related liver cirrhosis group; LC-MS/MS: Liquid chromatography-mass spectrometry.
Figure 2 Subclass and distribution of common metabolites in the plasma and feces of patients with alcohol-related liver cirrhosis.
A: Subclass of common metabolites in plasma and feces of patients with alcohol-related liver cirrhosis (ALC); B: Principal component analysis (PCA) of plasma metabolites in two groups; C: PCA of fecal metabolites in two groups. Green dots represent healthy control group, and red dots represented patients with ALC group. Abscissa PC 1 and ordinate PC 2 represent the scores of the first and second principal components respectively, each scatter point represented a sample, the closer the distribution of sample points, it indicates that the types and contents of metabolites in the samples are more similar. On the contrary, the farther the sample is, the greater the difference in its overall metabolic level. The sample is basically within the 95% confidence interval (Hotelling's T-squared ellipse). HC: Healthy control group; ALC: Alcohol-related liver cirrhosis group.
Figure 3 Enrichment metabolic pathway and volcano map of metabolites.
A: Enrichment metabolic pathway in plasma; B: Enrichment metabolic pathway in feces. Enrichment Ratio was computed by Hits/Expected, where hits = observed hits; expected = expected hits (details in Supplementary Tables 3 and 4); C: Volcano map of metabolites in plasma; D: Volcano map of metabolites in feces. All metabolites were screened by fold change (FC) > 2, P < 0.05 or FC < 0.5, P < 0.05. FC: The quantitative ratio of alcohol-related liver cirrhosis to healthy control group. HC: Healthy control group; ALC: Alcohol-related liver cirrhosis group.
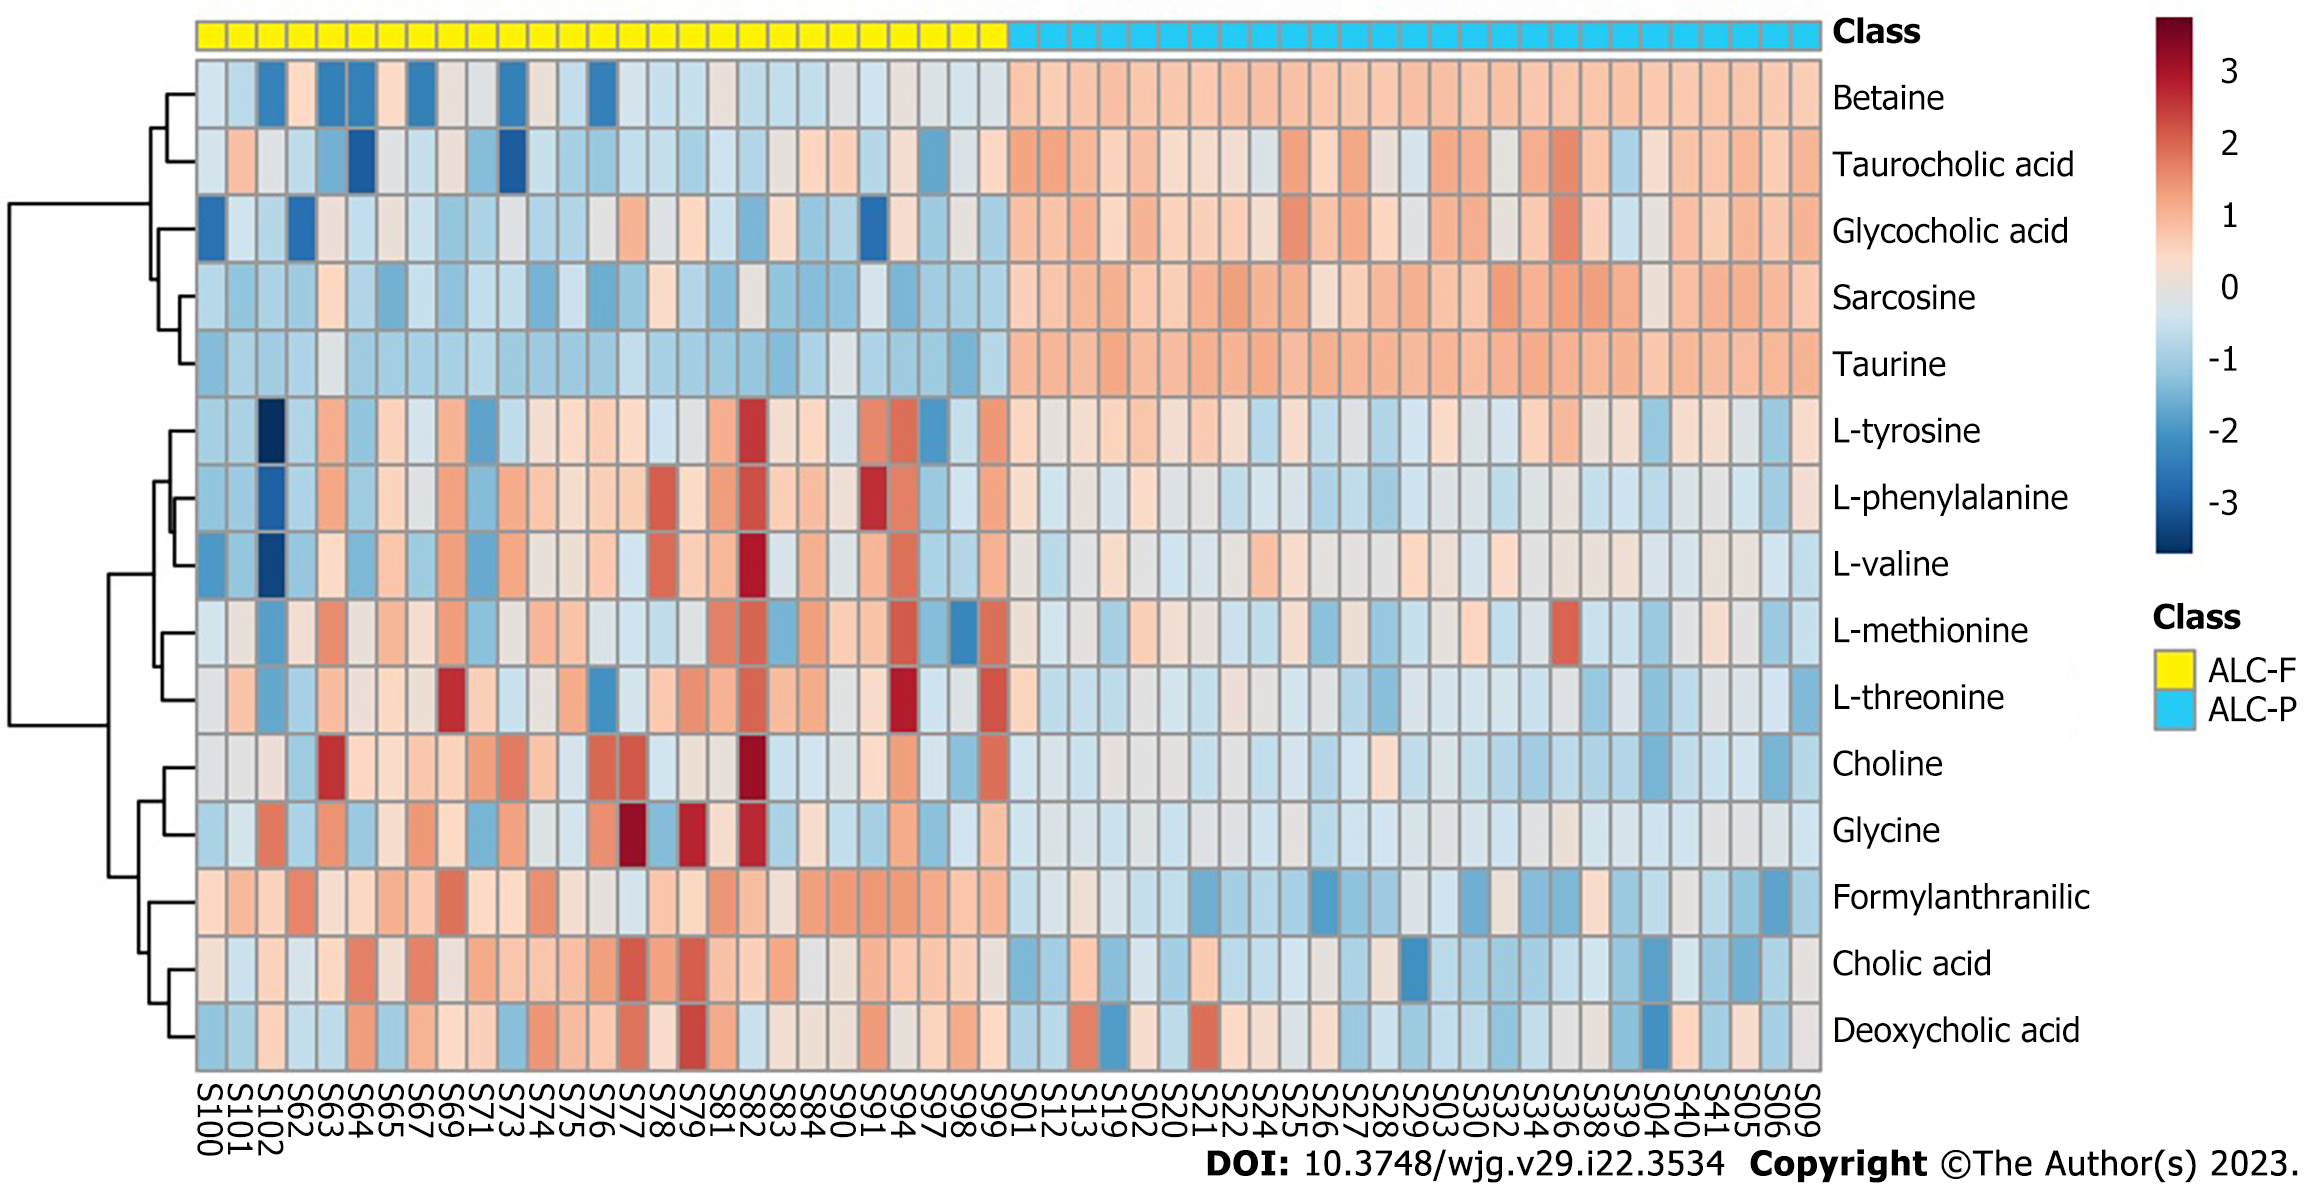
Figure 4 Distribution of bile acids and amino acid and related metabolites in plasma and feces of patients with alcohol-related liver cirrhosis.
Numerous data basically conformed to the normal distribution after normalizing and scaling. The darker the color, the higher the relative content. ALC-P: Mean metabolites in the plasma of patients with alcohol-related liver cirrhosis; ALC-F: Mean metabolites in the feces of patients with alcohol-related liver cirrhosis.
Figure 5 Correlation heatmap of amino acid or bile acid with clinical index.
A: Correlation of amino acid with clinical index; B: Correlation of bile acid with clinical index. Relative coefficient in circle were calculated by spearman correlation analysis (P < 0.05). “×” in the circle mean no statistical difference (P > 0.05). TCA(P)+GCA(P)/DCA(F) also marked as P/S BA ratio represented sum of glycocholic acid and taurocholic acid in plasma divided by deoxycholic acid in feces. MDF: Maddrey discriminant function score; TB: Total bilirubin; CHF: Cholinesterase; TBA: Total bile acid; PT: Prothrombin time; ALB: Albumin.
- Citation: Xu YF, Hao YX, Ma L, Zhang MH, Niu XX, Li Y, Zhang YY, Liu TT, Han M, Yuan XX, Wan G, Xing HC. Difference and clinical value of metabolites in plasma and feces of patients with alcohol-related liver cirrhosis. World J Gastroenterol 2023; 29(22): 3534-3547
- URL: https://www.wjgnet.com/1007-9327/full/v29/i22/3534.htm
- DOI: https://dx.doi.org/10.3748/wjg.v29.i22.3534


