Copyright
©The Author(s) 2022.
World J Gastroenterol. Oct 28, 2022; 28(40): 5865-5880
Published online Oct 28, 2022. doi: 10.3748/wjg.v28.i40.5865
Published online Oct 28, 2022. doi: 10.3748/wjg.v28.i40.5865
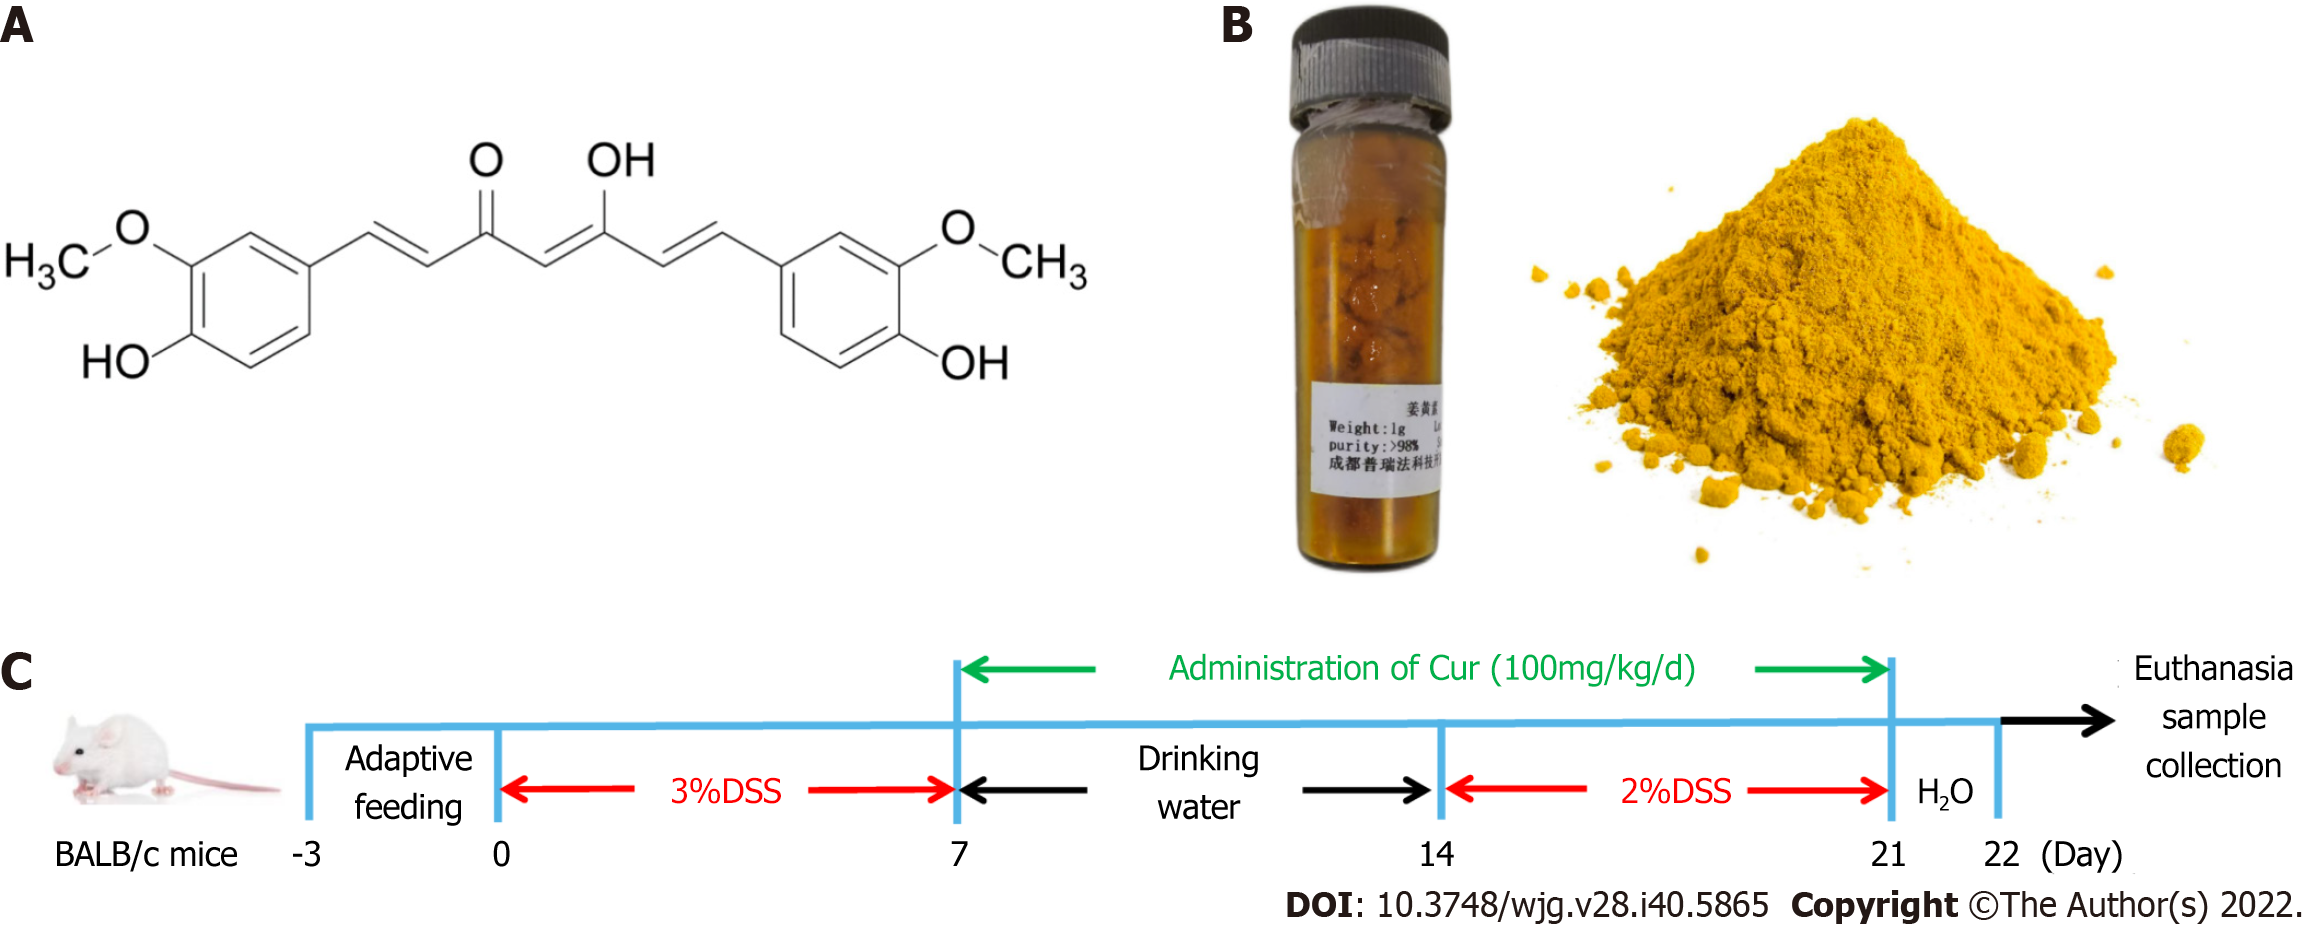
Figure 1 Drugs and protocols used in the study.
A: Molecular structural formula of curcumin (Cur); B: Cur used in the experiment; C: Colitis induction and Cur administration. The experiment lasted for 22 d, including 3 d of adaptive feeding, 0-7 d of treatment with 3% DSS treatment with drinking water, and 7 d of free drinking water. Animals were divided into four groups: Control (n = 10), DSS (n = 10), DSS + Cur (100 mg/kg/d, n = 10), and Ctrl + Cur (100 mg/kg/d, n = 10) groups.
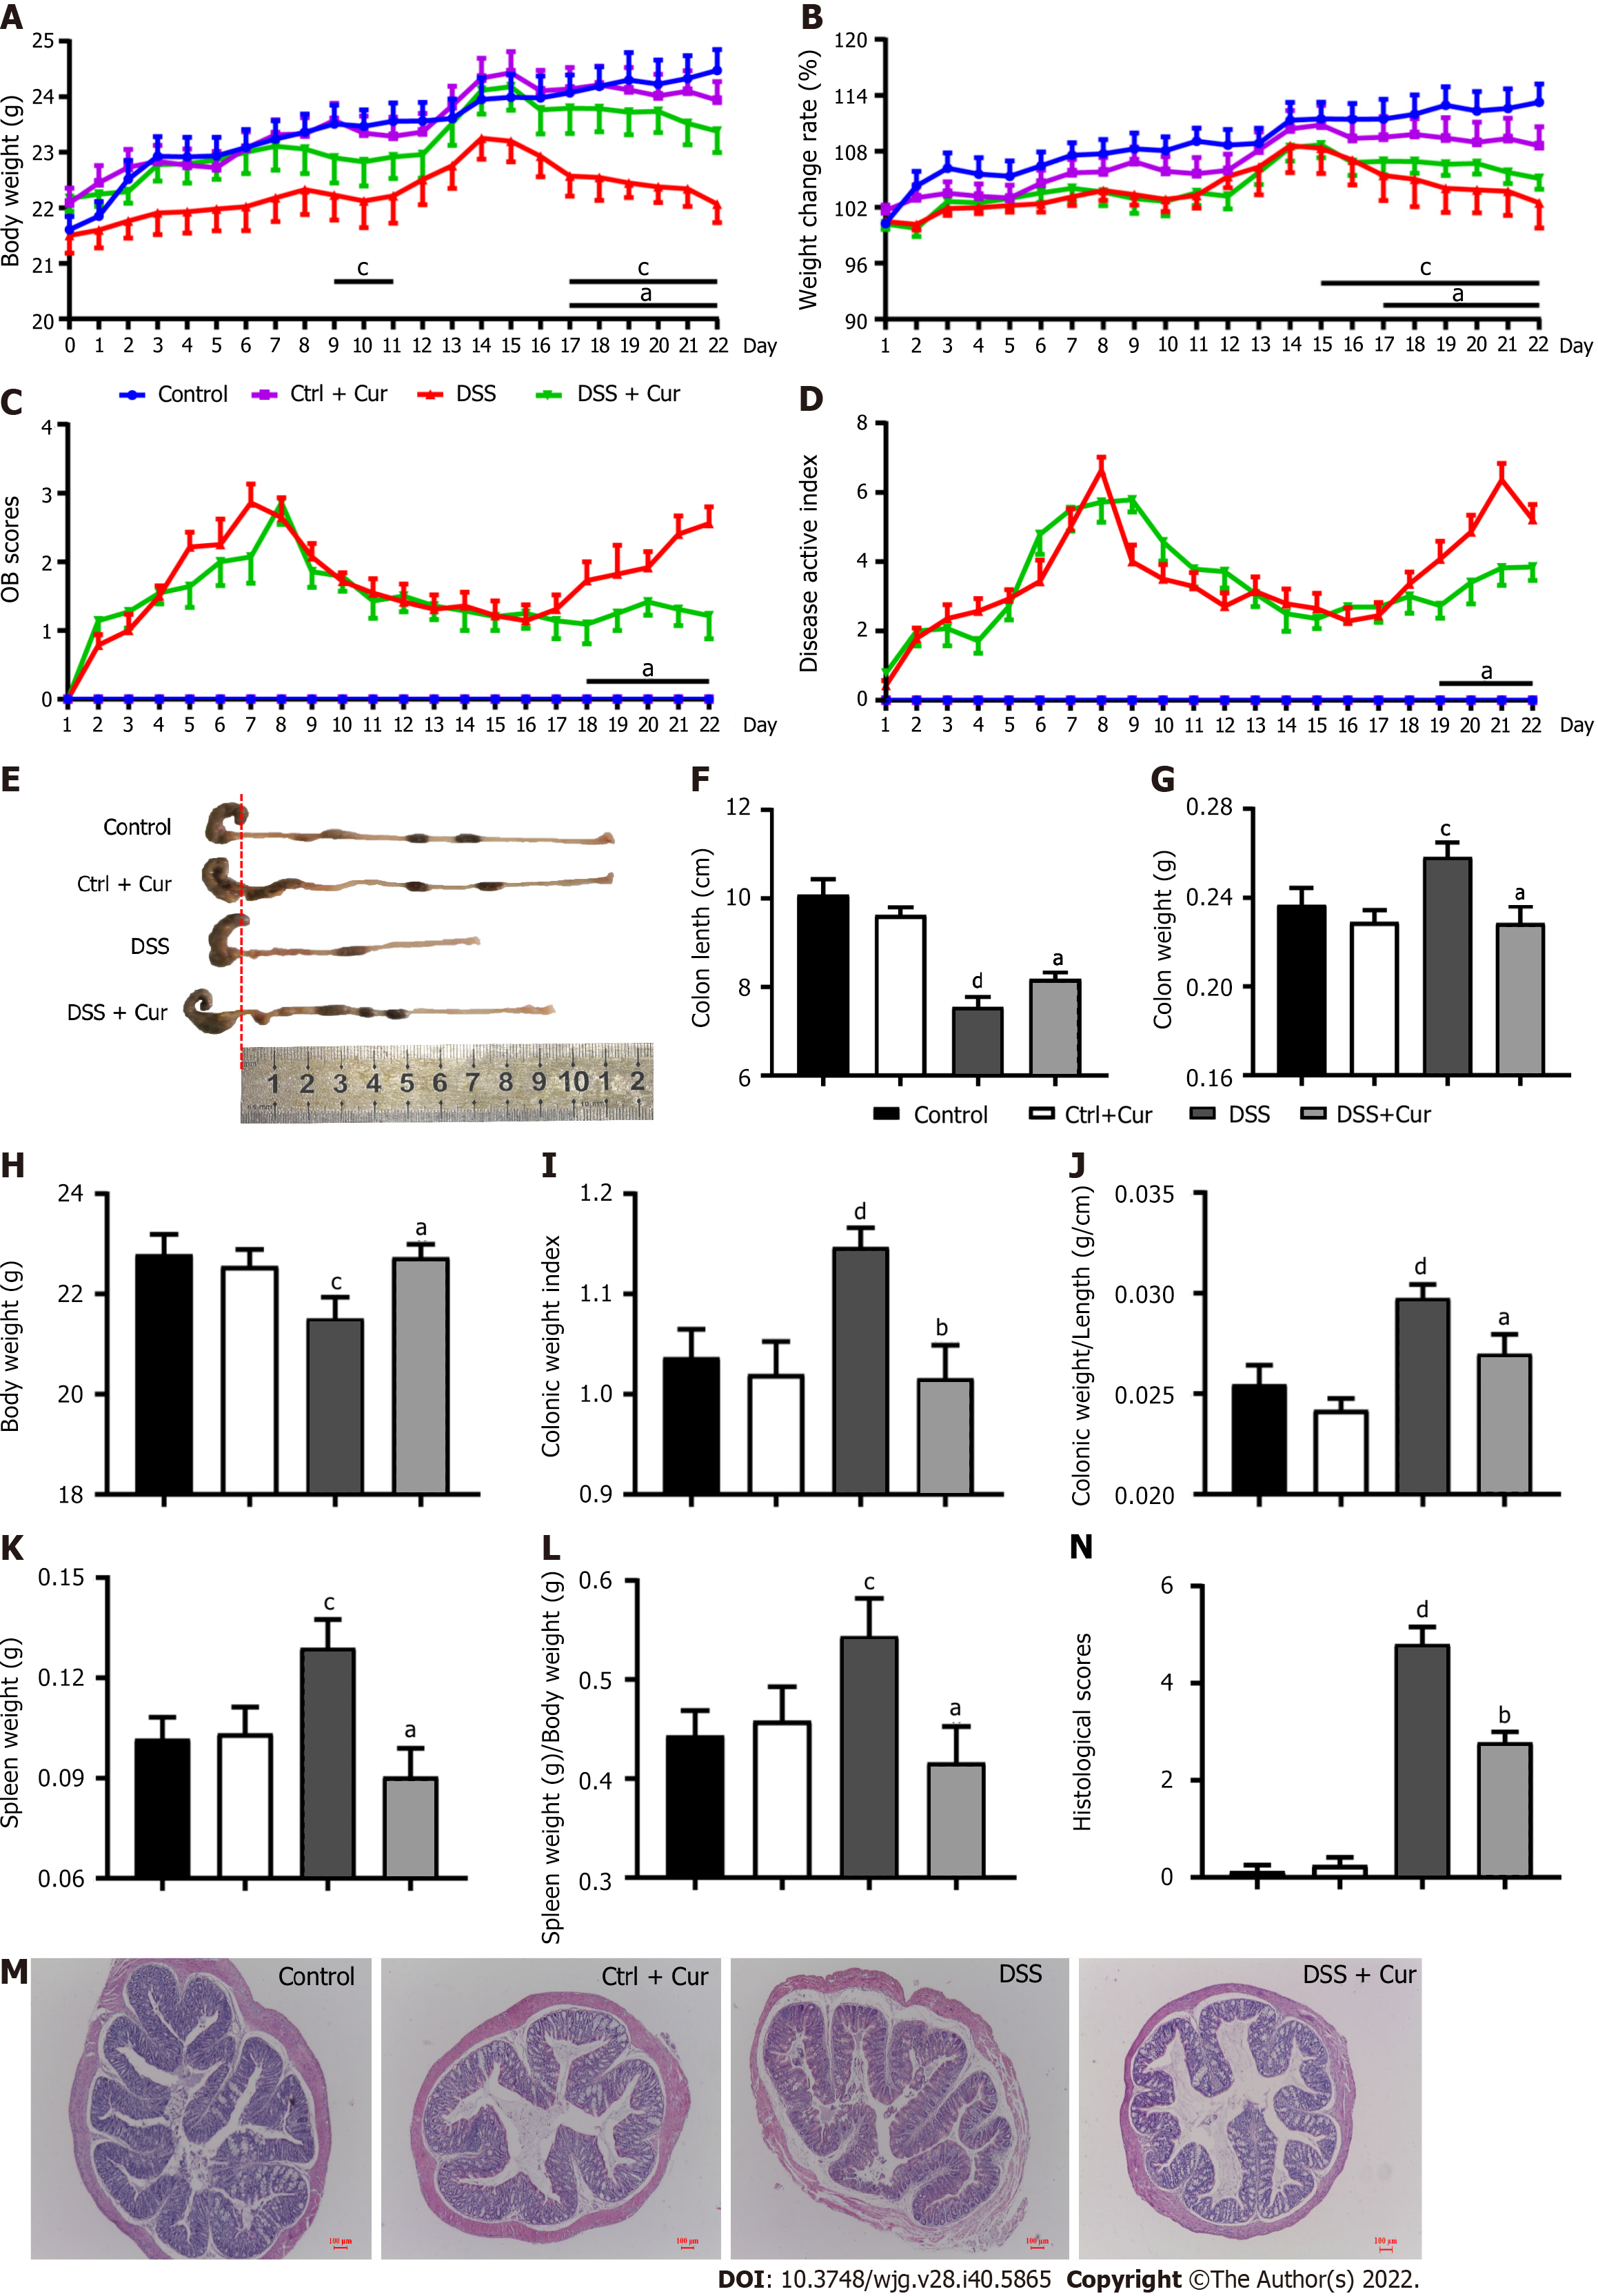
Figure 2 Therapeutic evaluation of curcumin on DSS-induced experimental colitis.
A: Body weight of mice from days 0-22; B: Weight change of rate in mice from days 1-22; C: OB scores of mice in the four groups from days 1-22; D: DAI scores of mice in the four groups from days 1-22; E: Gross changes in colonic length; F: Colonic length of mice on day 22 in the four groups; G: Colonic weight; H: Body weight; I: Colonic weight index; J: Colonic weight/colonic length; K: Spleen weight; L: Spleen weight/body weight; M: Histological appearance of colons from individual groups of mice (hematoxylin and eosin staining, magnification 50 ×, scale bar = 100 μm); N: Pathological injury score. Data are presented as the mean ± SE (n = 8-10). aP < 0.05, bP < 0.01 vs Control group; cP < 0.05, dP < 0.01 vs DSS group.
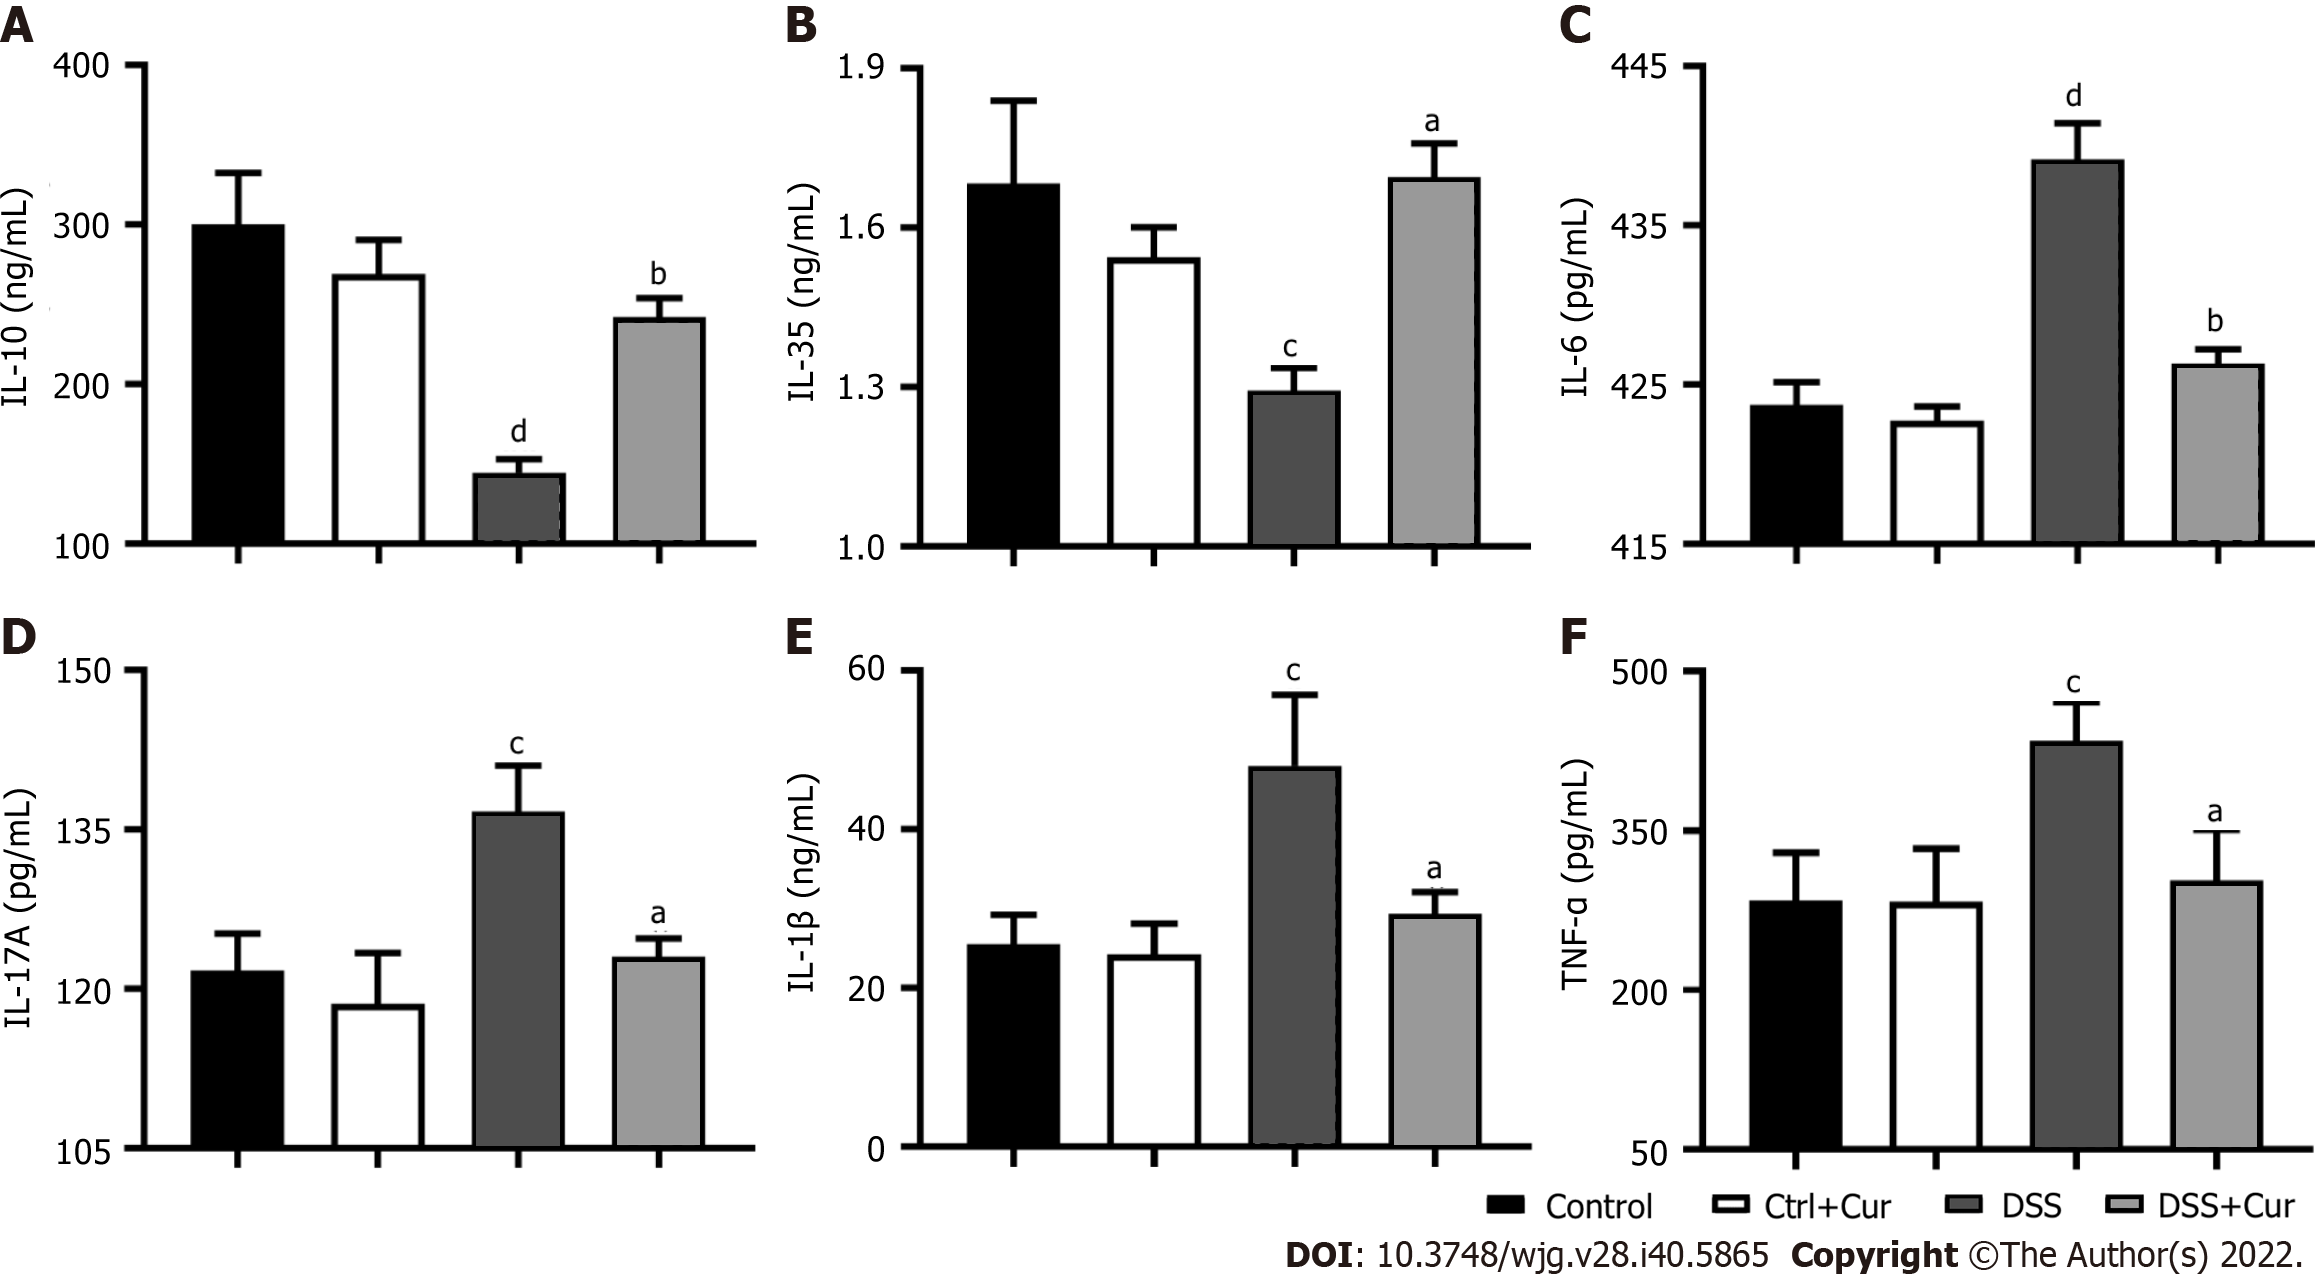
Figure 3 Curcumin effectively regulates inflammatory cytokine expression.
A: Concentration of IL-10 in colonic tissue; B: Concentration of IL-35 in colonic tissue; C: Concentration of IL-6 in colonic tissue; D: Concentration of IL-17A in colonic tissue; E: Concentration of IL-1β in colonic tissue; F: Concentration of TNF-α in colonic tissue. Data are presented as the mean ± SE (n = 8-10). aP < 0.05, bP < 0.01 vs Control group; cP < 0.05, dP < 0.01 vs DSS group.
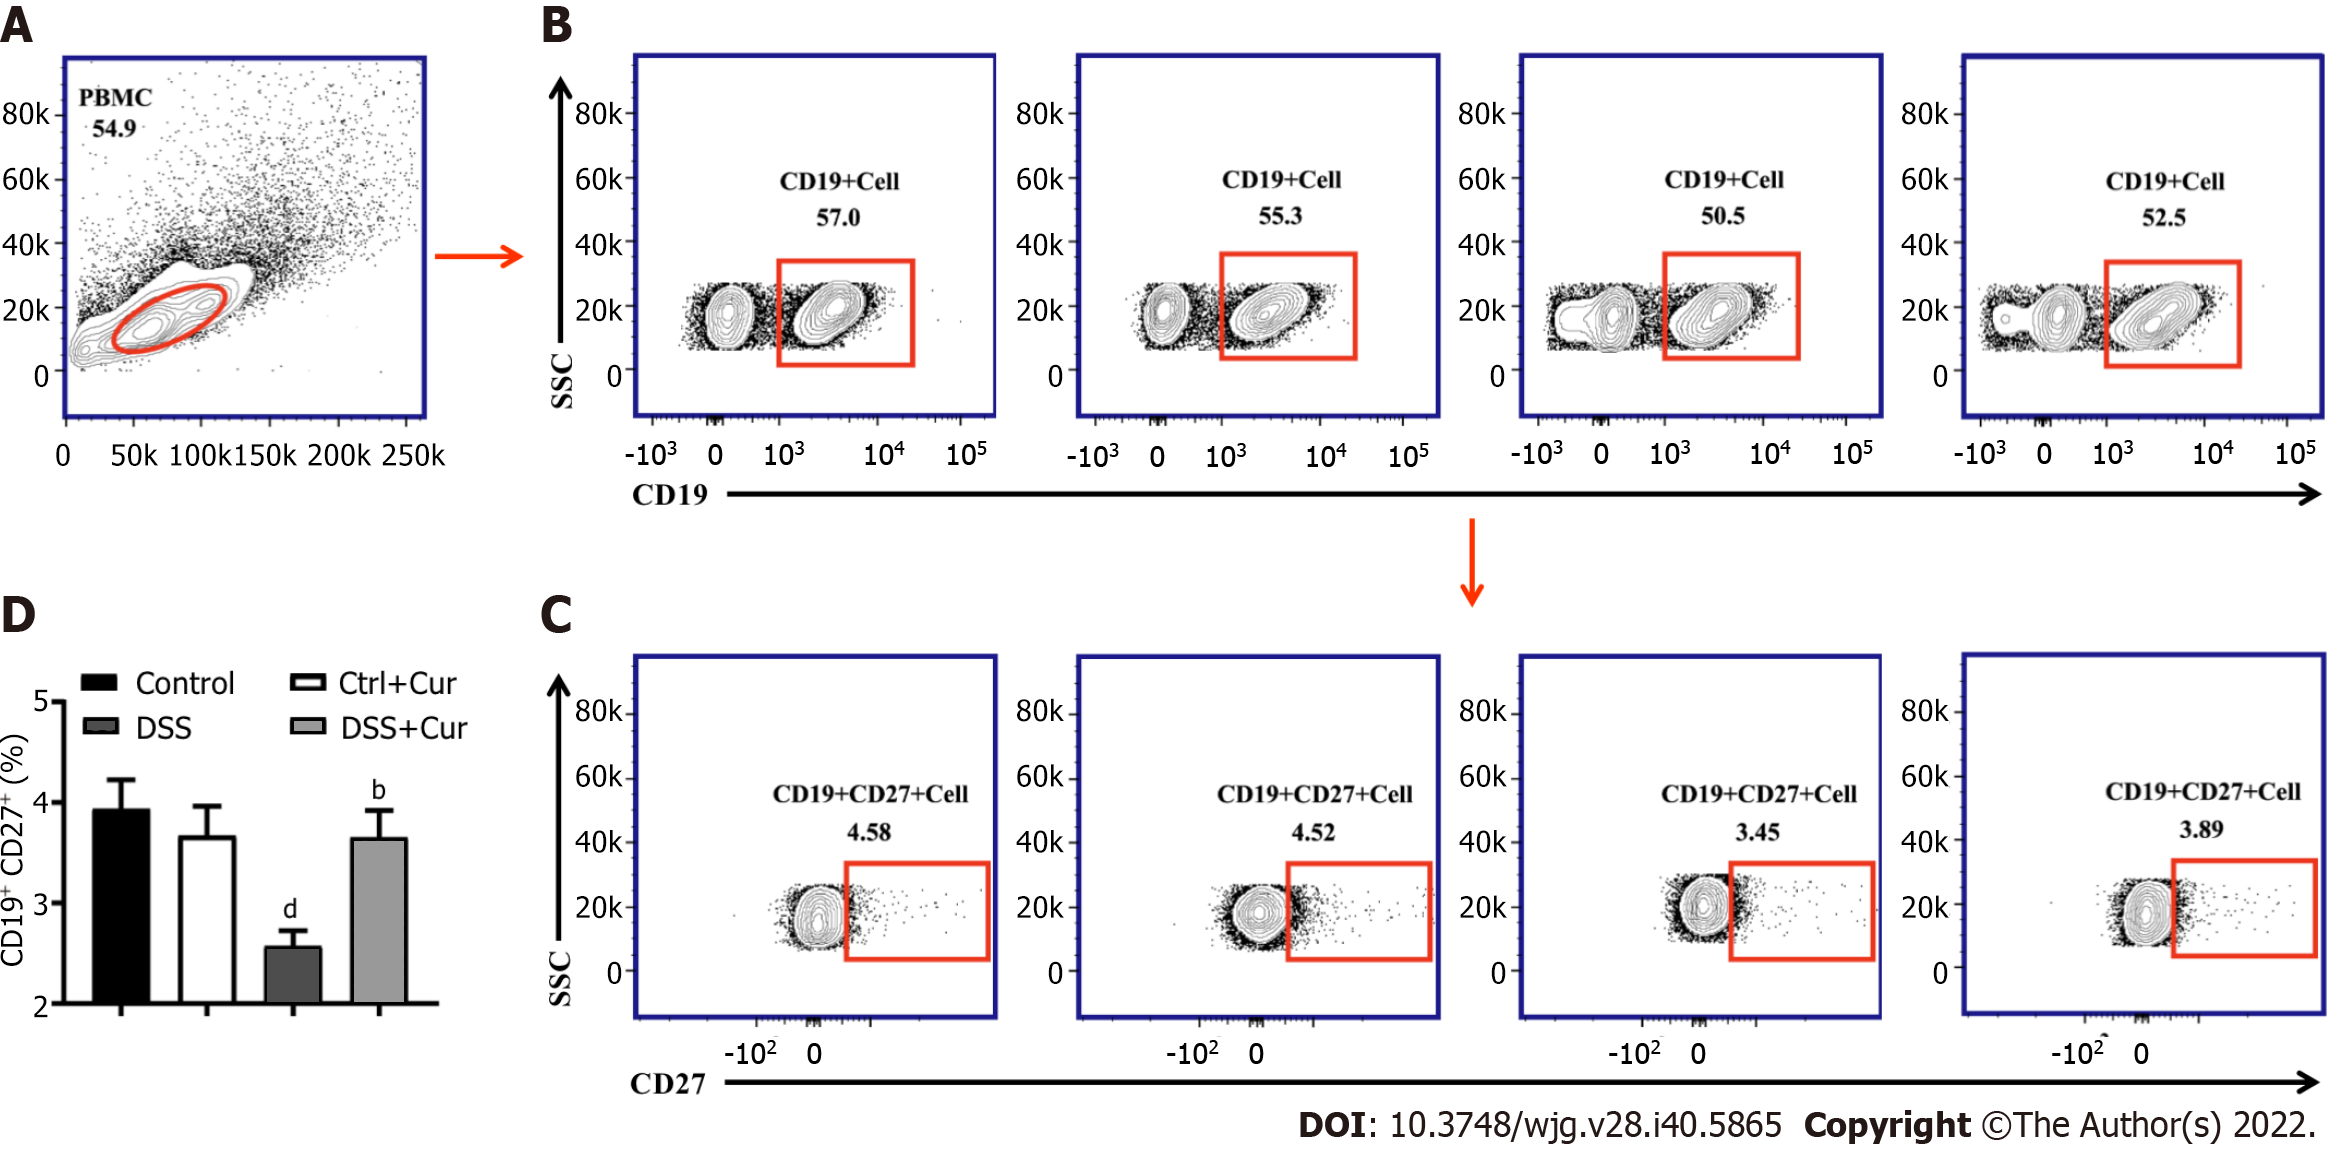
Figure 4 Curcumin regulates differentiation of memory B cells in DSS-induced ulcerative colitis mice.
A: Representative flow cytometry profile of peripheral blood mononuclear cells (PBMC); B: Representative flow cytometry profile of CD19+ cells in peripheral blood; C: Representative flow cytometry profile of CD19+ CD27+ cells in peripheral blood; D: Bar chart of CD19+ CD2 + memory B cells. Data are presented as the mean ± SE (n = 8-10). aP < 0.05, bP < 0.01 vs Control group; cP < 0.05, dP < 0.01 vs DSS group.
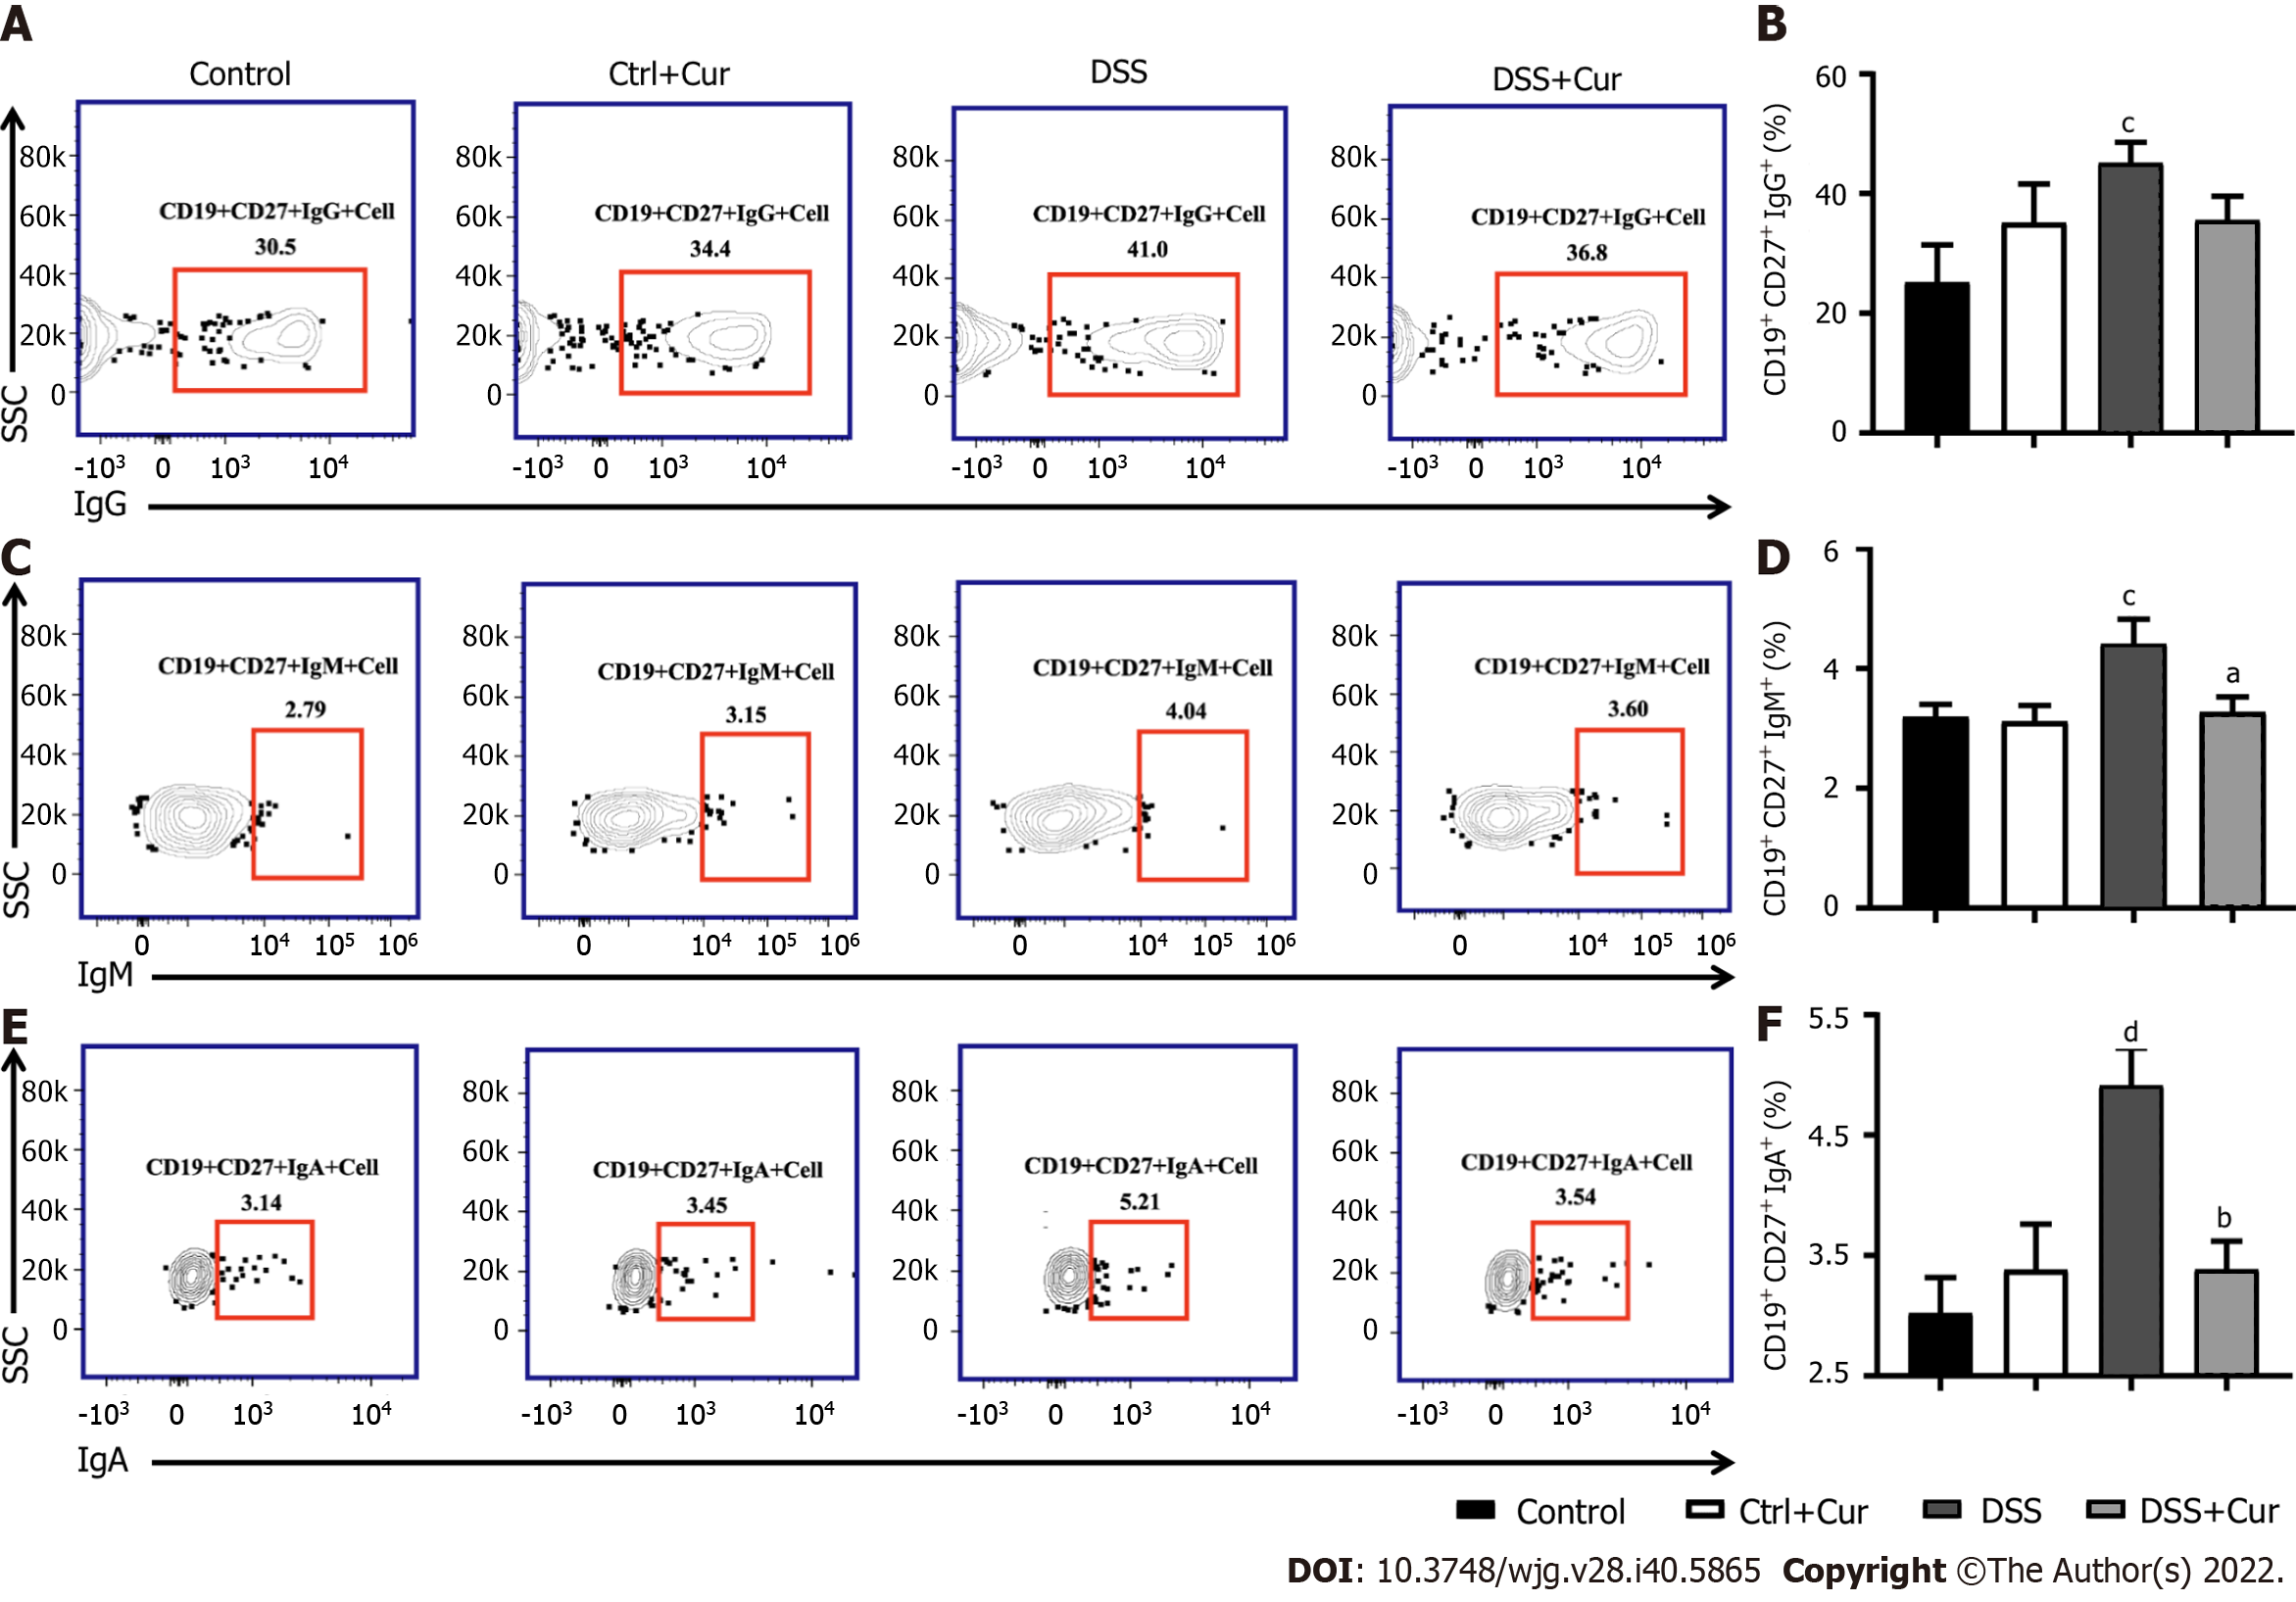
Figure 5 Curcumin regulates differentiation of memory B cells in DSS-induced ulcerative colitis mice.
A: Representative flow cytometry profile of CD19+ CD27+ IgG+ cells in peripheral blood; B: Bar chart of CD19+ CD27+ IgG+ cells; C: Representative flow cytometry profile of CD19+ CD27+ IgM+ cells in peripheral blood; D: Bar chart of CD19+ CD27+ IgM+ cells; E: Representative flow cytometry profile of CD19+ CD27+ IgA+ cells in peripheral blood; F: Bar chart of CD19+ CD27+ IgA+ cells. Data are presented as the mean ± SE (n = 8-10). aP < 0.05, bP < 0.01 vs Control group; cP < 0.05, dP < 0.01 vs DSS group.
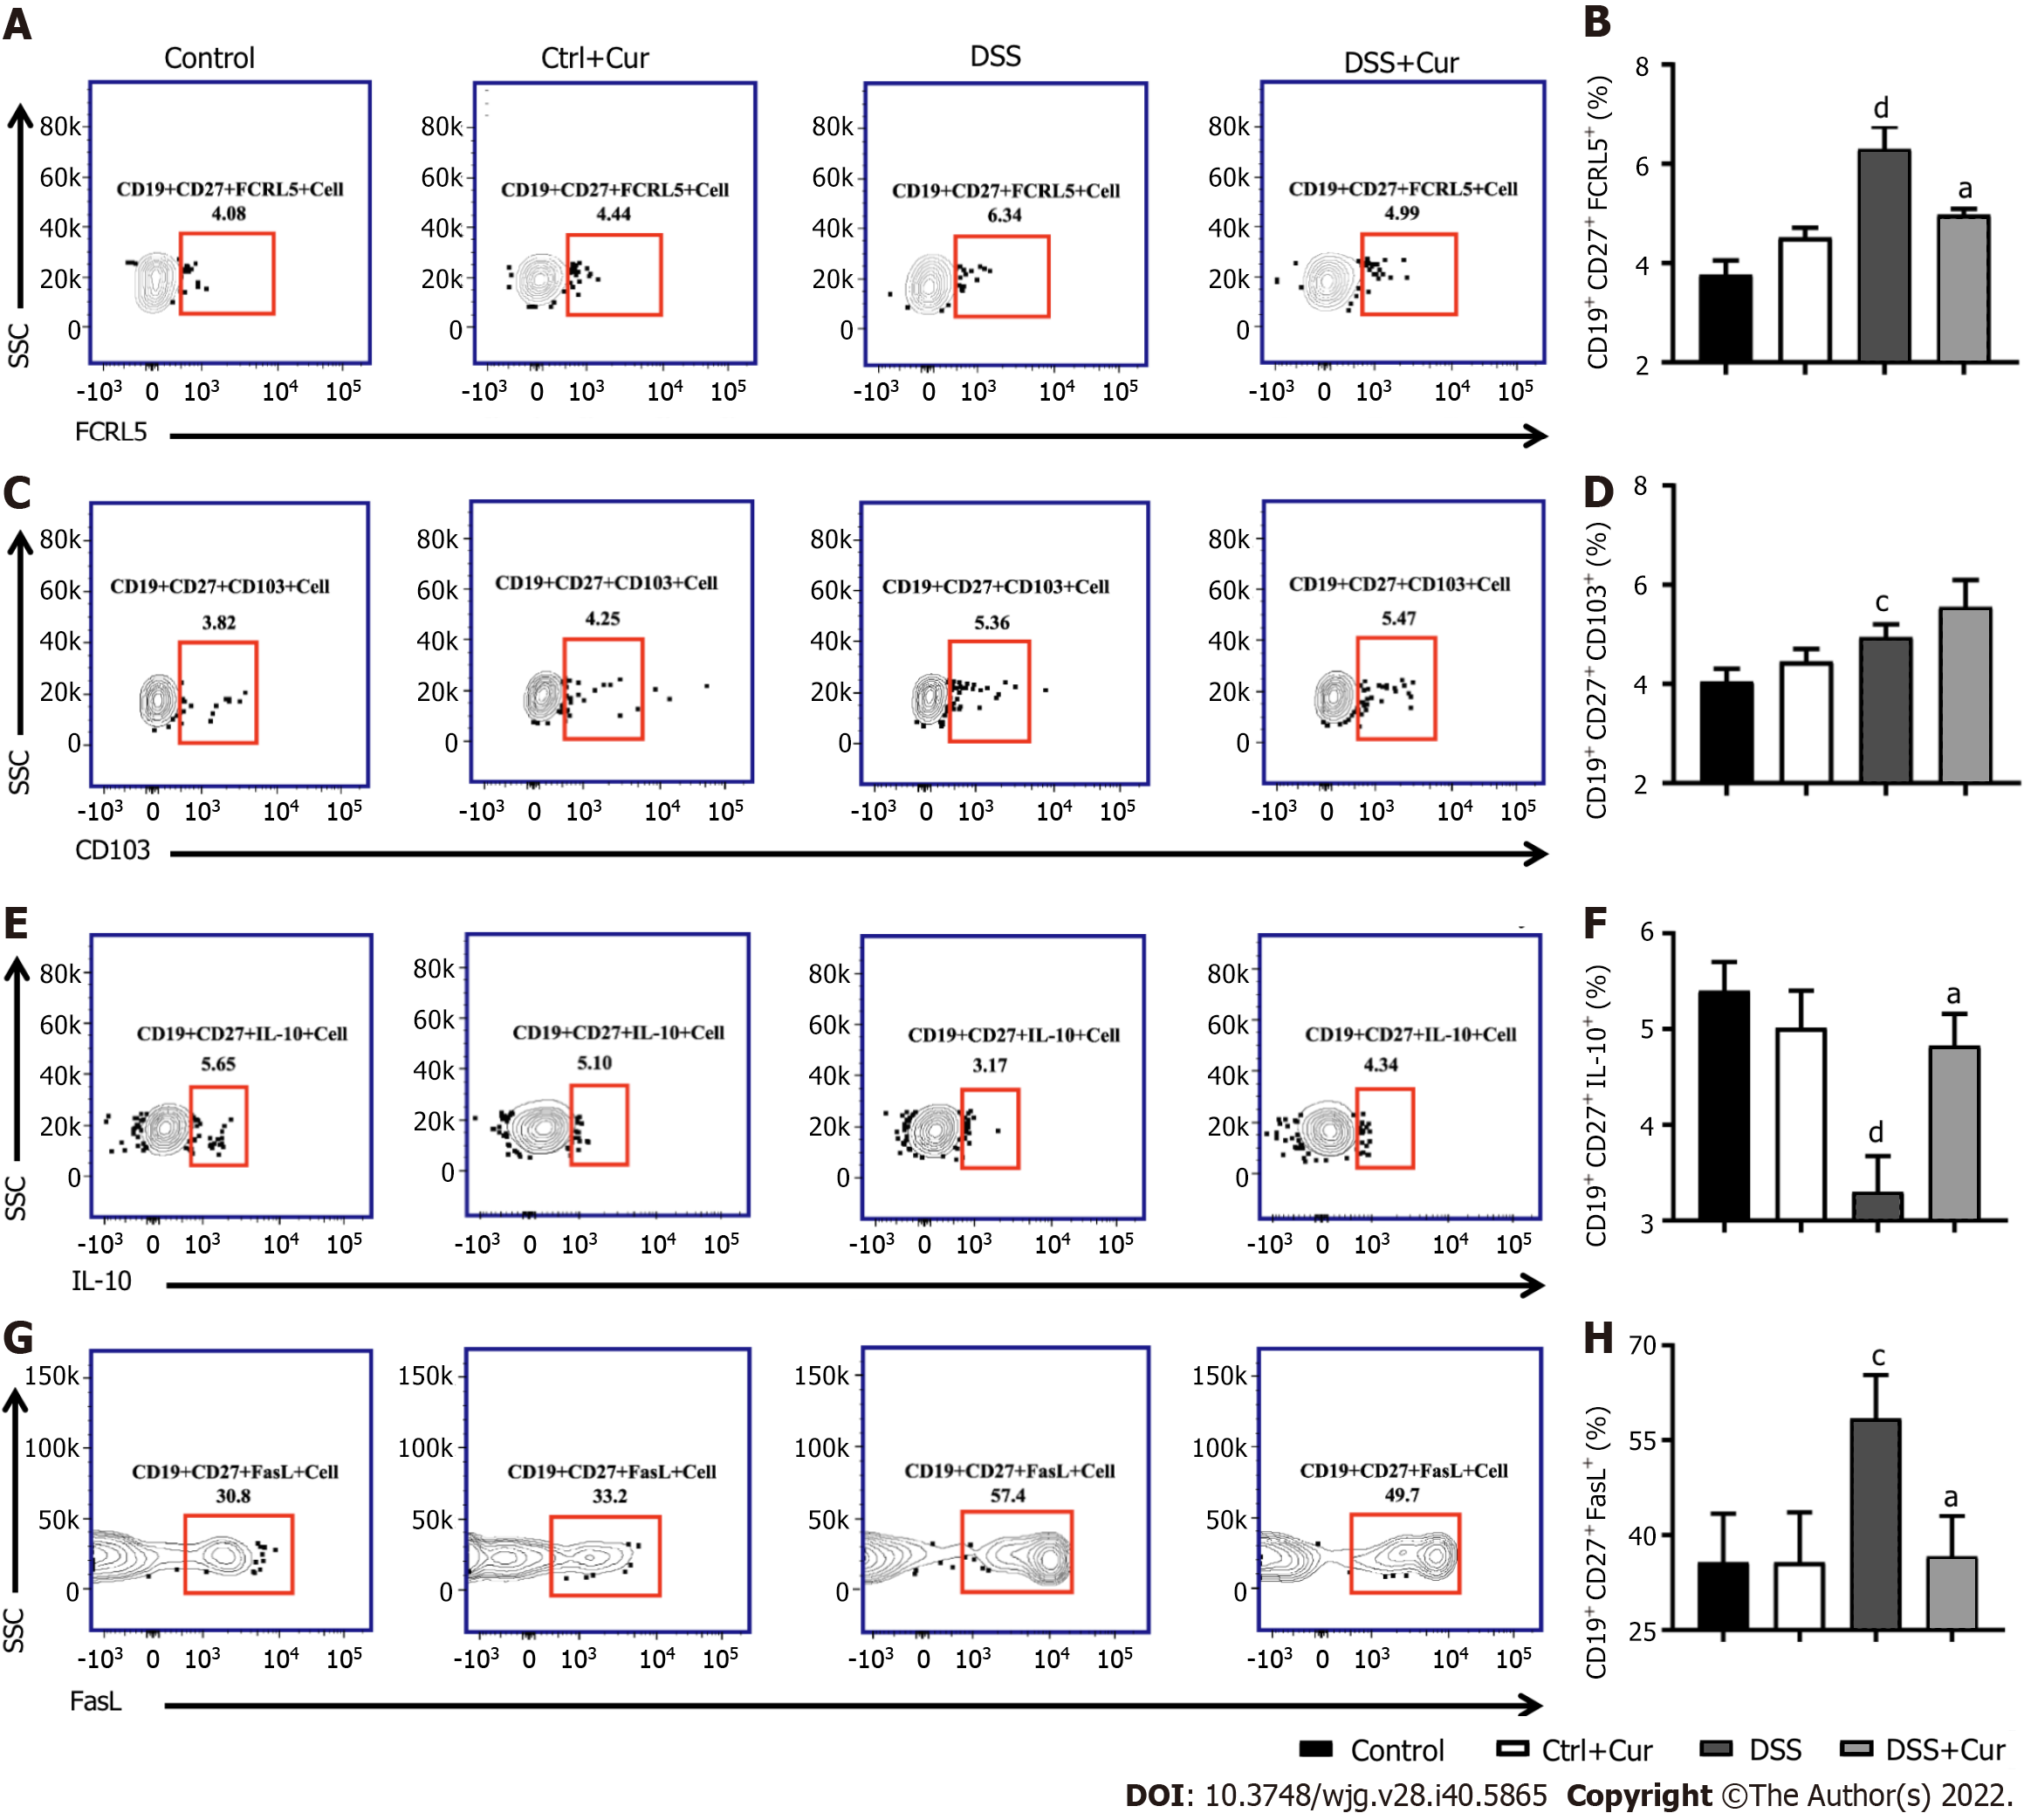
Figure 6 Curcumin regulates differentiation of memory B cells in DSS-induced ulcerative colitis mice.
A: Representative flow cytometry profile of CD19+ CD27+ FCRL5+ cells in peripheral blood; B: Bar chart of CD19+ CD27+ FCRL5+ cells; C: Representative flow cytometry profile of CD19+ CD27+ CD103+ cells in peripheral blood; D: Bar chart of CD19+ CD27+ CD103+ cell; E: Representative flow cytometry profile of CD19+ CD27+ IL-10+ cells in peripheral blood; F: Bar chart of CD19+ CD27+ IL-10+ cells; G: Representative flow cytometry profile of CD19+ CD27+ FasL+ cells in peripheral blood; H: Bar chart of CD19+ CD27+ FasL+ cells. Data are presented as the mean ± SE (n = 8-10). aP < 0.05, bP < 0.01 vs Control group; cP < 0.05, dP < 0.01 vs DSS group.
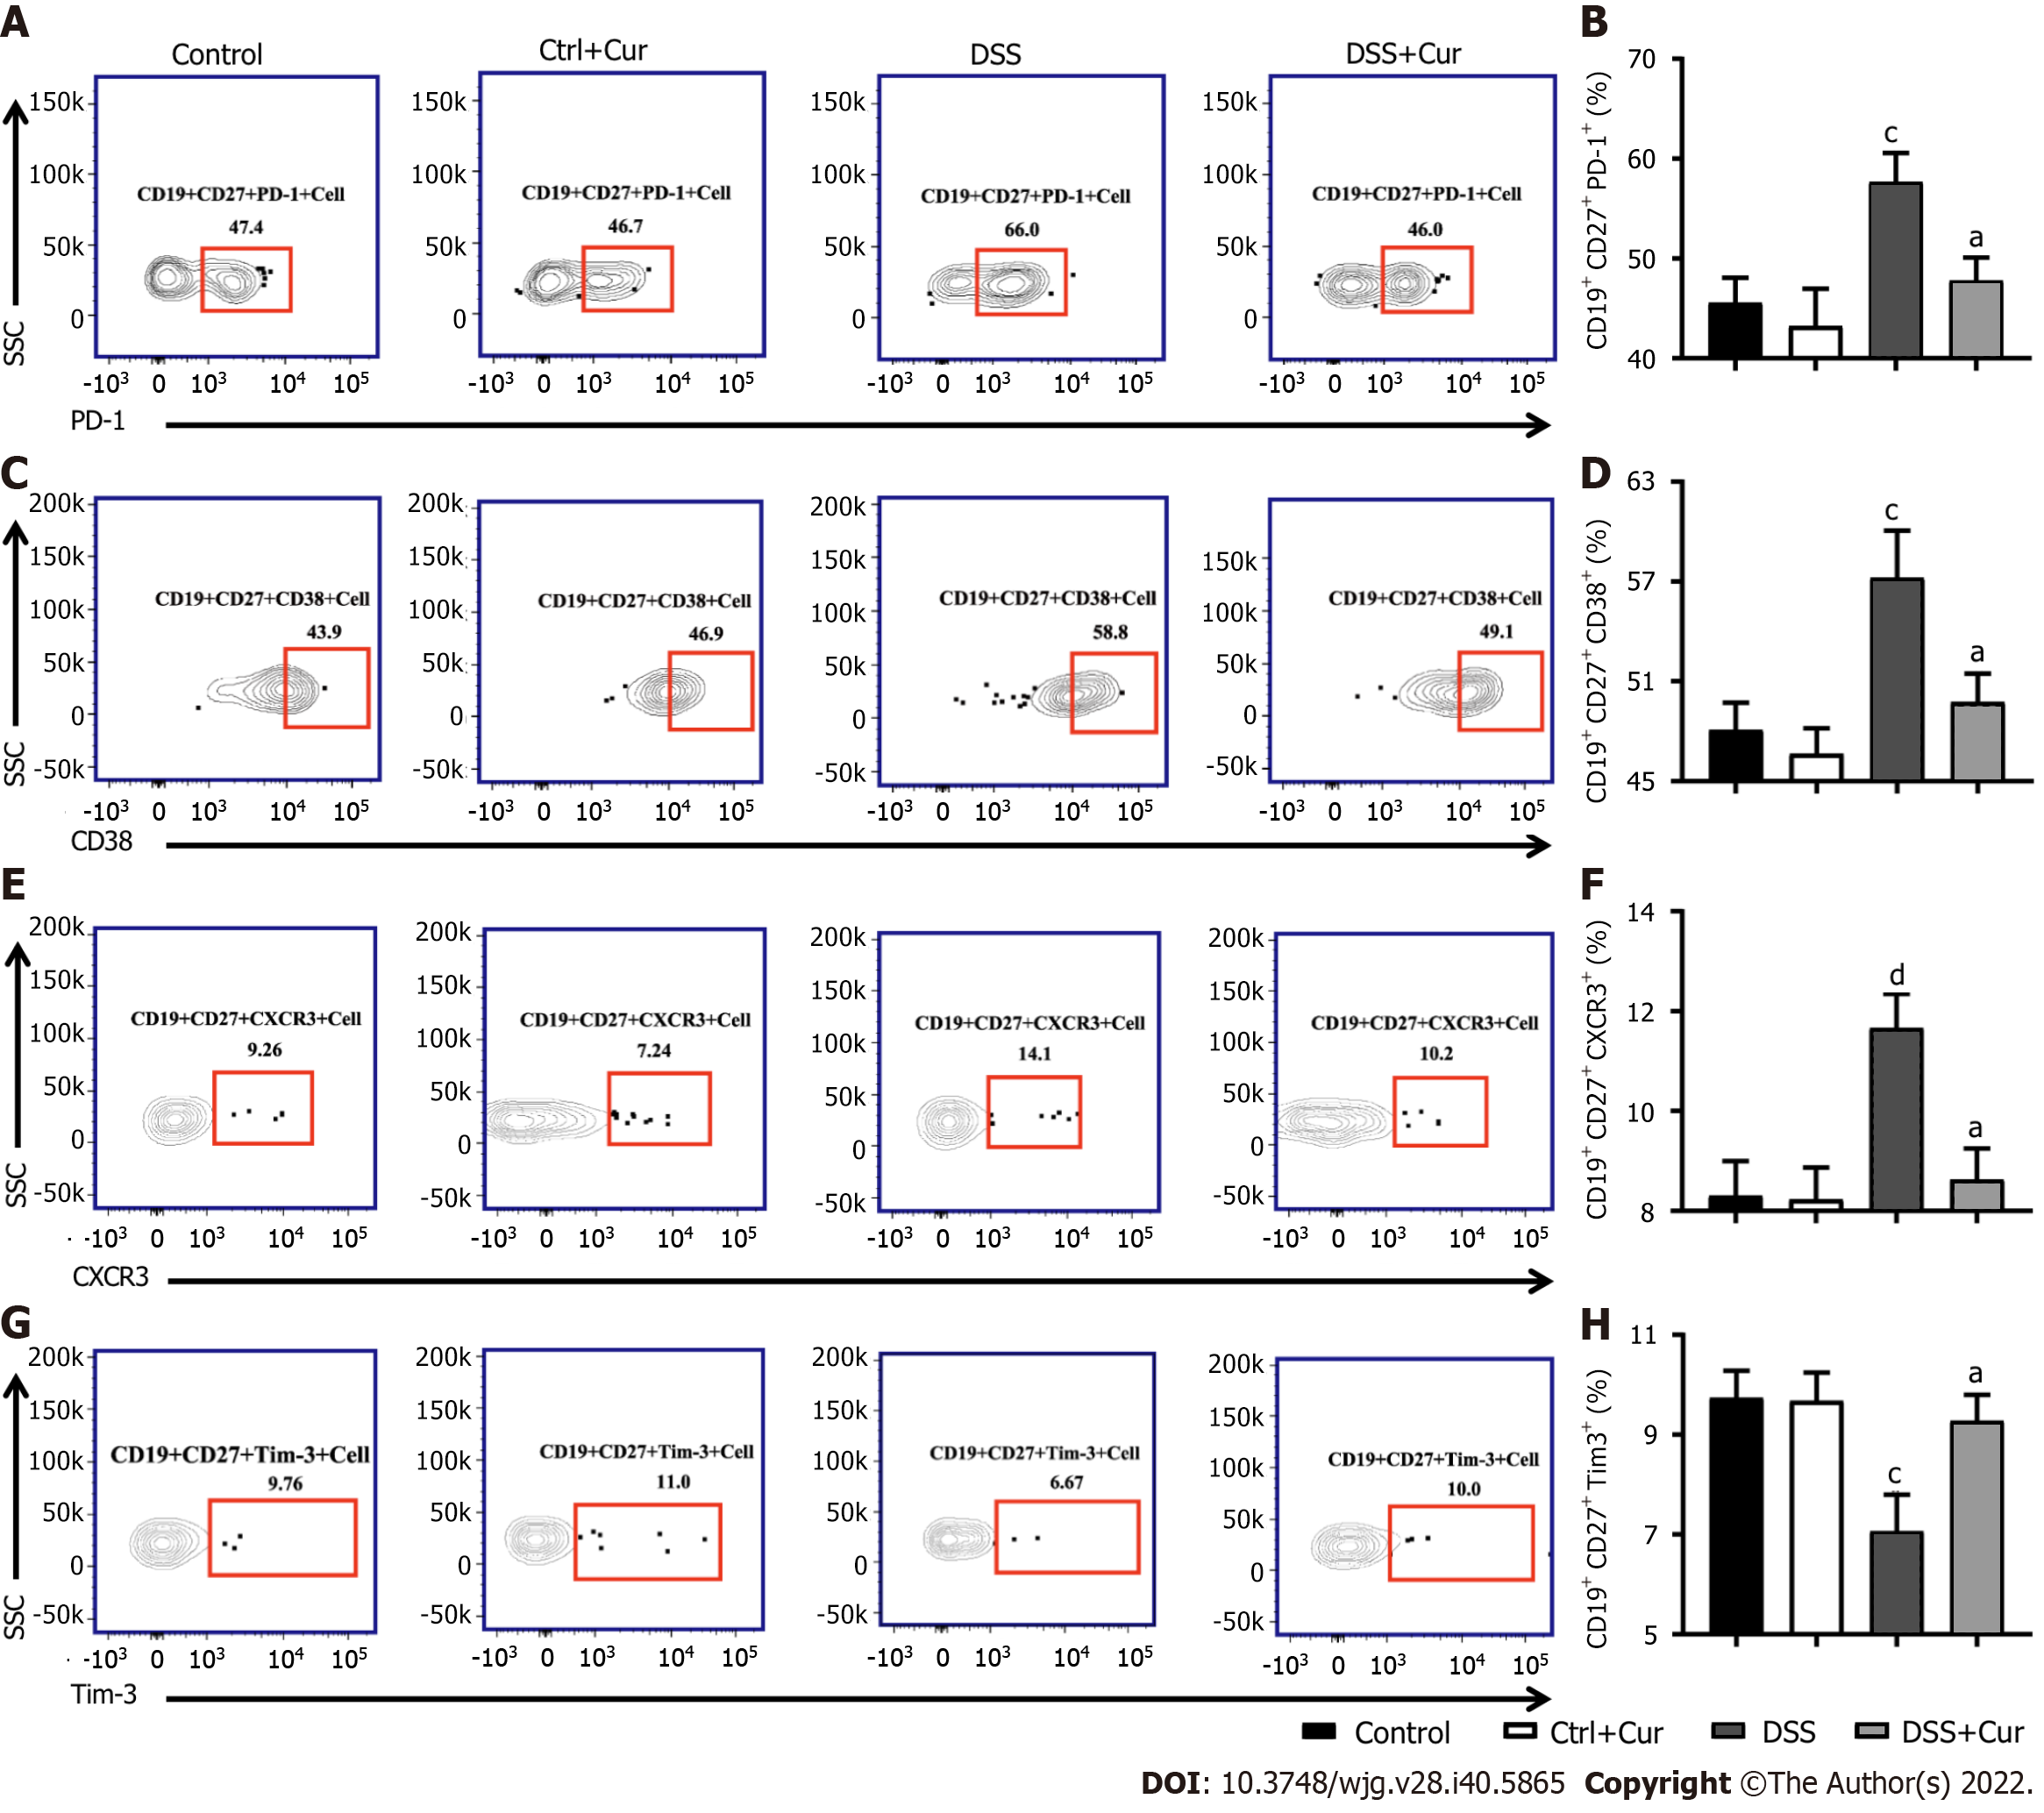
Figure 7 Curcumin regulates differentiation of memory B cells in DSS-induced ulcerative colitis mice.
A: Representative flow cytometry profile of CD19+ CD27+ PD-1+ cells in peripheral blood; B: Bar chart of CD19+ CD27+ PD-1+ cells; C: Representative flow cytometry profile of CD19+ CD27+ CD38+ cells in peripheral blood; D: Bar chart of CD19+ CD27+ CD38+ cells; E: Representative flow cytometry profile of CD19+ CD27+ CXCR3+ cells in peripheral blood; F: Bar chart of CD19+ CD27+ CXCR3+ cells; G: Representative flow cytometry profile of CD19+ CD27+ Tim-3+ cells in peripheral blood; H: Bar chart of CD19+ CD27+ Tim-3+ cells. Data are presented as the mean ± SE (n = 8-10). aP < 0.05, bP < 0.01 vs Control group; cP < 0.05, dP < 0.01 vs DSS group.
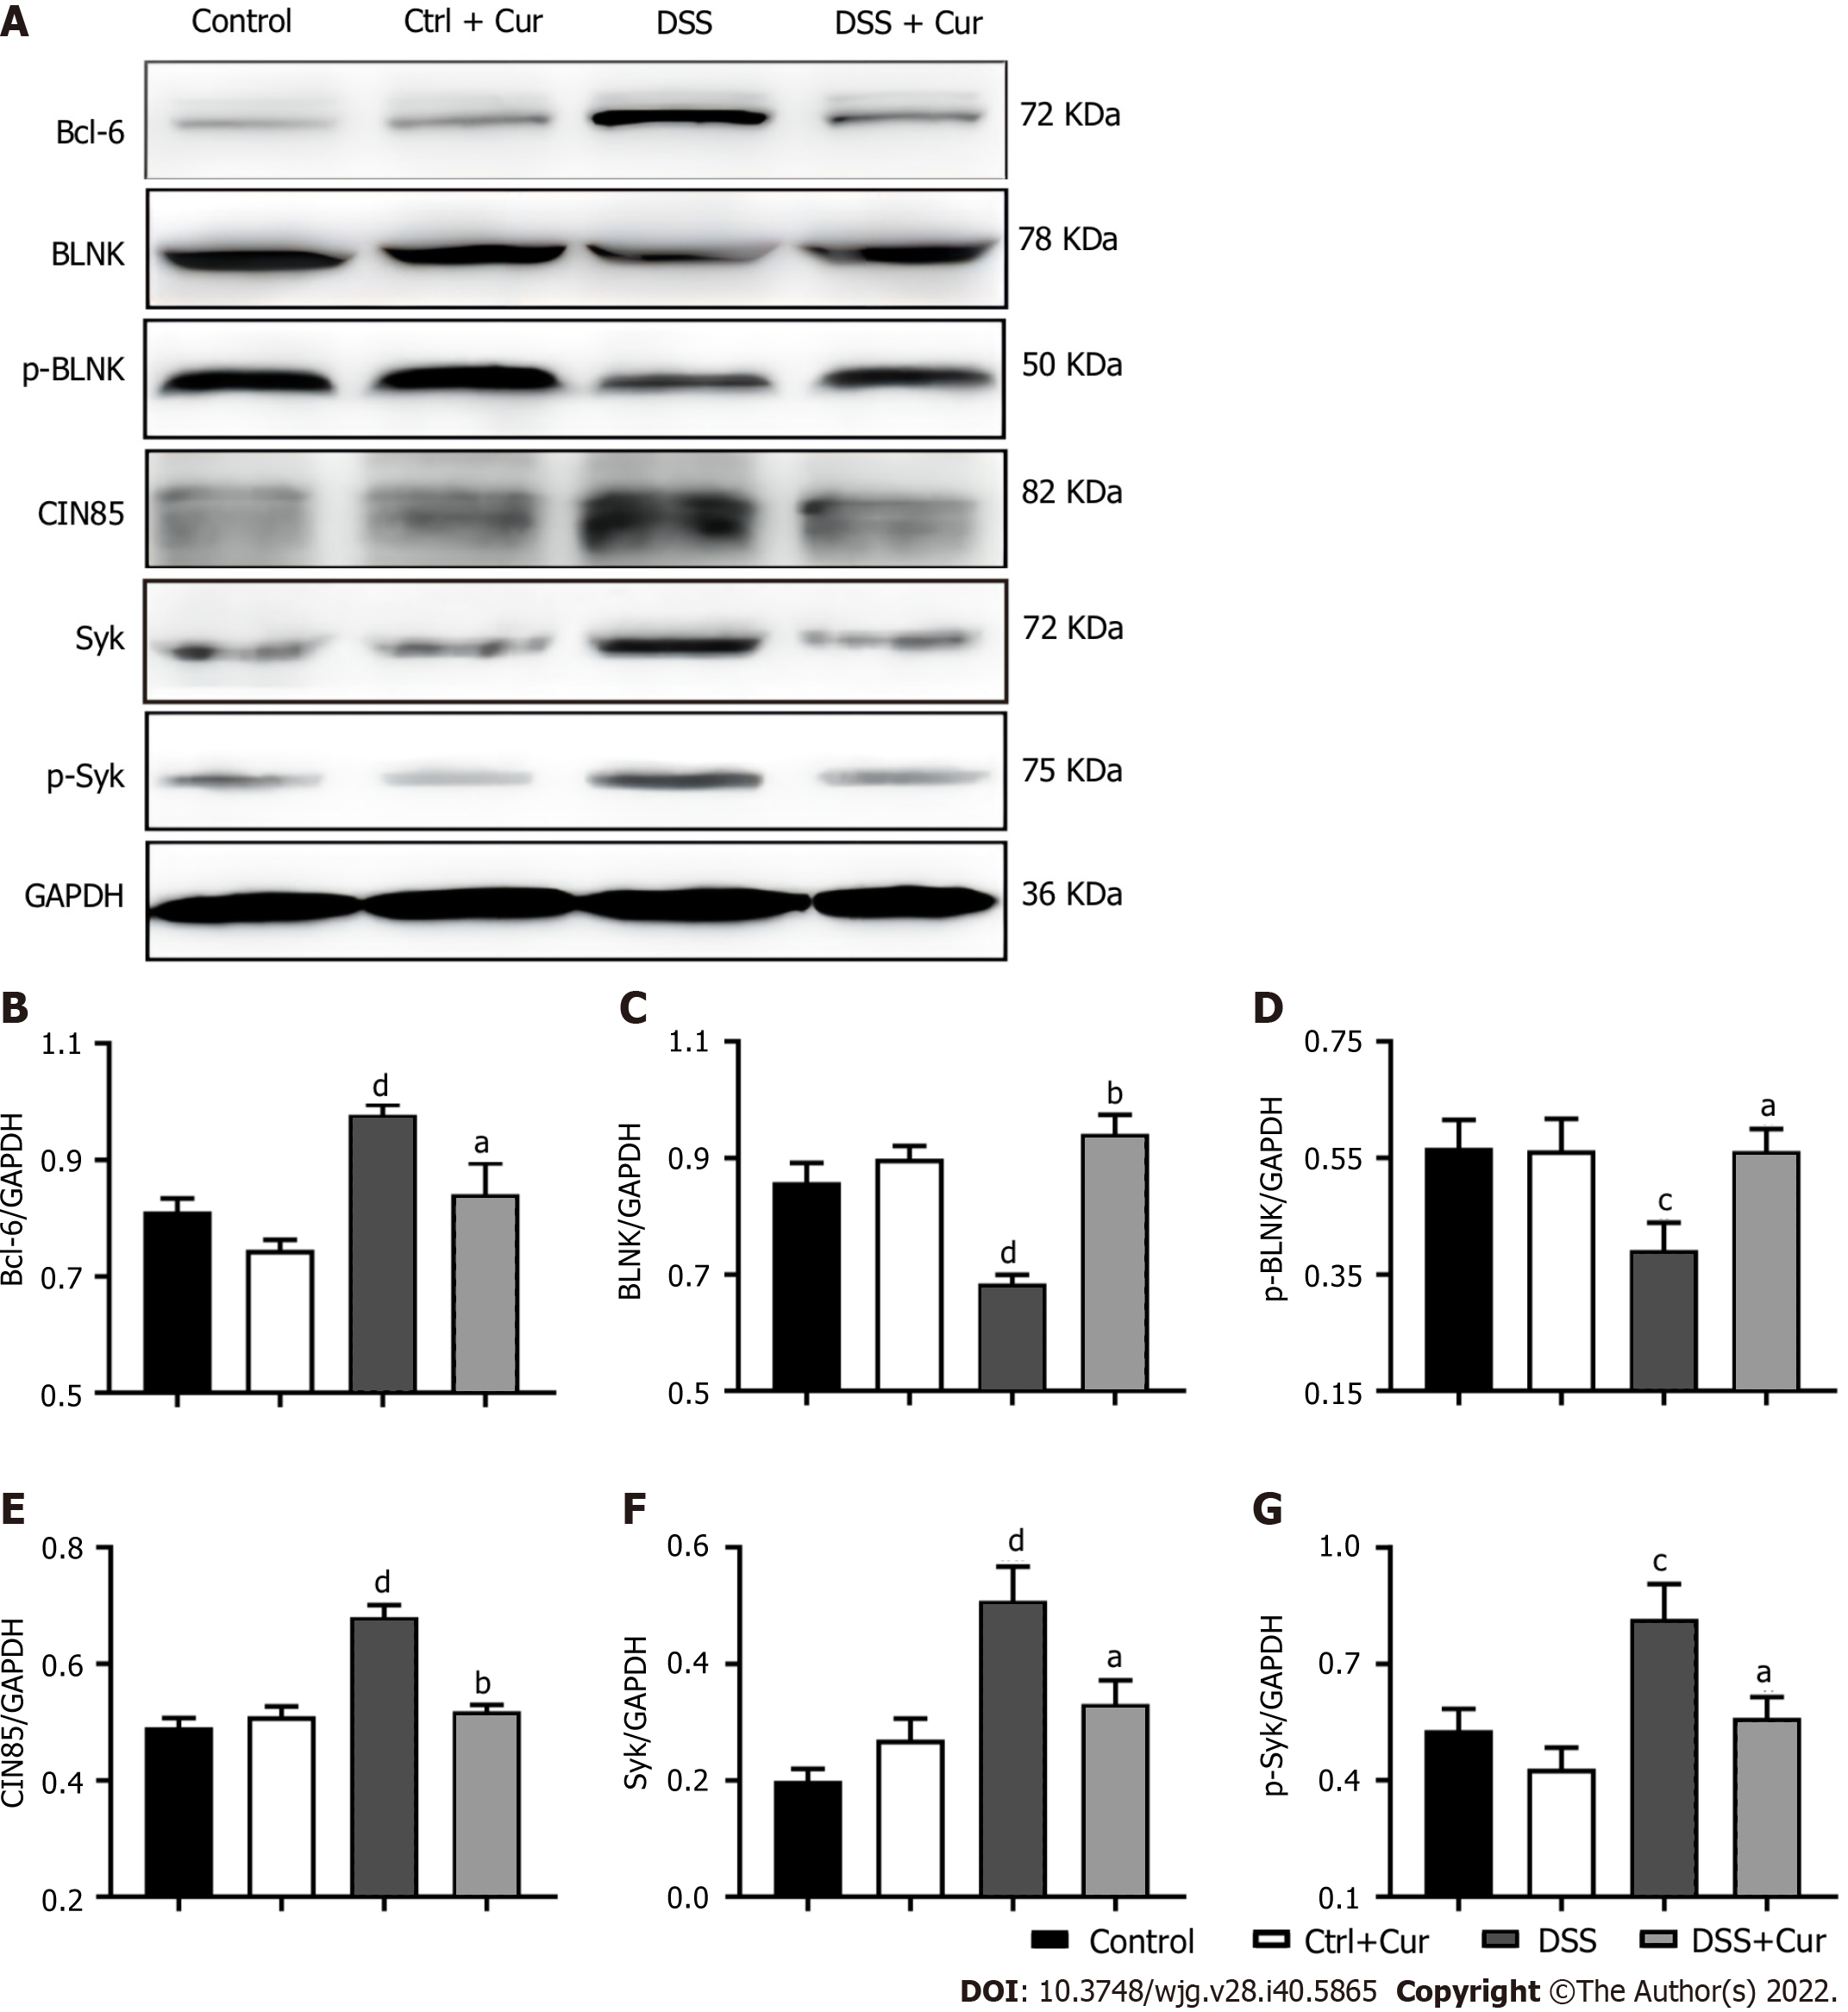
Figure 8 Curcumin regulates expression of memory B cell-related proteins in DSS-induced ulcerative colitis mice.
A: Expression of Bcl-6, BLNK, p-BLNK, CIN85, Syk, and p-Syk in colon tissues as revealed by Western blot analysis. GAPDH served as the internal reference; B-G: Quantitative evaluation of (B) Bcl-6, (C) BLNK, (D) p-BLNK, (E) CIN85, (F) Syk, and (G) p-Syk. Data are presented as the mean ± SE (n = 8-10). aP < 0.05, bP < 0.01 vs Control group; cP < 0.05, dP < 0.01 vs DSS group.
- Citation: Wei SY, Wu TT, Huang JQ, Kang ZP, Wang MX, Zhong YB, Ge W, Zhou BG, Zhao HM, Wang HY, Liu DY. Curcumin alleviates experimental colitis via a potential mechanism involving memory B cells and Bcl-6-Syk-BLNK signaling. World J Gastroenterol 2022; 28(40): 5865-5880
- URL: https://www.wjgnet.com/1007-9327/full/v28/i40/5865.htm
- DOI: https://dx.doi.org/10.3748/wjg.v28.i40.5865


