Copyright
©The Author(s) 2022.
World J Gastroenterol. Sep 7, 2022; 28(33): 4846-4860
Published online Sep 7, 2022. doi: 10.3748/wjg.v28.i33.4846
Published online Sep 7, 2022. doi: 10.3748/wjg.v28.i33.4846
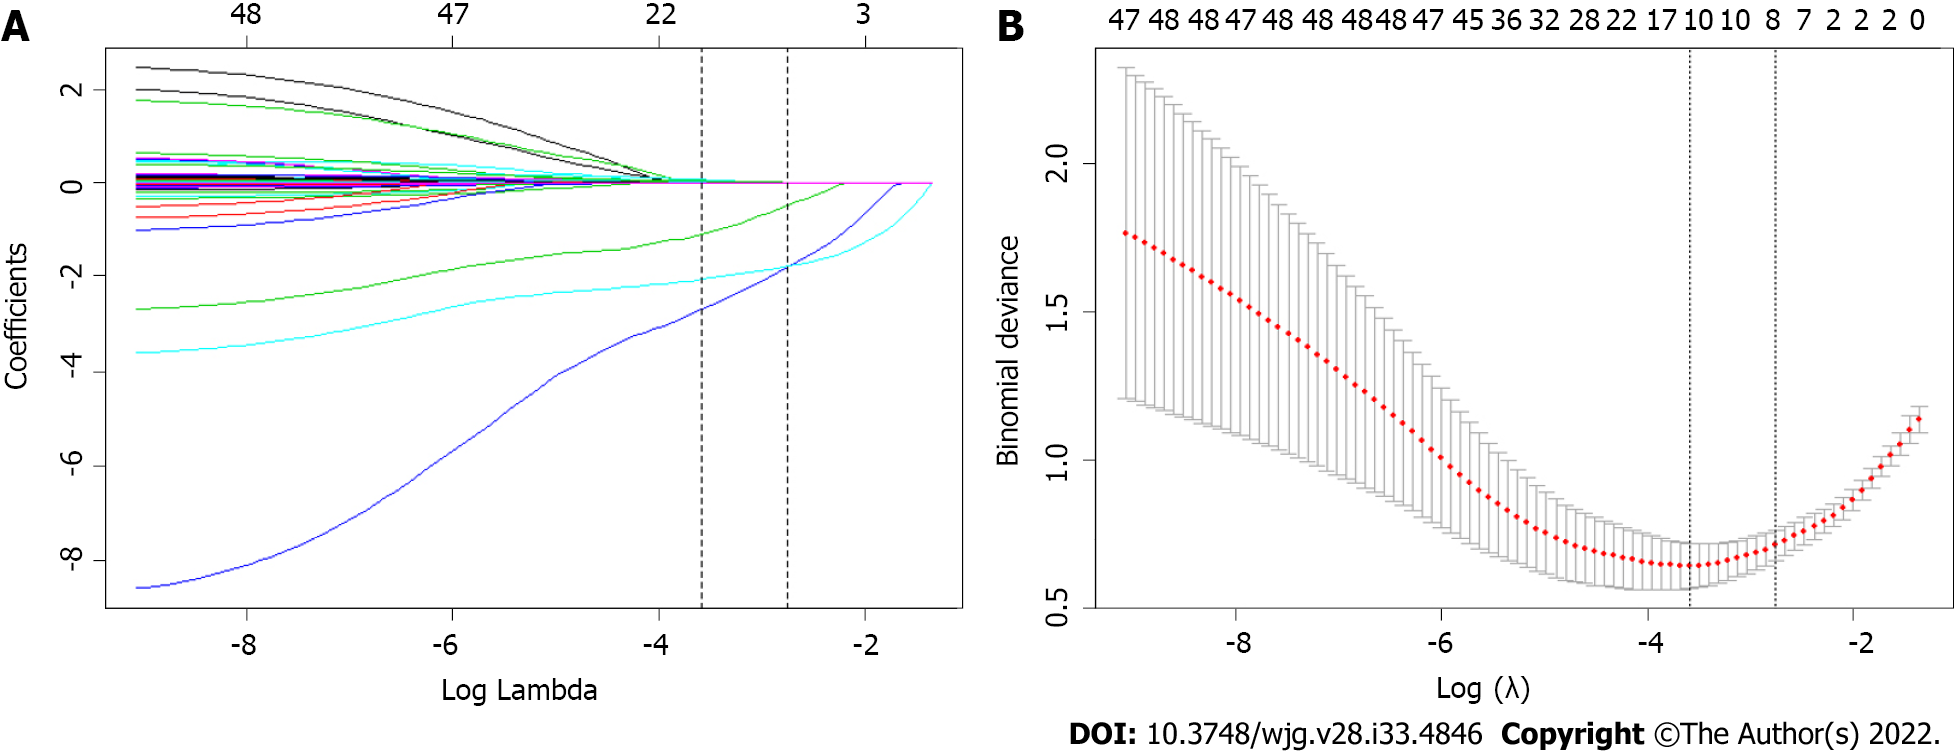
Figure 1 Feature selection using the least absolute shrinkage and selection operator binary logistic regression model.
A: Least absolute shrinkage and selection operator (LASSO) coefficient profiles of the 42 baseline features; B: Tuning parameter (λ) selection in the LASSO model using 10-fold cross-validation via minimum criteria.
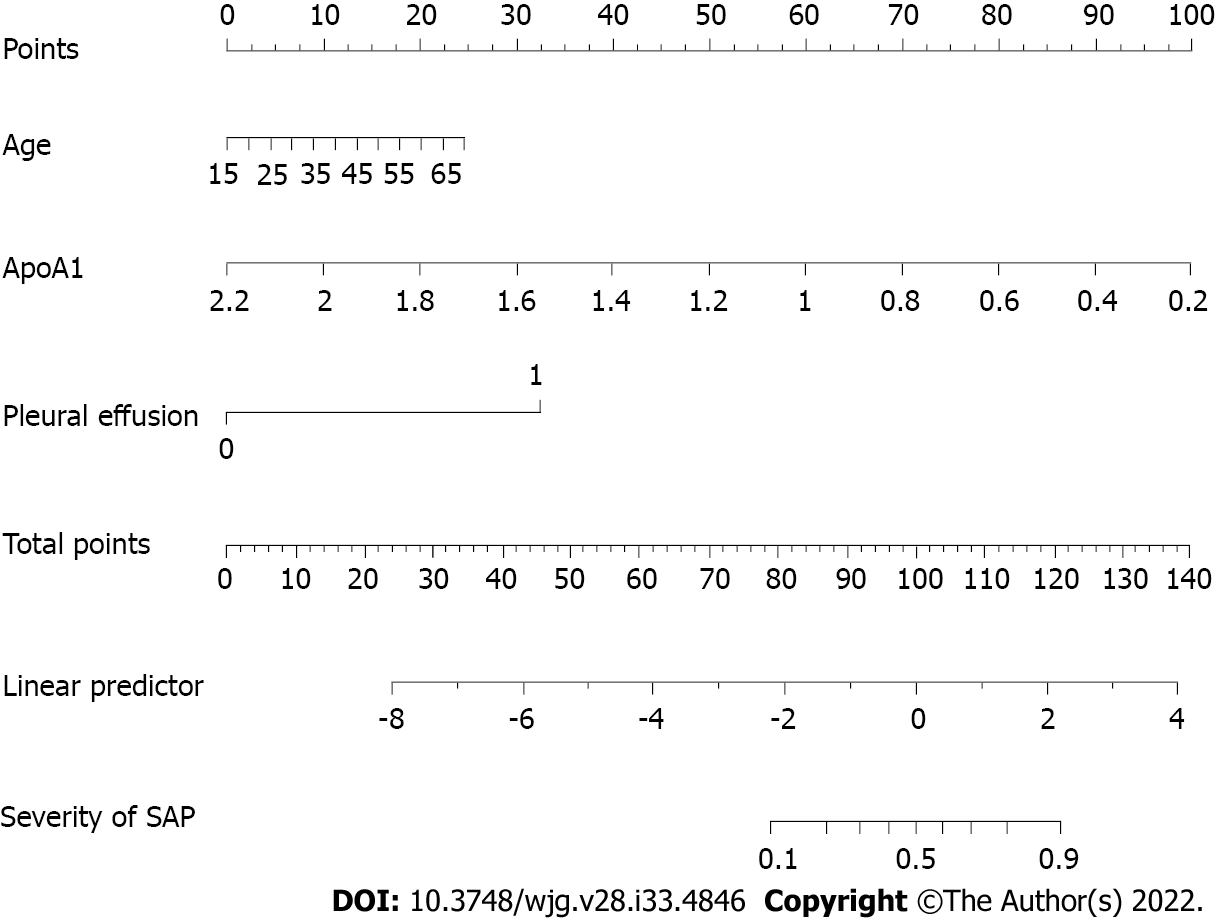
Figure 2 Nomogram for predicting severe acute pancreatitis for patients in the development cohort.
SAP: Severe acute pancreatitis.
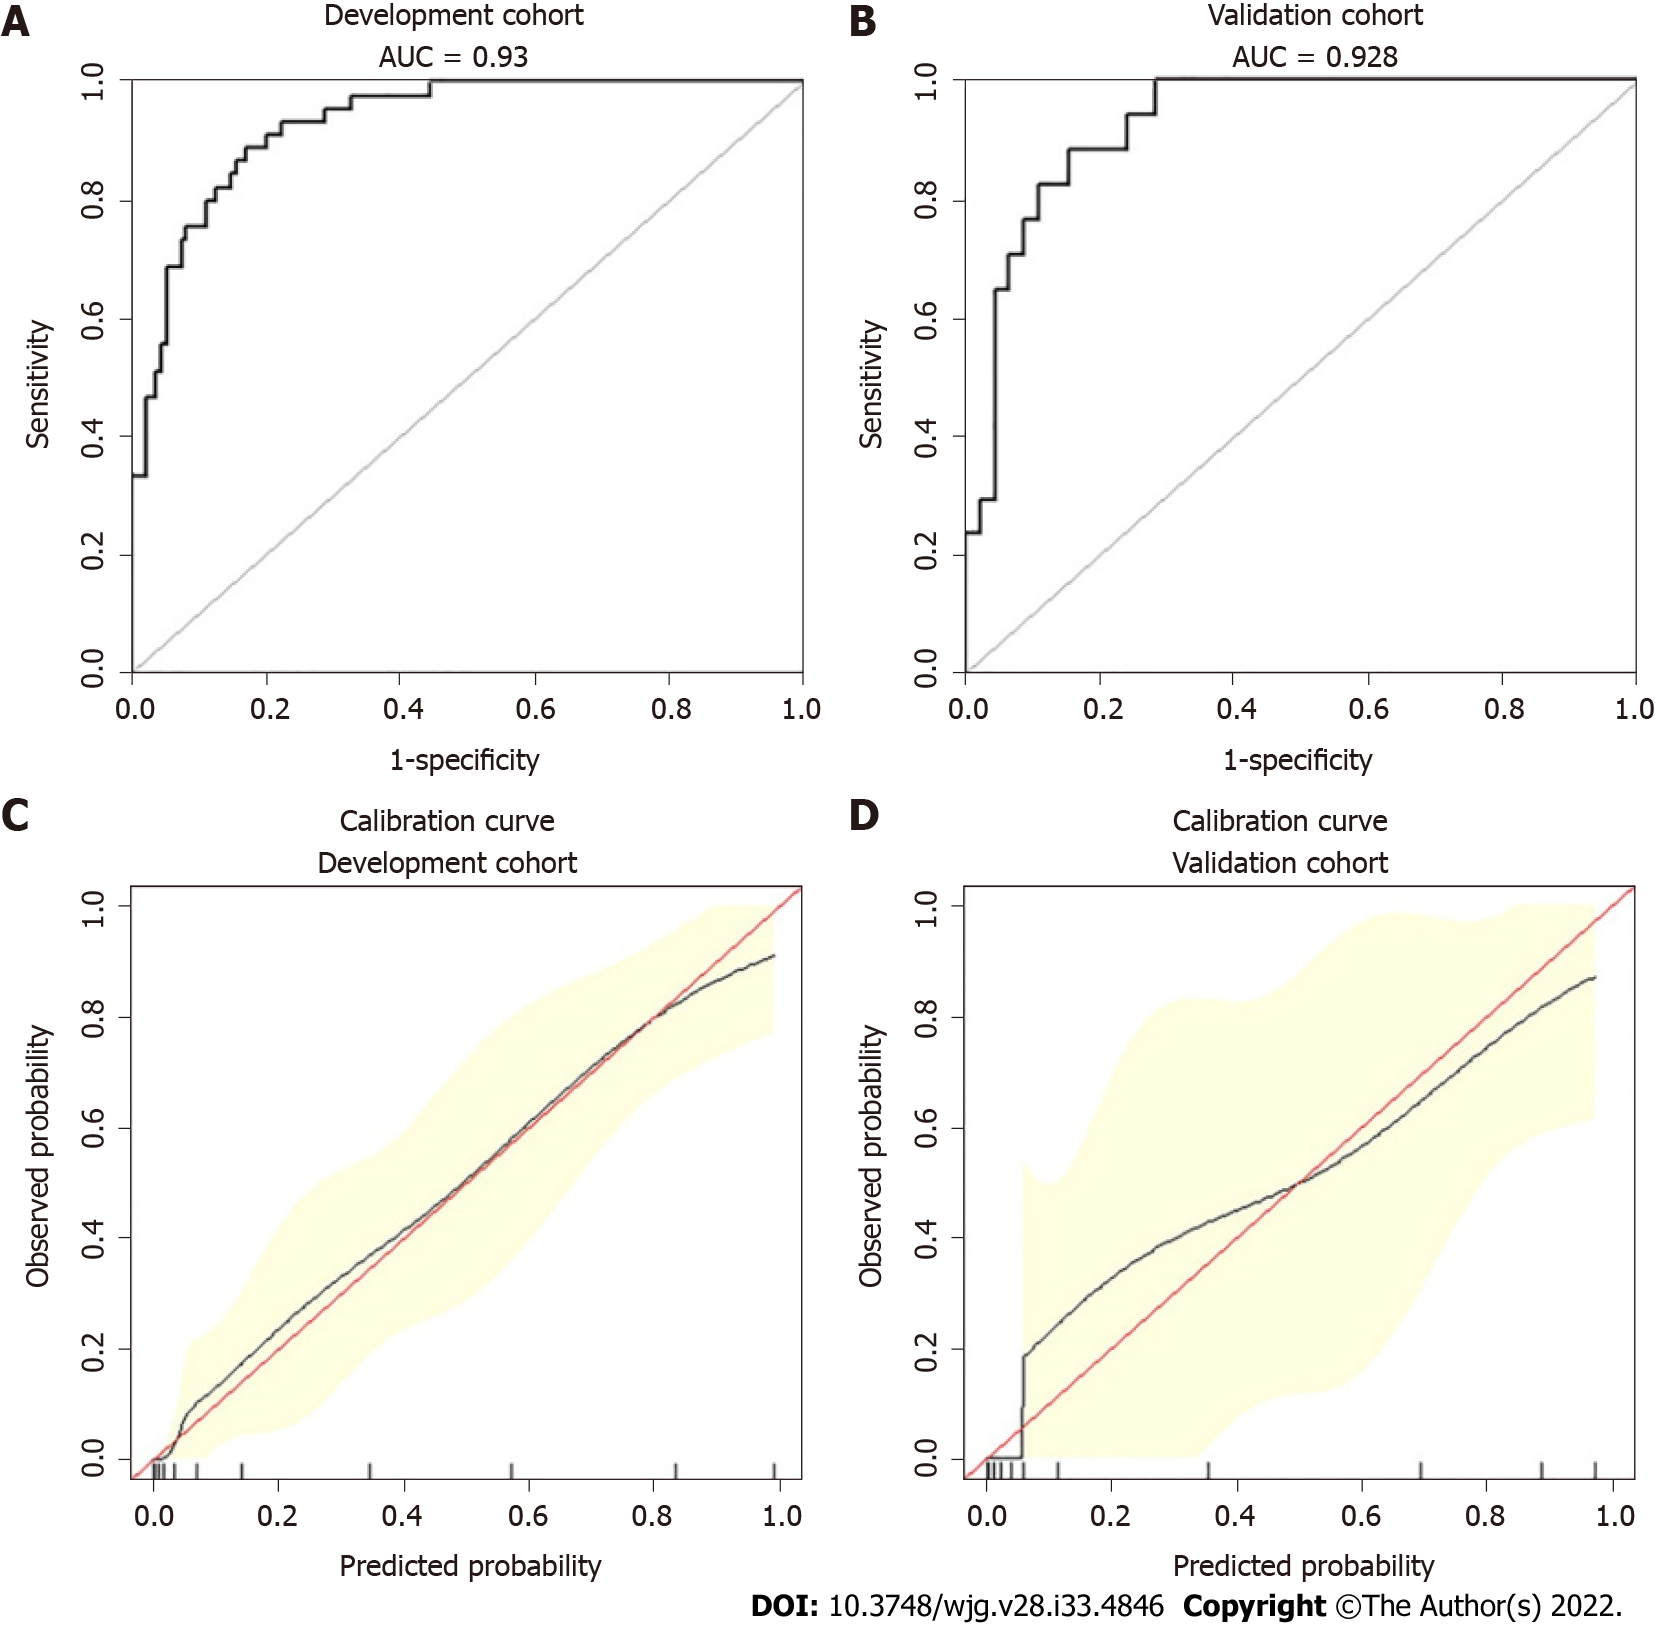
Figure 3 Receiver operating characteristic curves and calibration curves of the nomogram for predicting severe acute pancreatitis.
A: Receiver operating characteristic curves (AUCs) in the development group; B: AUC in the validation group; C: Calibrations of the nomogram for predicting severe acute pancreatitis (SAP) in the development group; D: Calibrations of the nomogram for predicting SAP in the validation group.
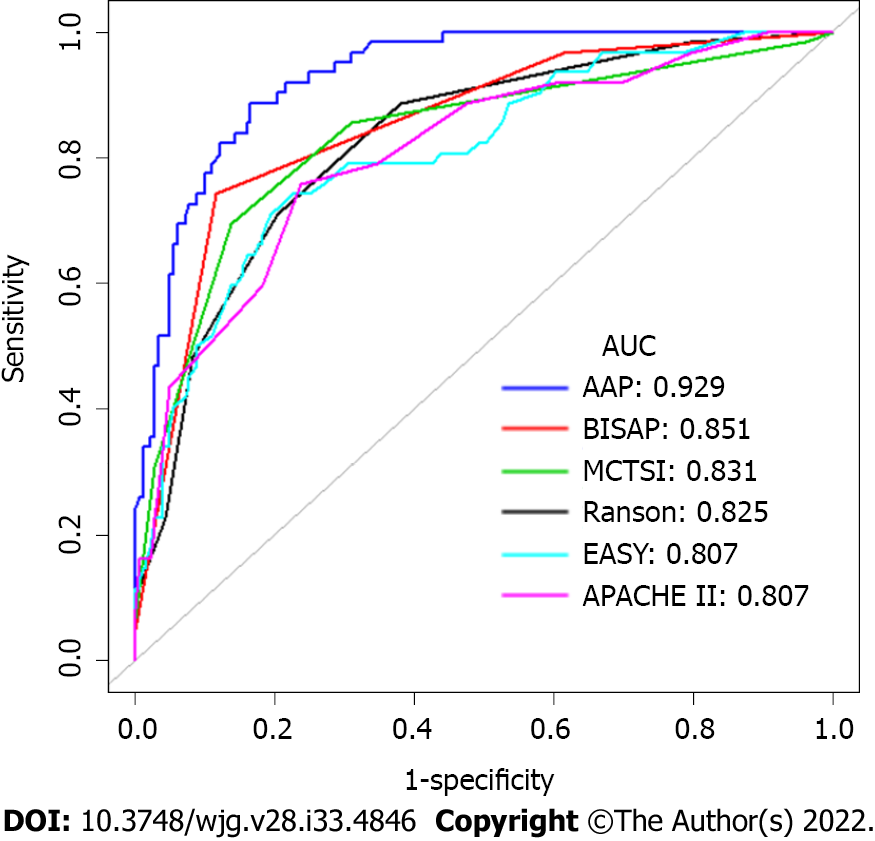
Figure 4 Receiver operating characteristic curves for the AAP and other existing clinical scoring systems, such as Bedside Index of Severity in acute pancreatitis, Ranson, Acute Physiology and Chronic Health Evaluation II), modified computed tomography severity index and early achievable severity index prediction scores.
AAP: Our risk prediction score referred to as AAP; EASY: The EASY prediction score is an artificial intelligence model for predicting the severity of acute pancreatitis.
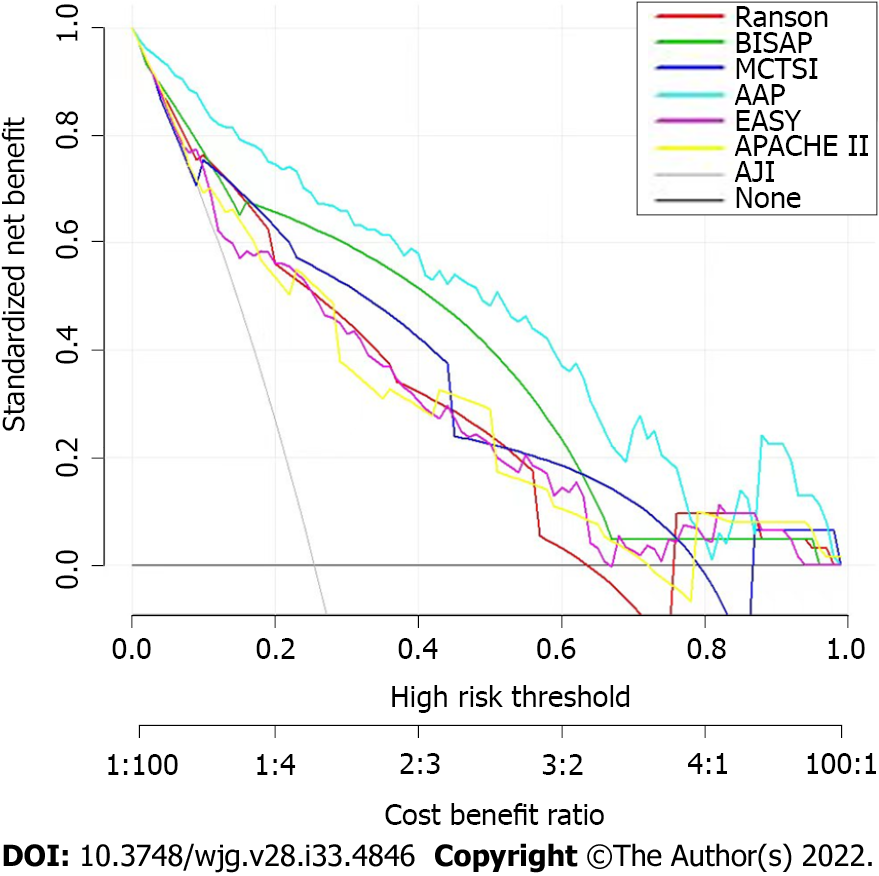
Figure 5 Decision curve analysis for the nomogram.
AAP: Our risk prediction score referred to as AAP; EASY: The EASY prediction score is an artificial intelligence model for predicting the severity of acute pancreatitis.
- Citation: Liu ZY, Tian L, Sun XY, Liu ZS, Hao LJ, Shen WW, Gao YQ, Zhai HH. Development and validation of a risk prediction score for the severity of acute hypertriglyceridemic pancreatitis in Chinese patients. World J Gastroenterol 2022; 28(33): 4846-4860
- URL: https://www.wjgnet.com/1007-9327/full/v28/i33/4846.htm
- DOI: https://dx.doi.org/10.3748/wjg.v28.i33.4846


