Copyright
©The Author(s) 2022.
World J Gastroenterol. Jan 21, 2022; 28(3): 348-364
Published online Jan 21, 2022. doi: 10.3748/wjg.v28.i3.348
Published online Jan 21, 2022. doi: 10.3748/wjg.v28.i3.348
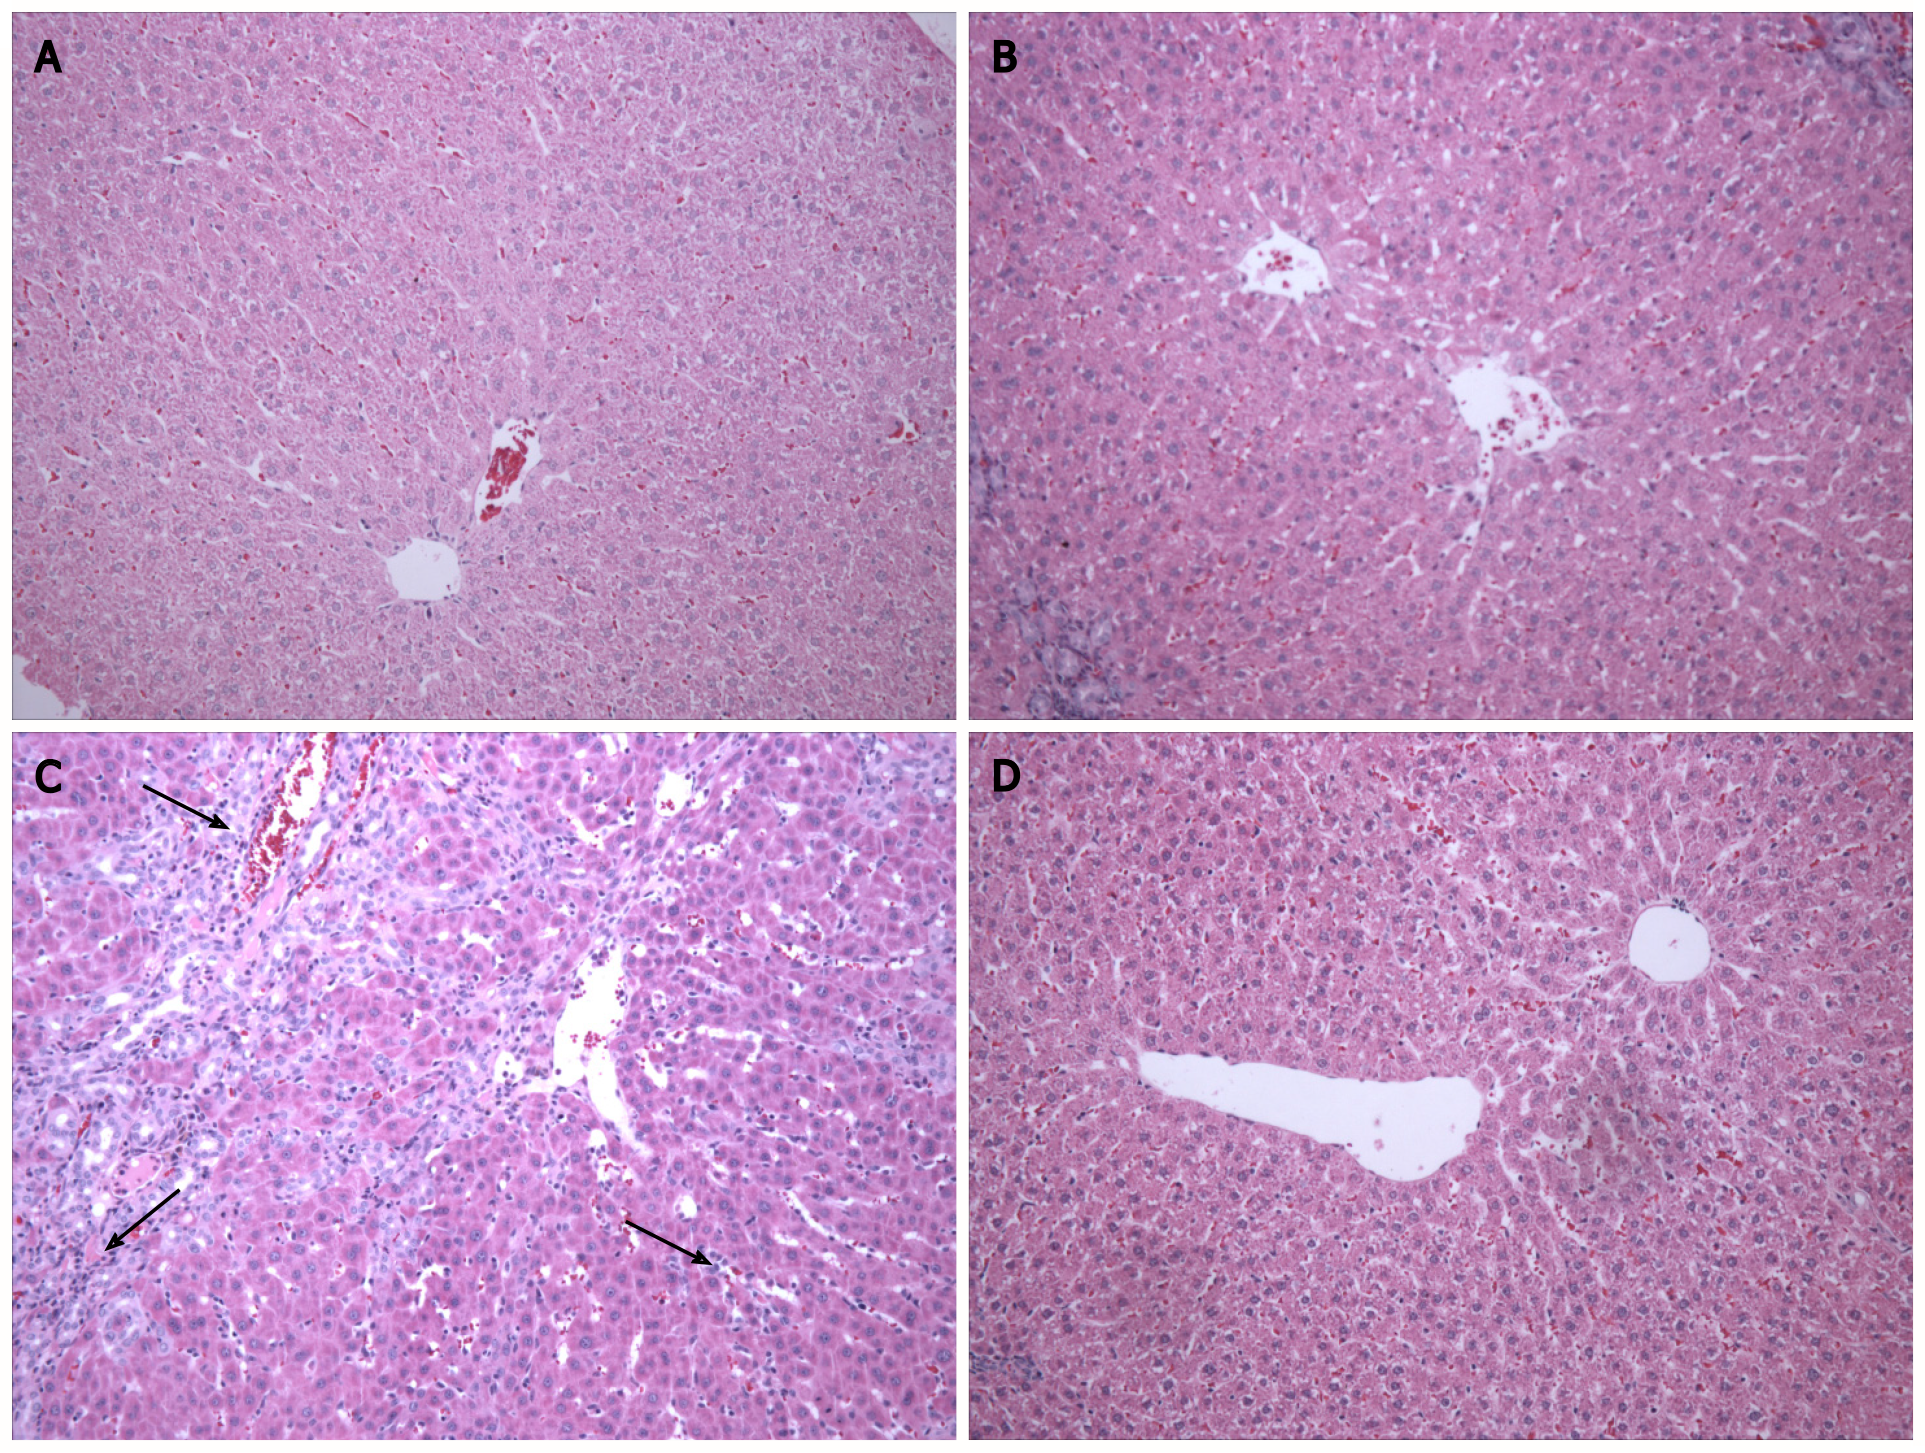
Figure 1 Photomicrograph of hepatic tissue at 200 × magnification in the different experimental groups.
The control (CO) and CO + melatonin (MLT) groups had normal liver parenchyma. There was inflammatory infiltrate (black arrows) and a change in the parenchyma in the bile duct ligation (BDL) group. Parenchymal restructuring occurred in the BDL + MLT group. A: CO; B: CO + MLT; C: BDL; D: BDL + MLT.
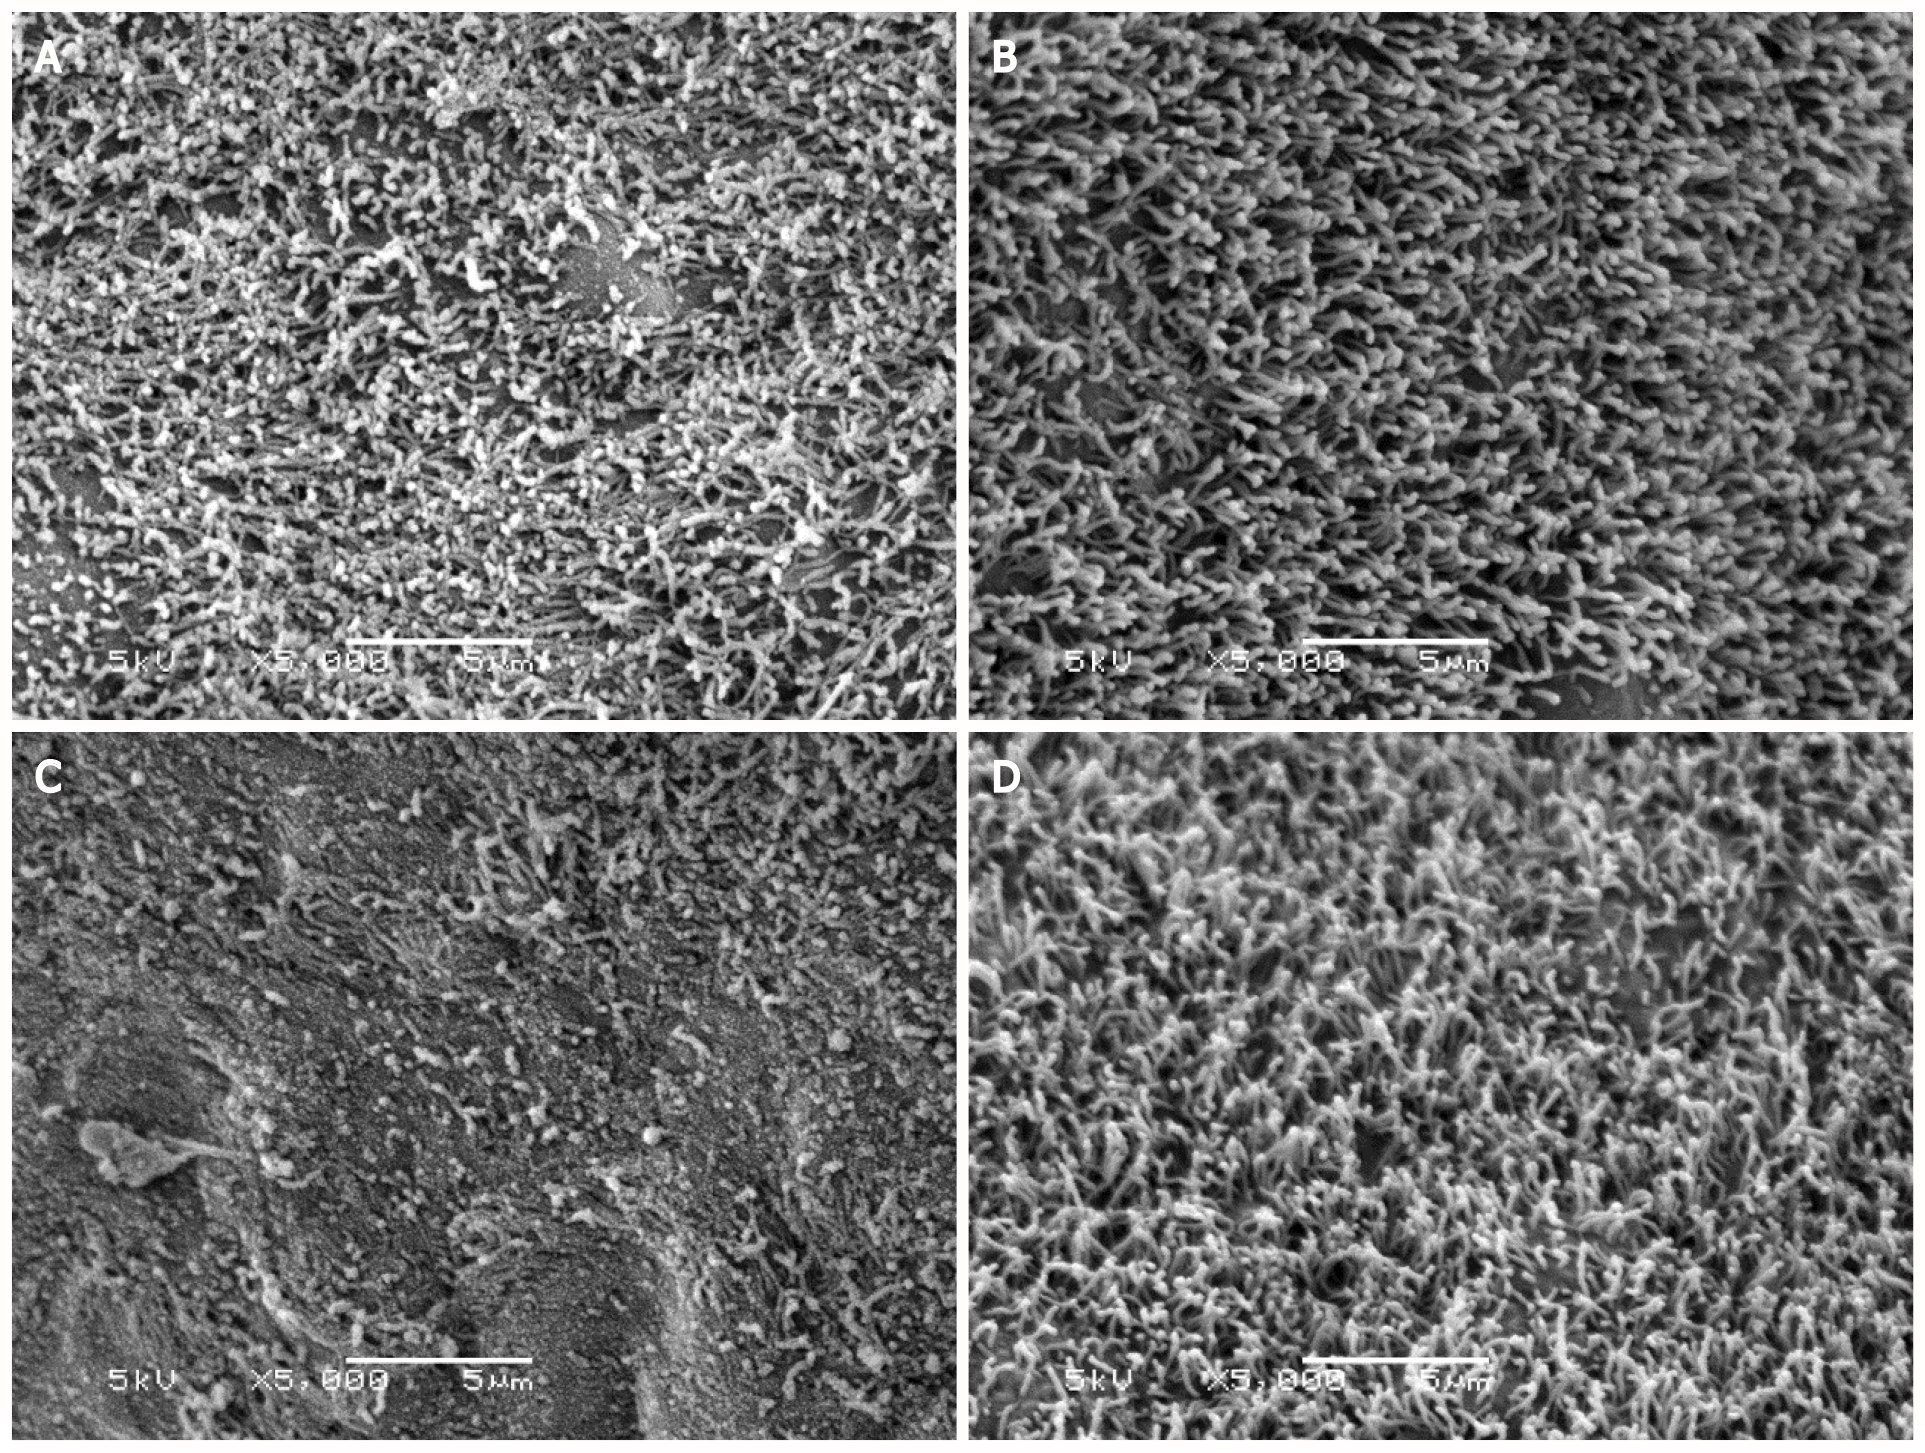
Figure 2 Morphological analysis by scanning electron microscopy of the liver of animals that underwent bile duct ligation surgery.
The control (CO) and CO + melatonin (MLT) groups showed an intact ciliated membrane covering the hepatocytes. This membrane is impaired in the bile duct ligation (BDL) group. In contrast, membrane restructuring was observed in the BDL + MLT group. A: CO; B: CO + MLT; C: BDL; D: BDL + MLT.
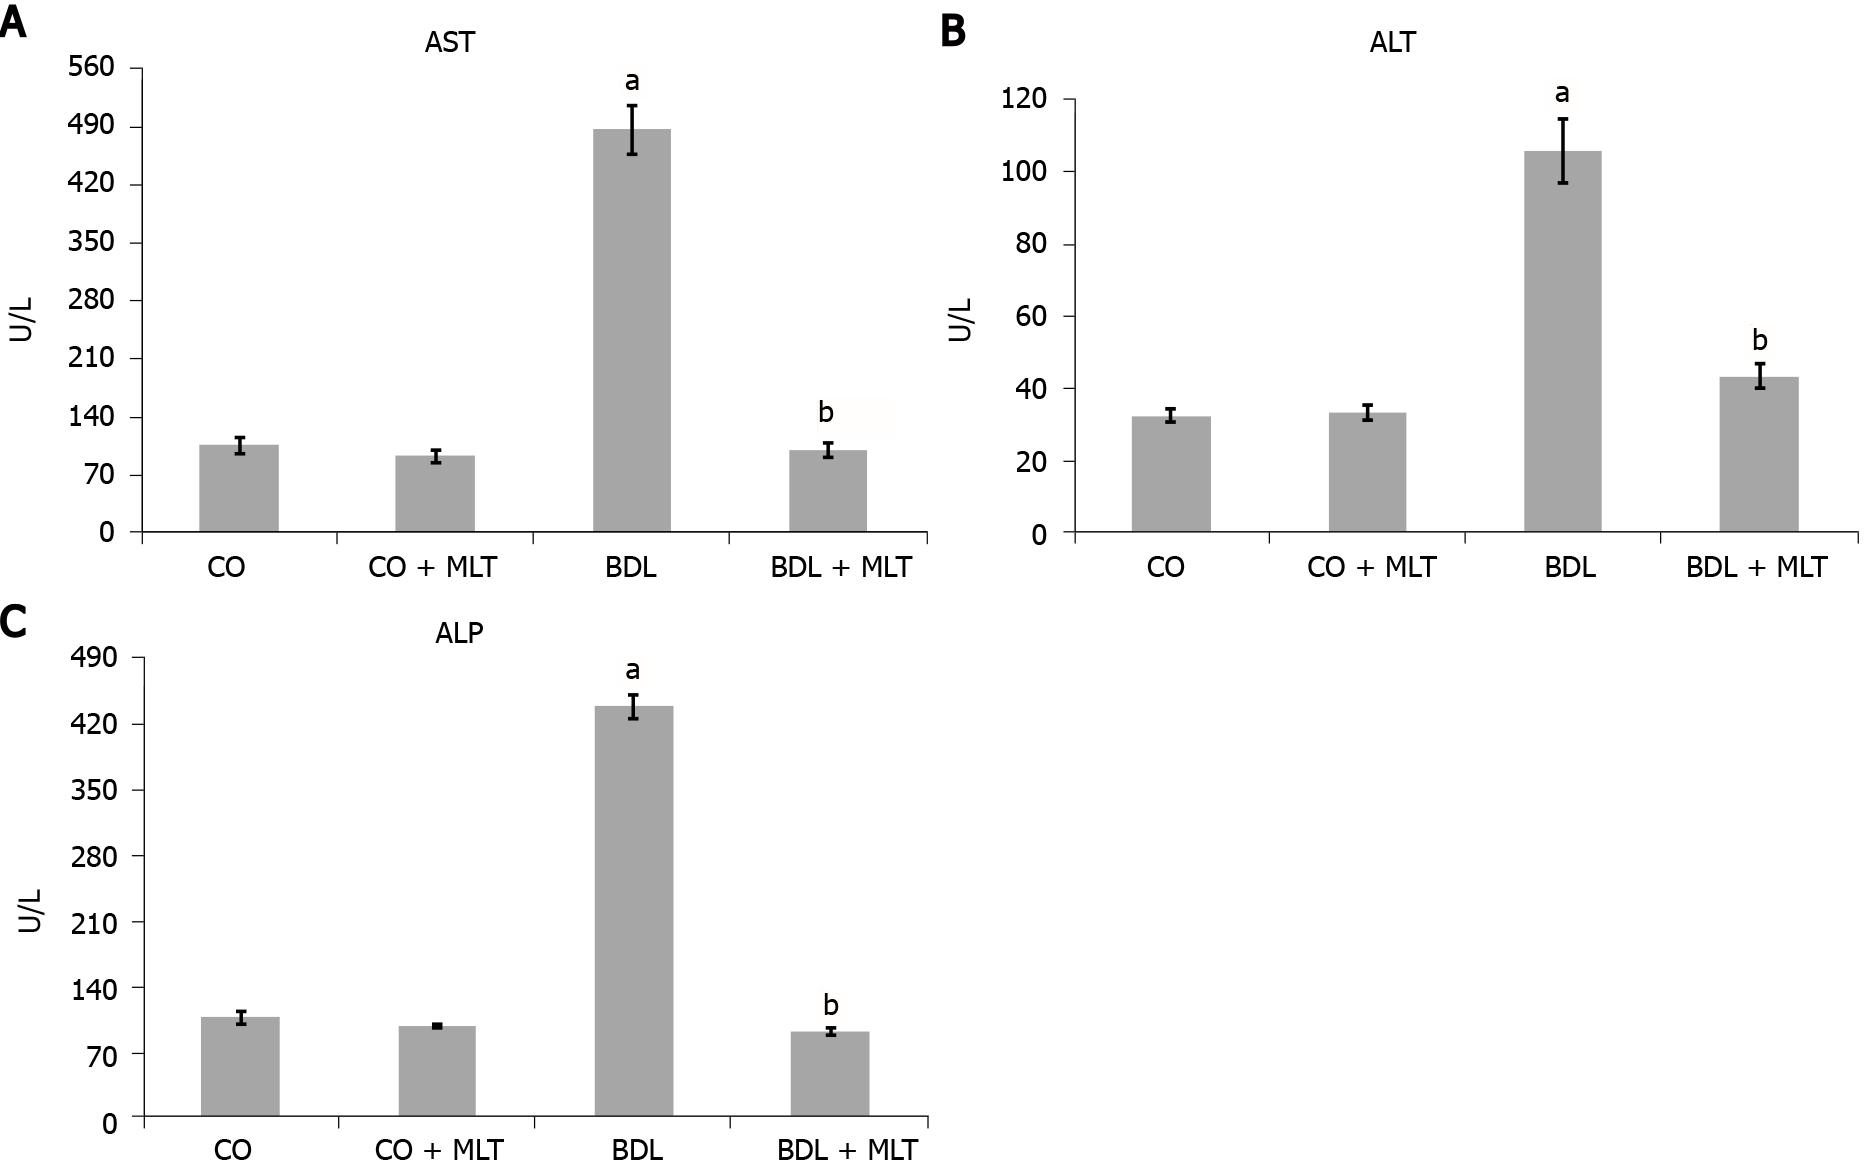
Figure 3 The effect of melatonin on the activity of liver enzymes aspartate aminotransferase, alanine aminotransferase, and alkaline phosphatase (alkaline phosphatase) in the plasma of animals that underwent bile duct ligation surgery.
The data are expressed as the mean ± standard error of the mean. Significant increase in relation to the control (CO) and the CO + melatonin (MLT) groups (aP < 0.001). Significant decrease in the bile duct ligation (BDL) group in relation to the BDL + MLT group (bP < 0.001). A: AST; B: ALT; C: ALP.
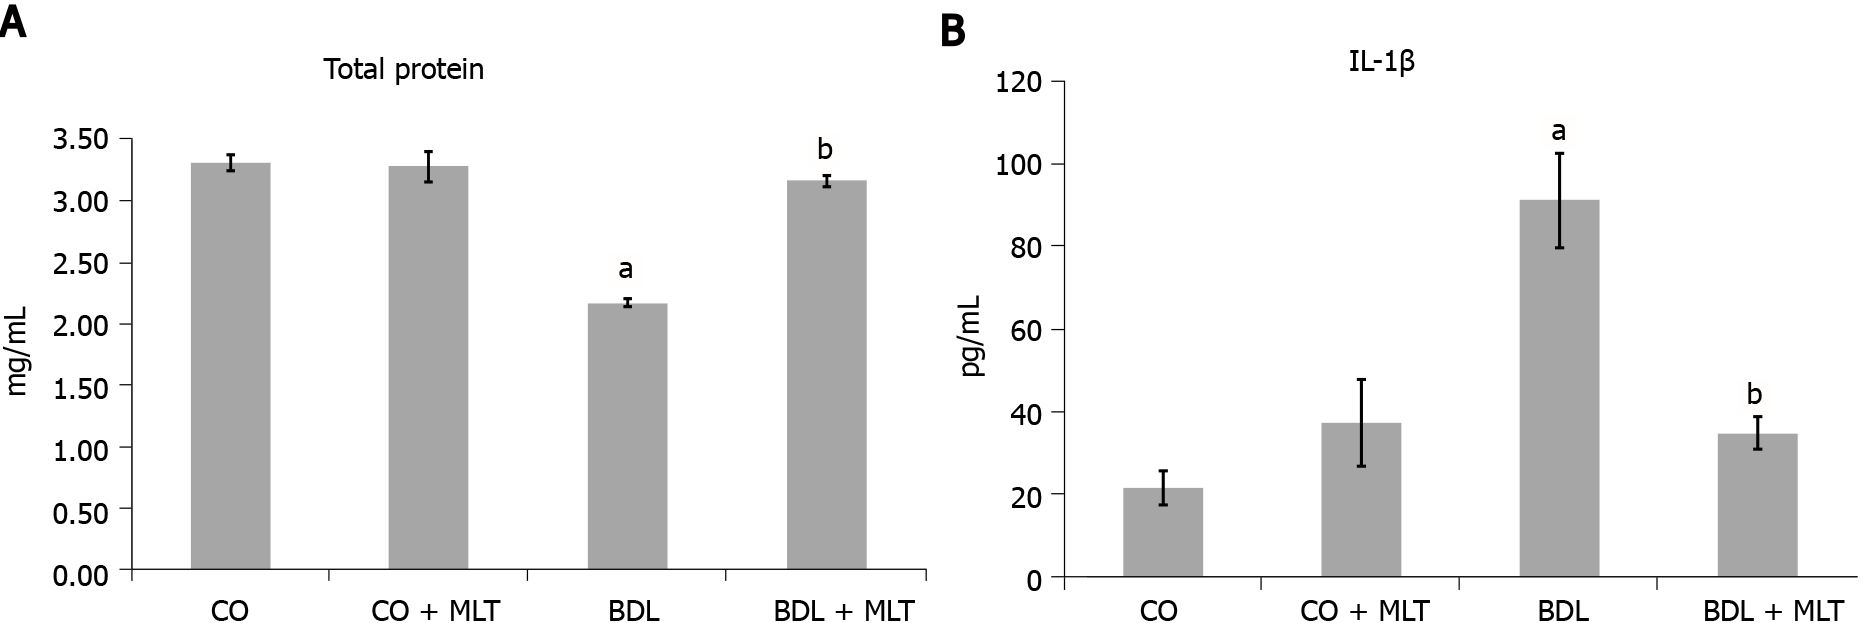
Figure 4 The effect of melatonin on total protein levels and interleukin IL-1β levels in the liver of animals that underwent bile duct ligation surgery.
The data are expressed as the mean ± standard error of the mean. Significant decrease/increase in the bile duct ligation (BDL) group in relation to the control (CO) and the CO + melatonin (MLT) groups (aP < 0.001). Significant increase in the BDL + MLT group in relation to the BDL group (bP < 0.001). A: Total protein; B: IL-1β.
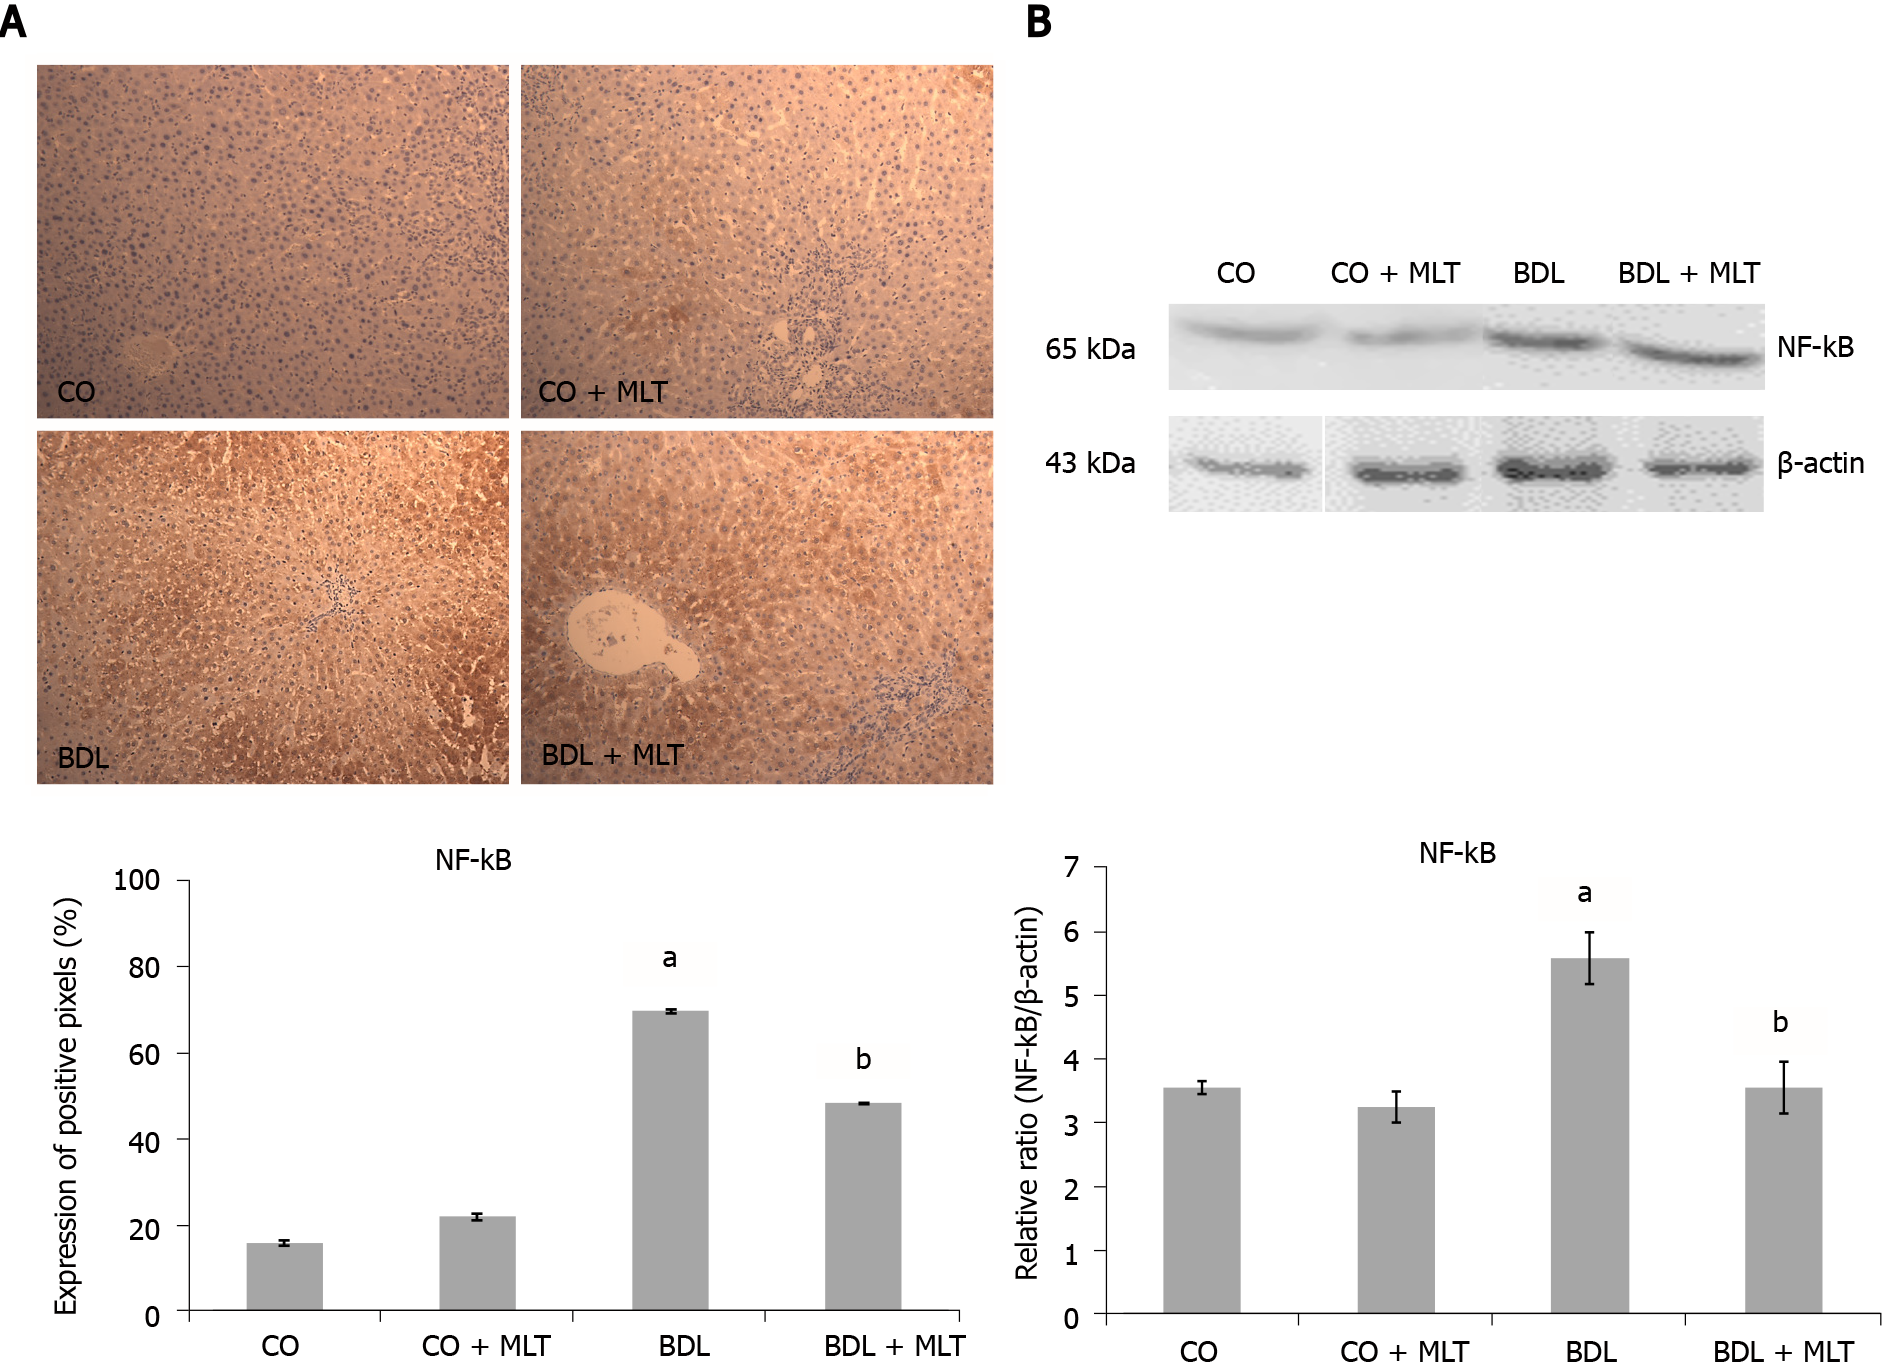
Figure 5 The effect of melatonin on the quantification of immunohistochemistry analysis and the expression of NF-kB with the Western blot technique in the livers of animals that underwent bile duct ligation surgery.
The data are expressed as mean ± standard error of the mean. Significant increase in the bile duct ligation (BDL) group in relation to the control (CO) and CO + melatonin (MLT) groups (aP < 0.001). Significant decrease in the BDL + MLT group in relation to the BDL group (bP < 0.001); A: Expression of positive pixels; B: Relative ratio (NF-kB/β-actin).
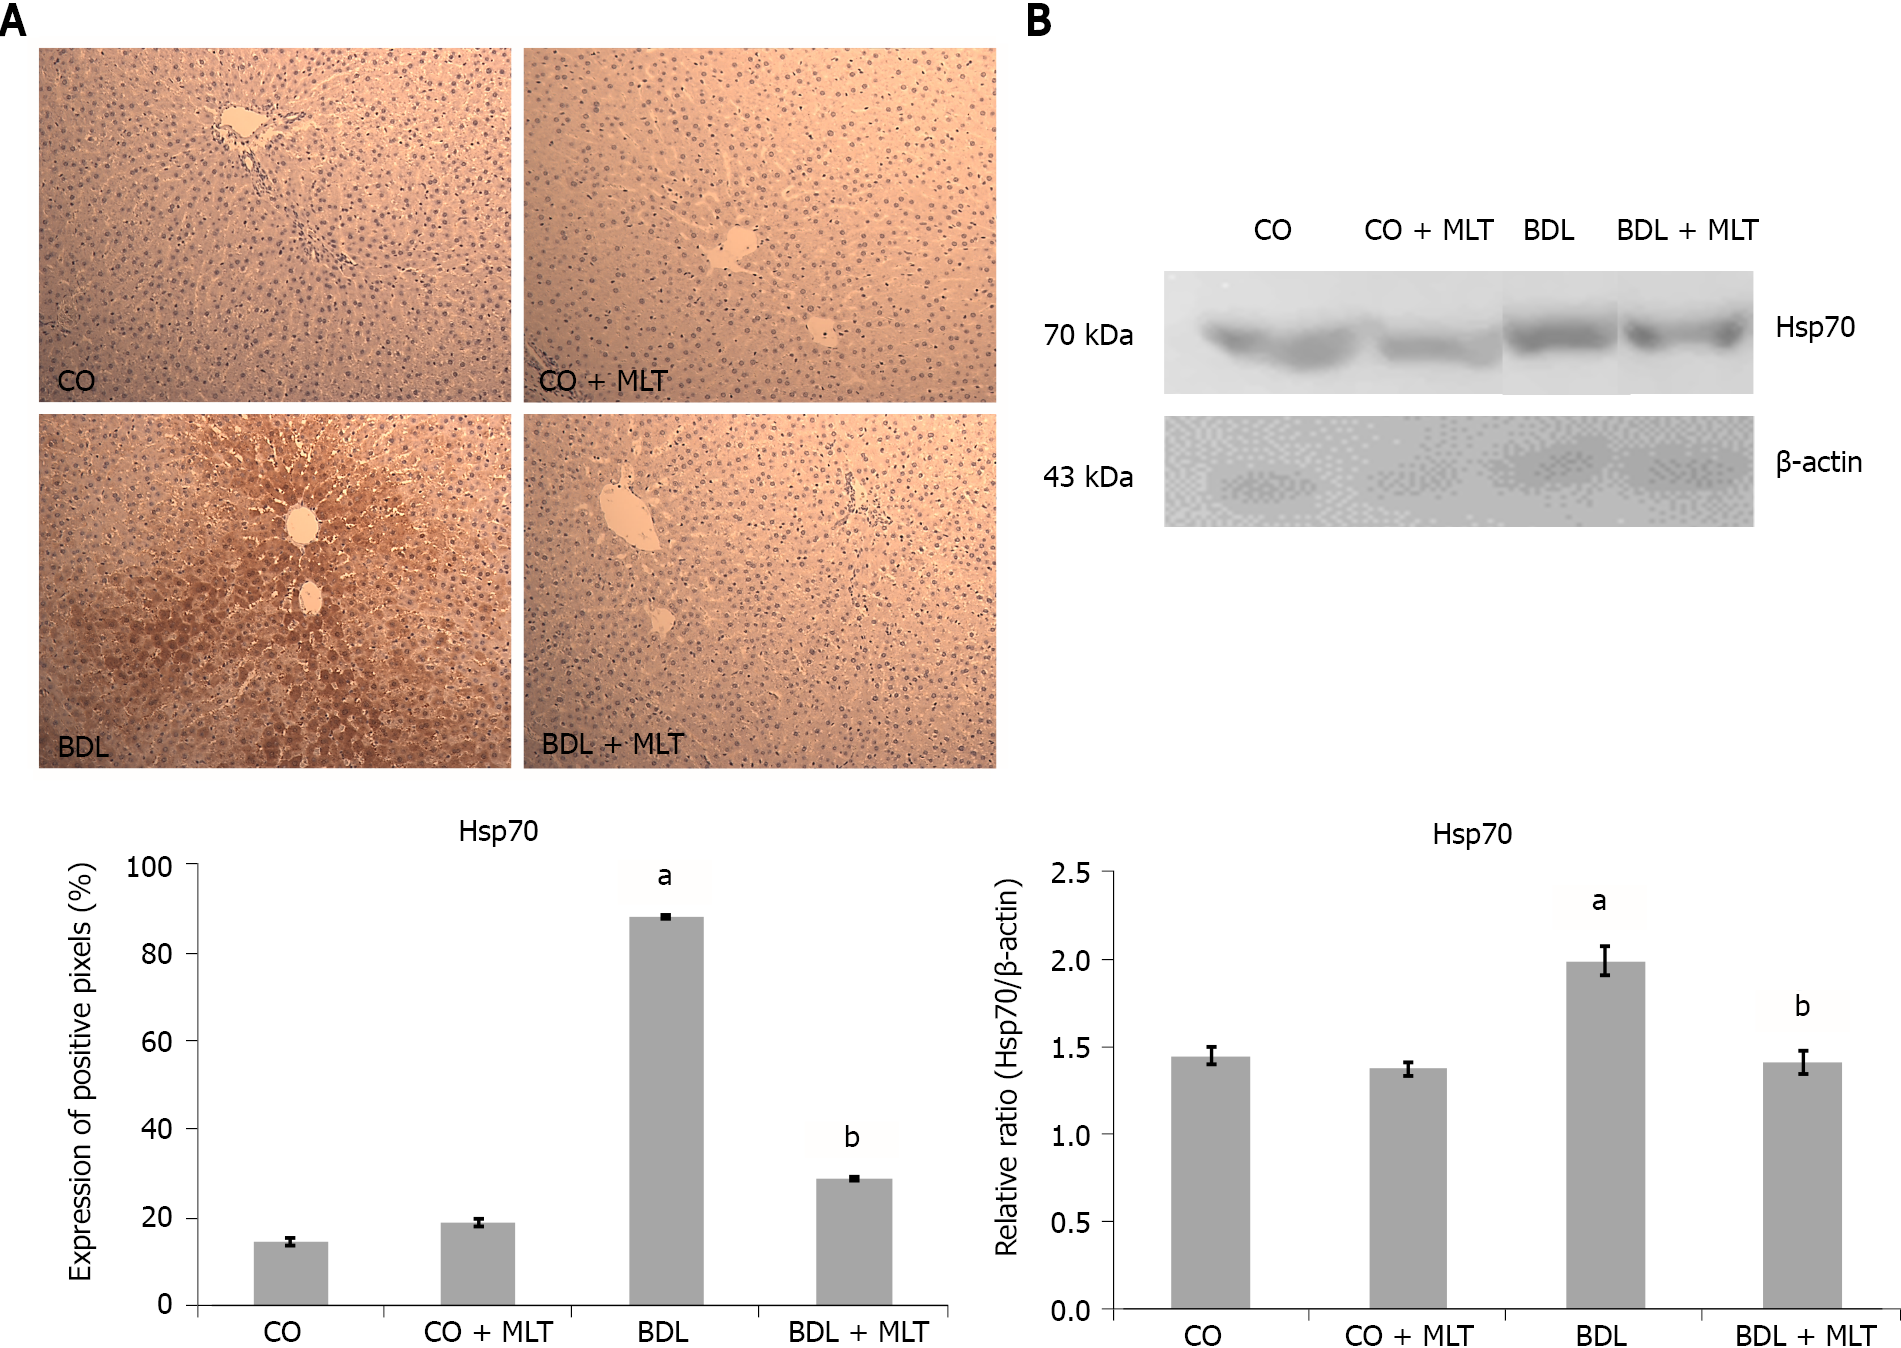
Figure 6 The effect of melatonin on immunohistochemistry and Hsp70 expression with the Western blot technique in the liver of animals that underwent bile duct ligation surgery.
The data are expressed as the mean ± standard error of the mean. Significant increase in the bile duct ligation (BDL) group in relation to the control (CO) and CO + melatonin (MLT) groups (aP < 0.001). Significant decrease in the BDL + MLT group in relation to the BDL group (bP < 0.001). A: The effect of melatonin on immunohistochemistry; B: Hsp70 expression with the Western blot technique.
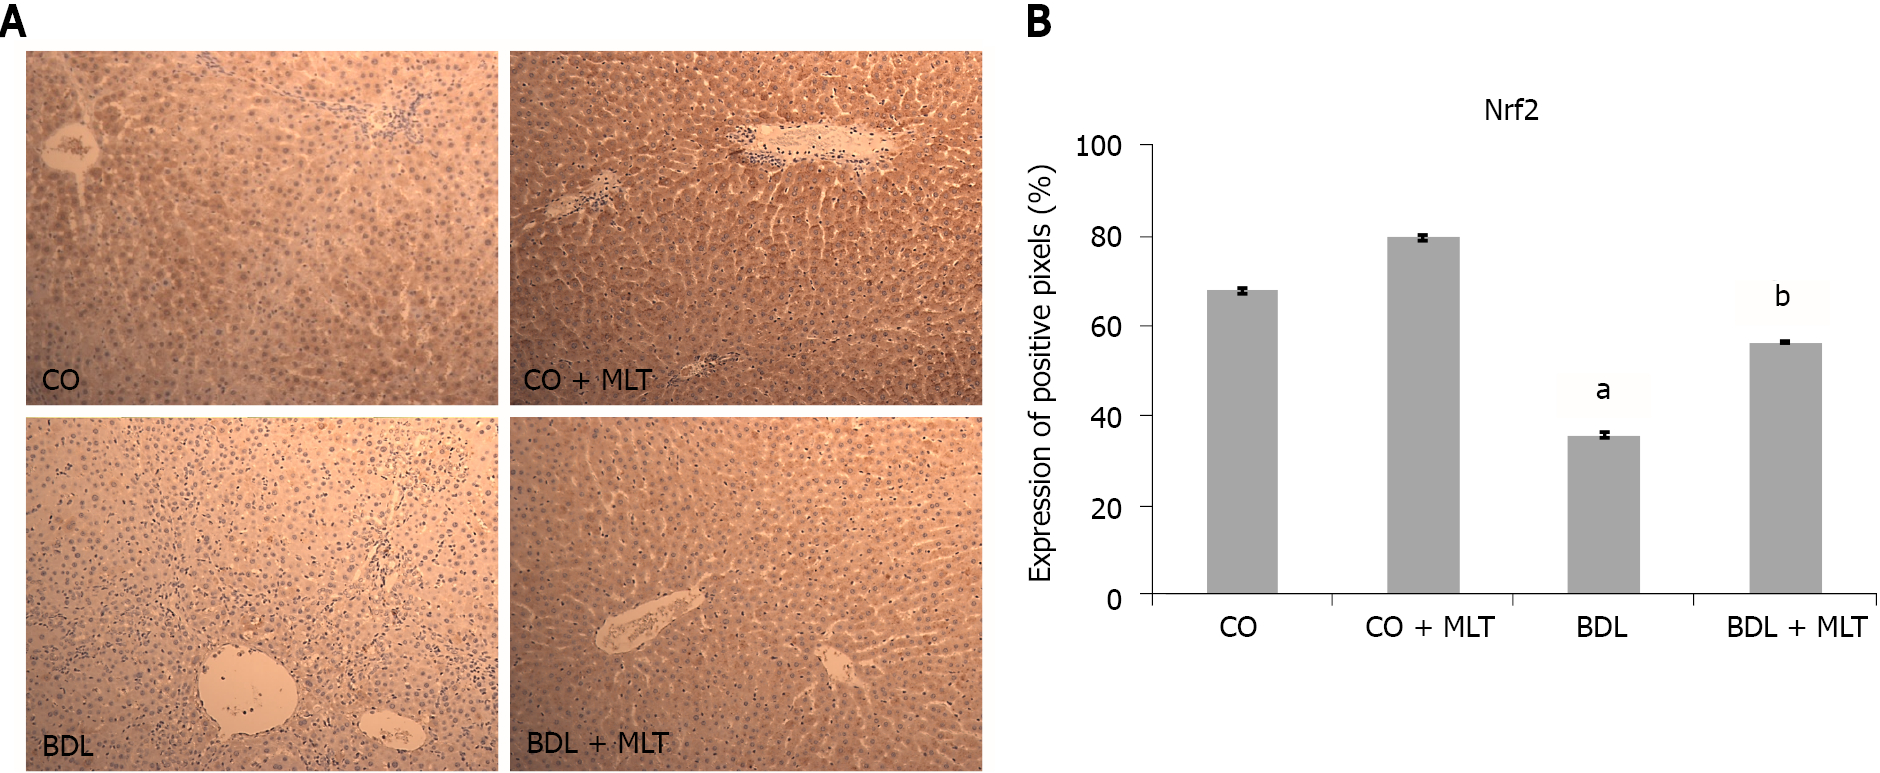
Figure 7 The effect of melatonin on Nrf2 immunohistochemistry in the liver of animals that underwent bile duct ligation surgery.
The data are expressed as the mean ± standard error of the mean. A: Express the situation; B: Significant decrease in the bile duct ligation (BDL) group in relation to the control (CO) and CO + melatonin (MLT) groups (aP < 0.001). Significant increase in the BDL + MLT group in relation to the BDL group (bP < 0.001).
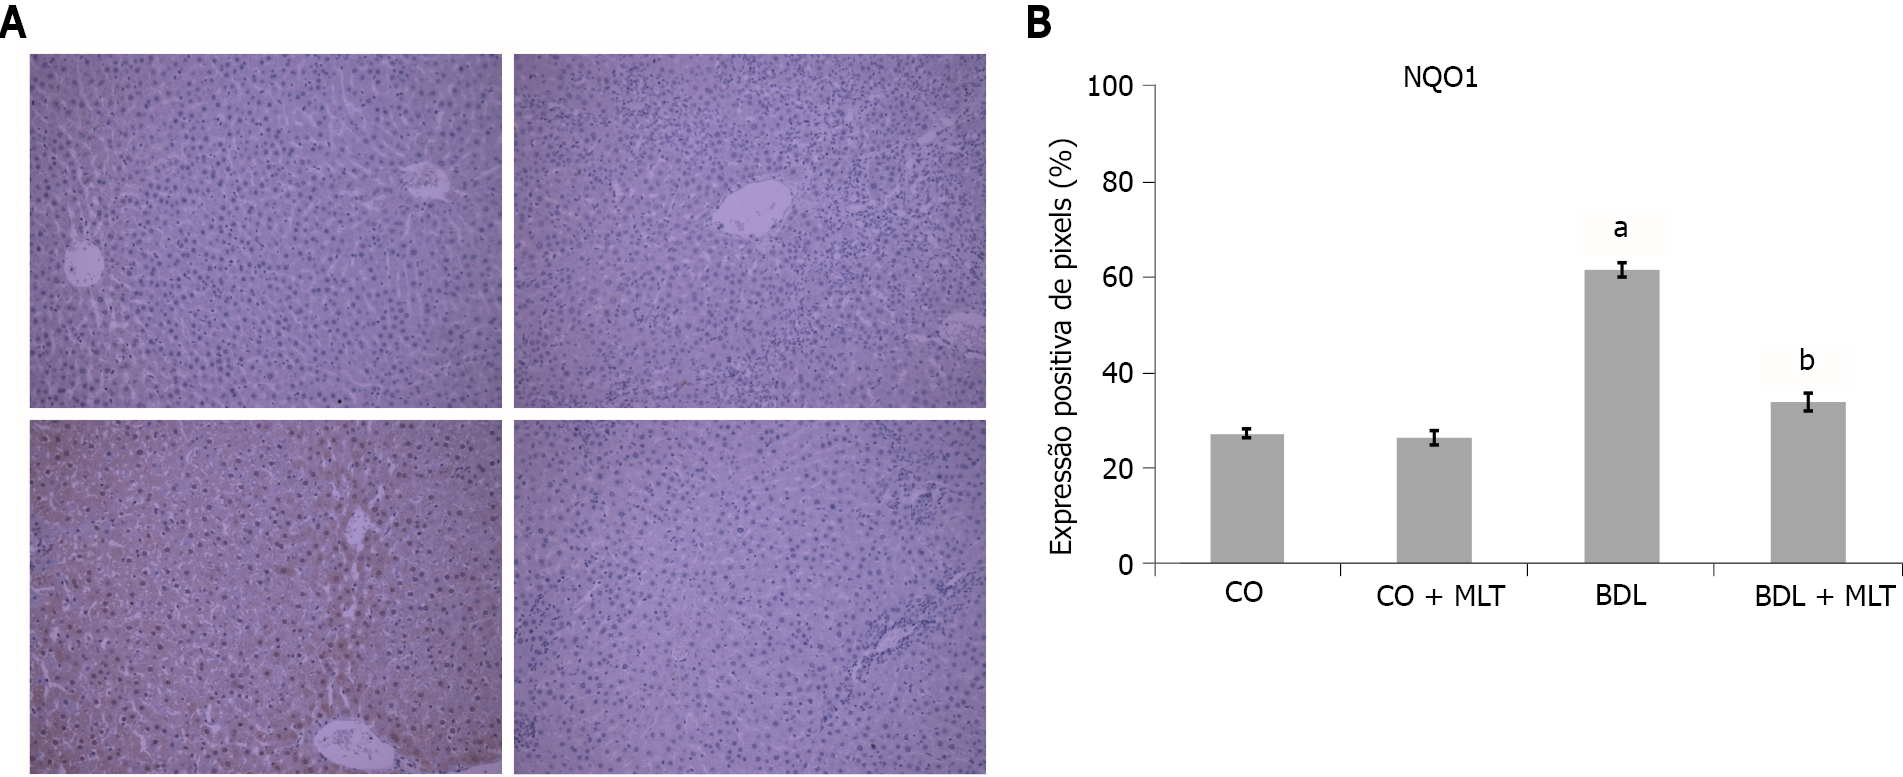
Figure 8 The effect of melatonin on quantification of NQO1 immunohistochemistry in the liver of animals that underwent bile duct ligation surgery.
The data are expressed as mean ± standard error of the mean. A: Express the situation; B: Significant increase in the bile duct ligation (BDL) group in relation to the control (CO) and CO + melatonin (MLT) groups (aP < 0.001). Significant decrease in the BDL + MLT group in relation to the BDL group (bP < 0.001).
- Citation: Colares JR, Hartmann RM, Schemitt EG, Fonseca SRB, Brasil MS, Picada JN, Dias AS, Bueno AF, Marroni CA, Marroni NP. Melatonin prevents oxidative stress, inflammatory activity, and DNA damage in cirrhotic rats. World J Gastroenterol 2022; 28(3): 348-364
- URL: https://www.wjgnet.com/1007-9327/full/v28/i3/348.htm
- DOI: https://dx.doi.org/10.3748/wjg.v28.i3.348


