Copyright
©The Author(s) 2022.
World J Gastroenterol. Jun 28, 2022; 28(24): 2705-2732
Published online Jun 28, 2022. doi: 10.3748/wjg.v28.i24.2705
Published online Jun 28, 2022. doi: 10.3748/wjg.v28.i24.2705
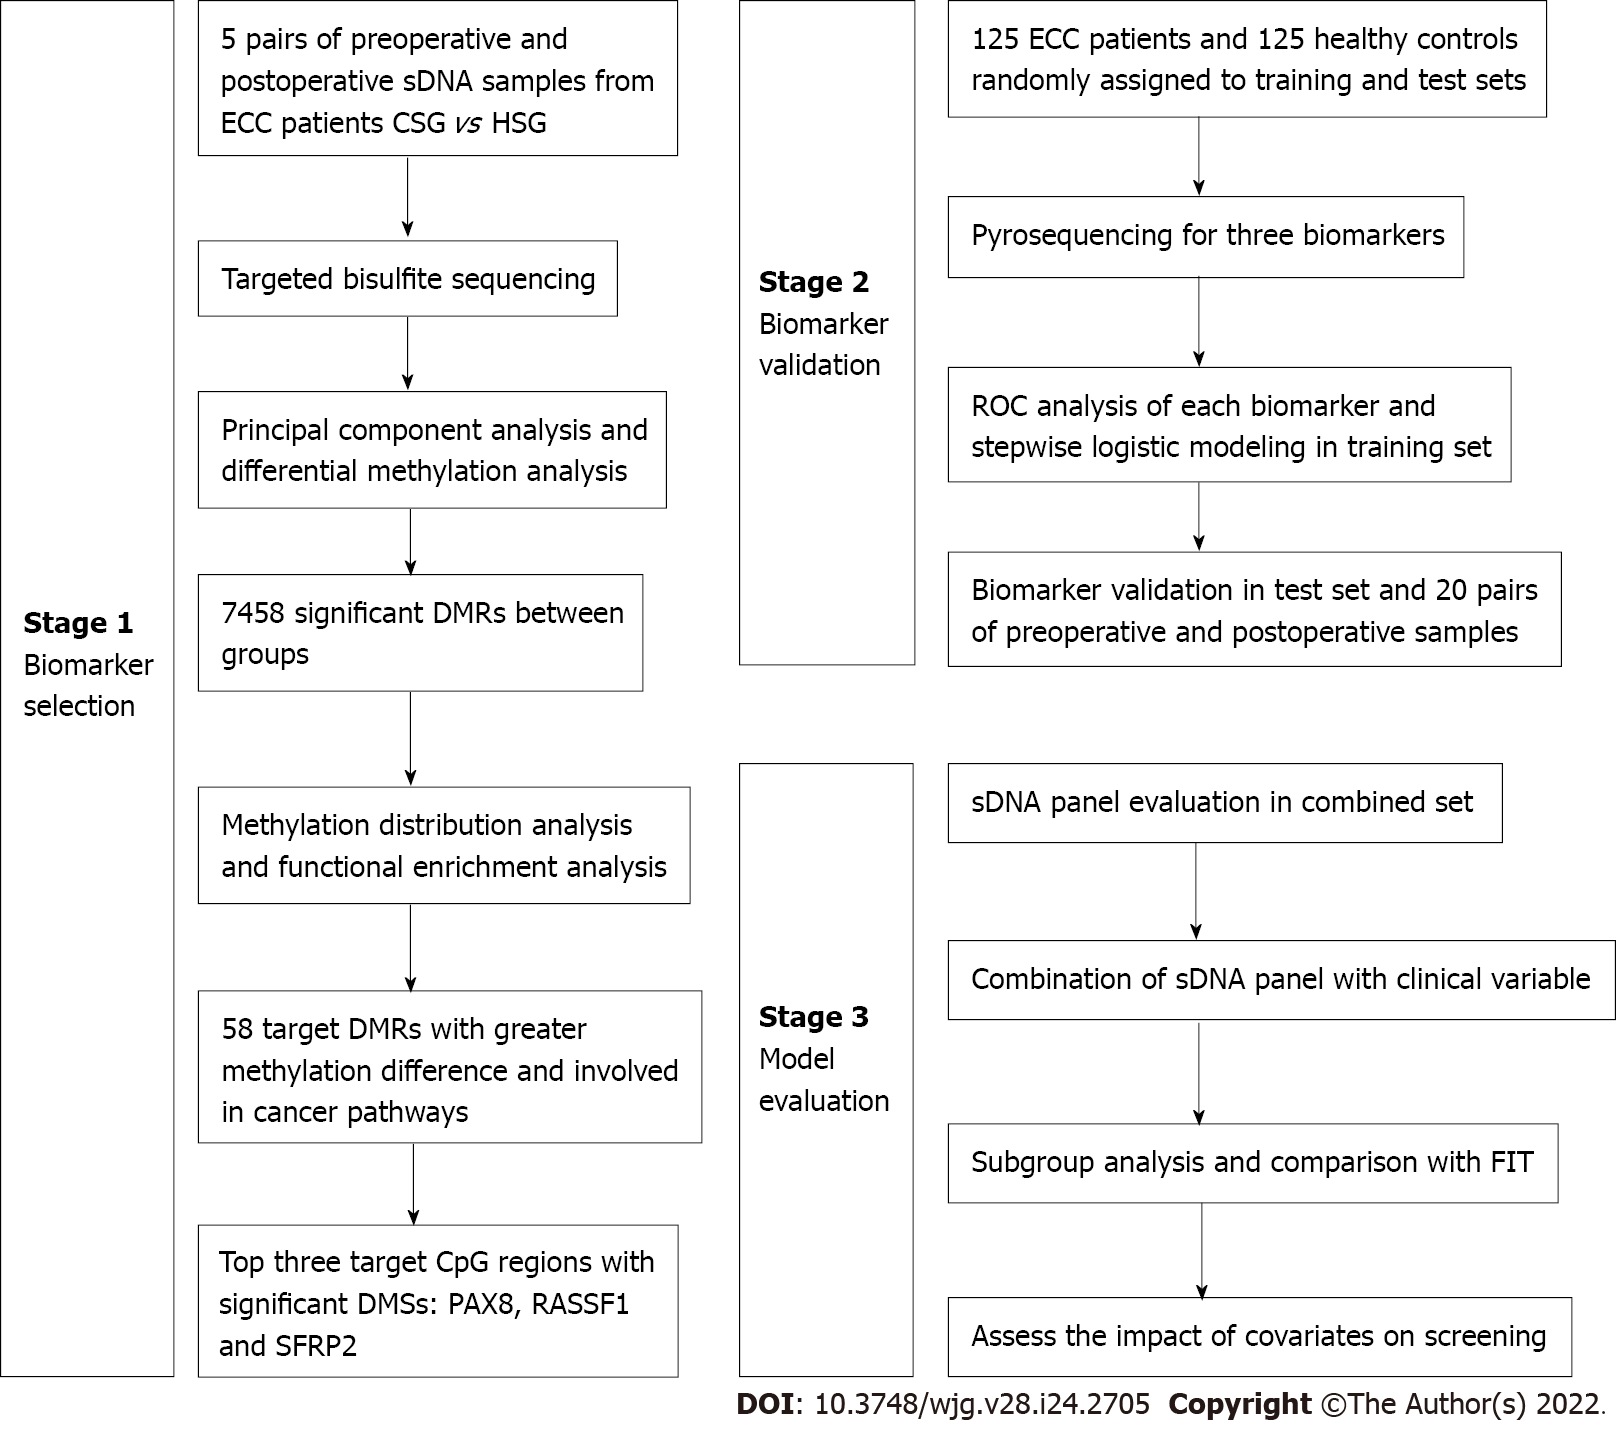
Figure 1 Flow diagram of the study design.
Candidate methylation biomarkers were selected by targeted bisulfite sequencing and then validated using pyrosequencing. At last, a diagnostic model was constructed and evaluated. CSG: Cancer sample group; HSG: Healthy sample group; DMRs: Differentially methylated regions; DMSs: Differentially methylated sites; ROC: Receiver operating characteristic; sDNA: Stool DNA; FIT: Fecal immunochemical test; PAX8: Paired box 8; RASSF1: Ras-association domain family 1; SFRP2: Secreted frizzled-related protein 2; CpG: Cytosine-guanine; ECC: Early-stage colon cancer.
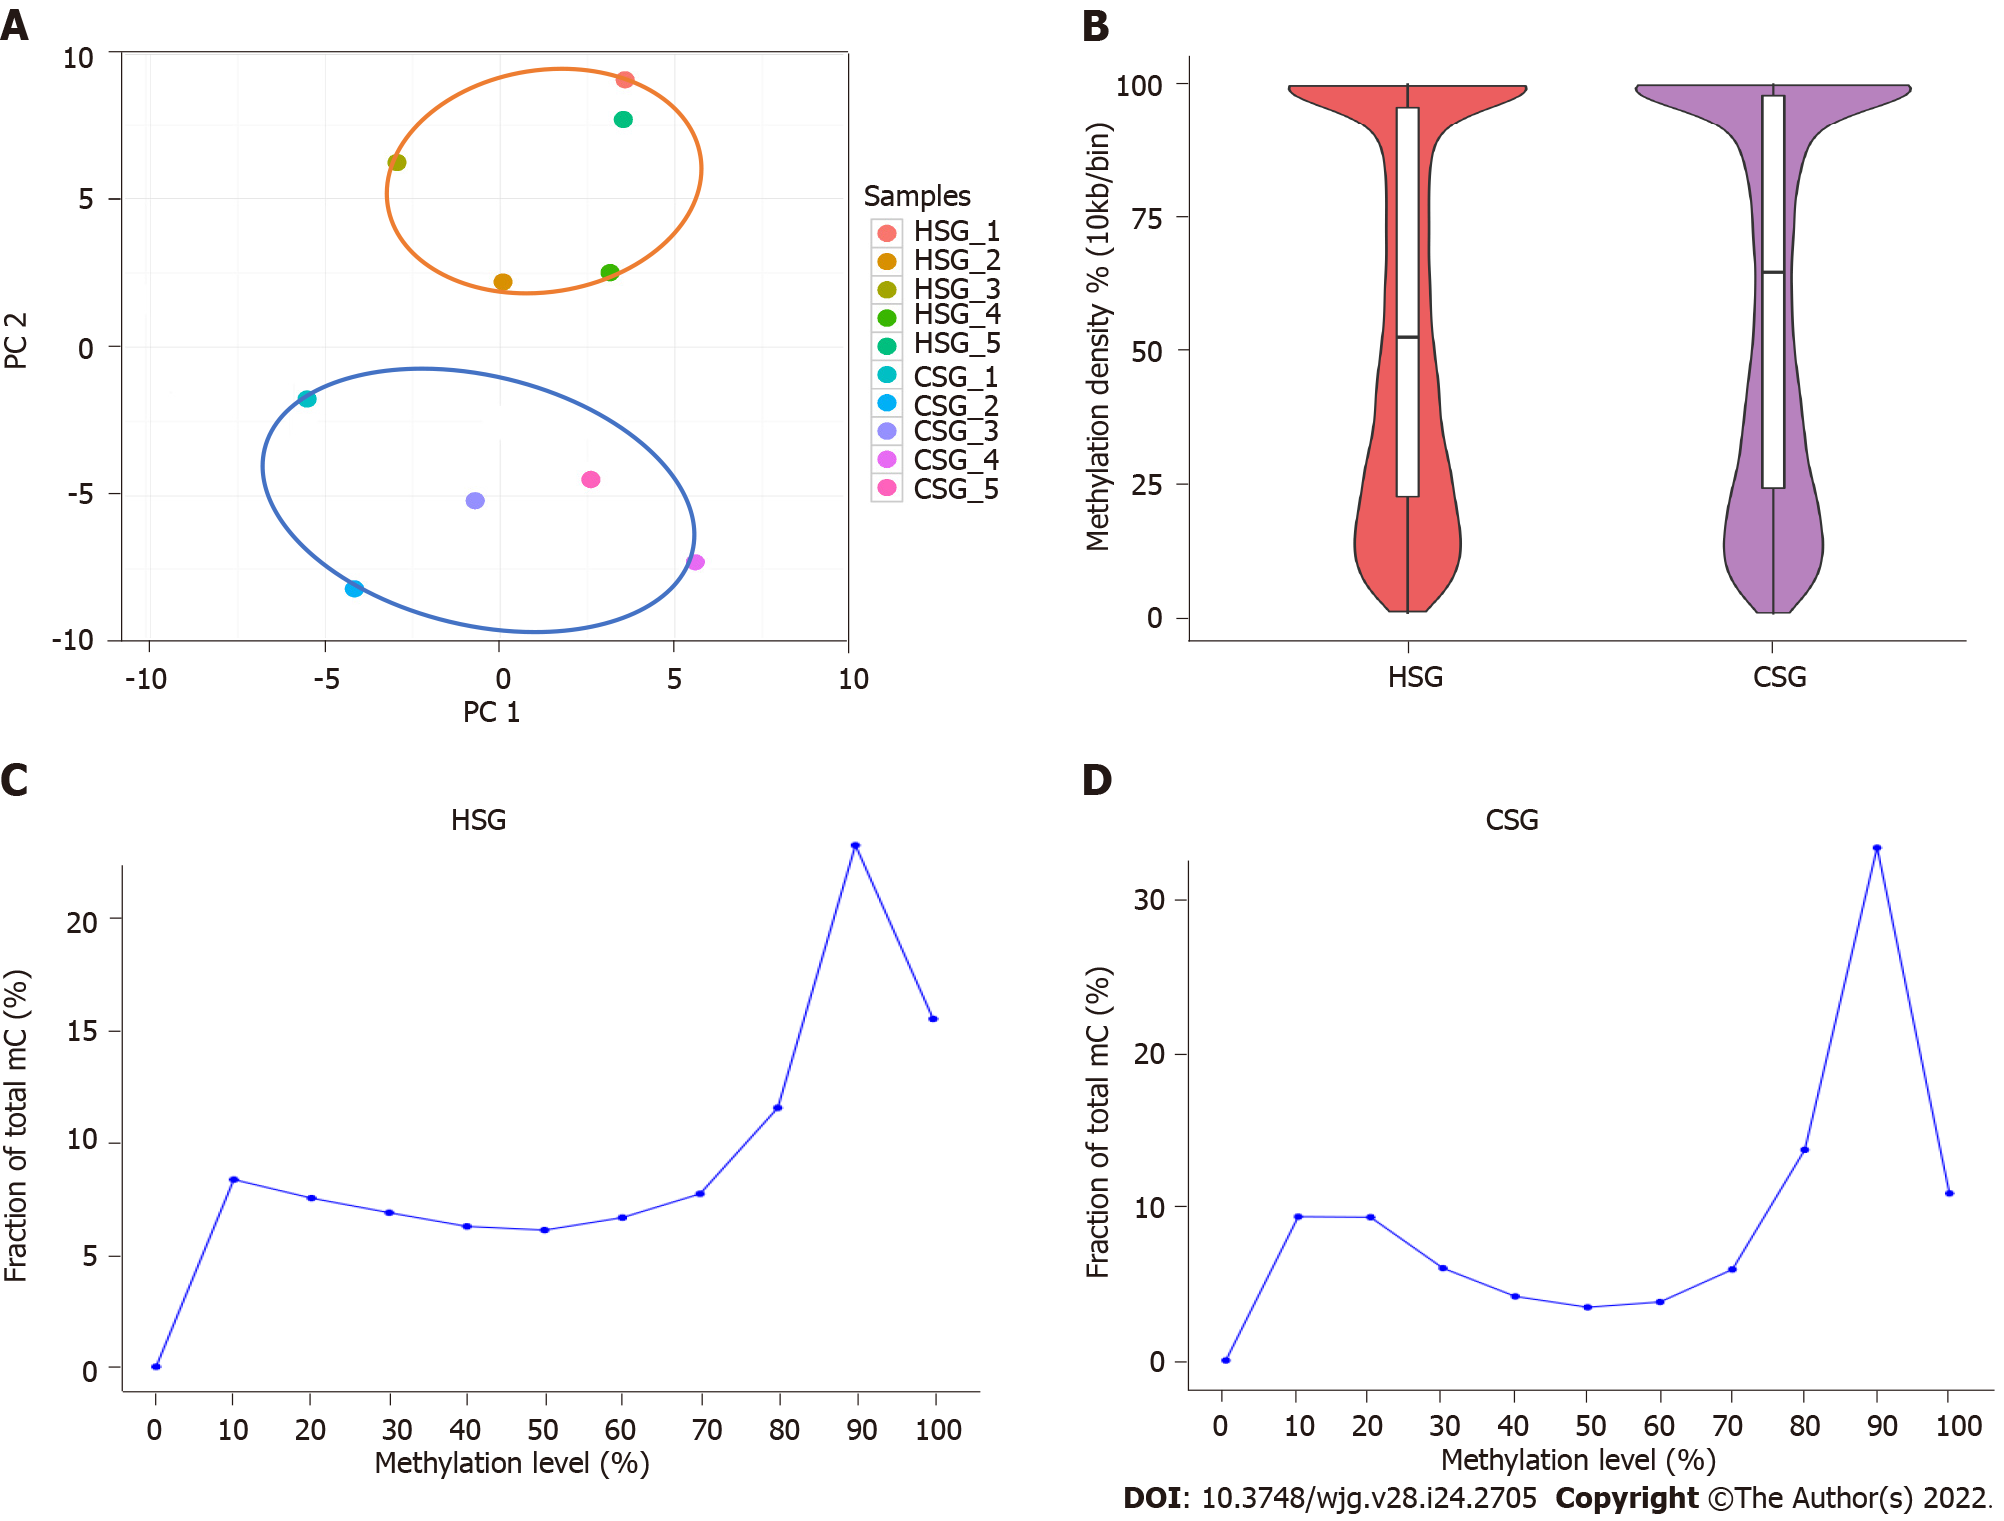
Figure 2 DNA methylation analysis by targeted bisulfite sequencing.
A: Principal component analysis of the methylation profiles between cancer sample group (CSG) and healthy sample group (HSG); B: Comparison of methylation density between CSG and HSG; C: Comparison of methylation level distribution between CSG and HSG. CSG: Cancer sample group; HSG: Healthy sample group; PC: Principal component.
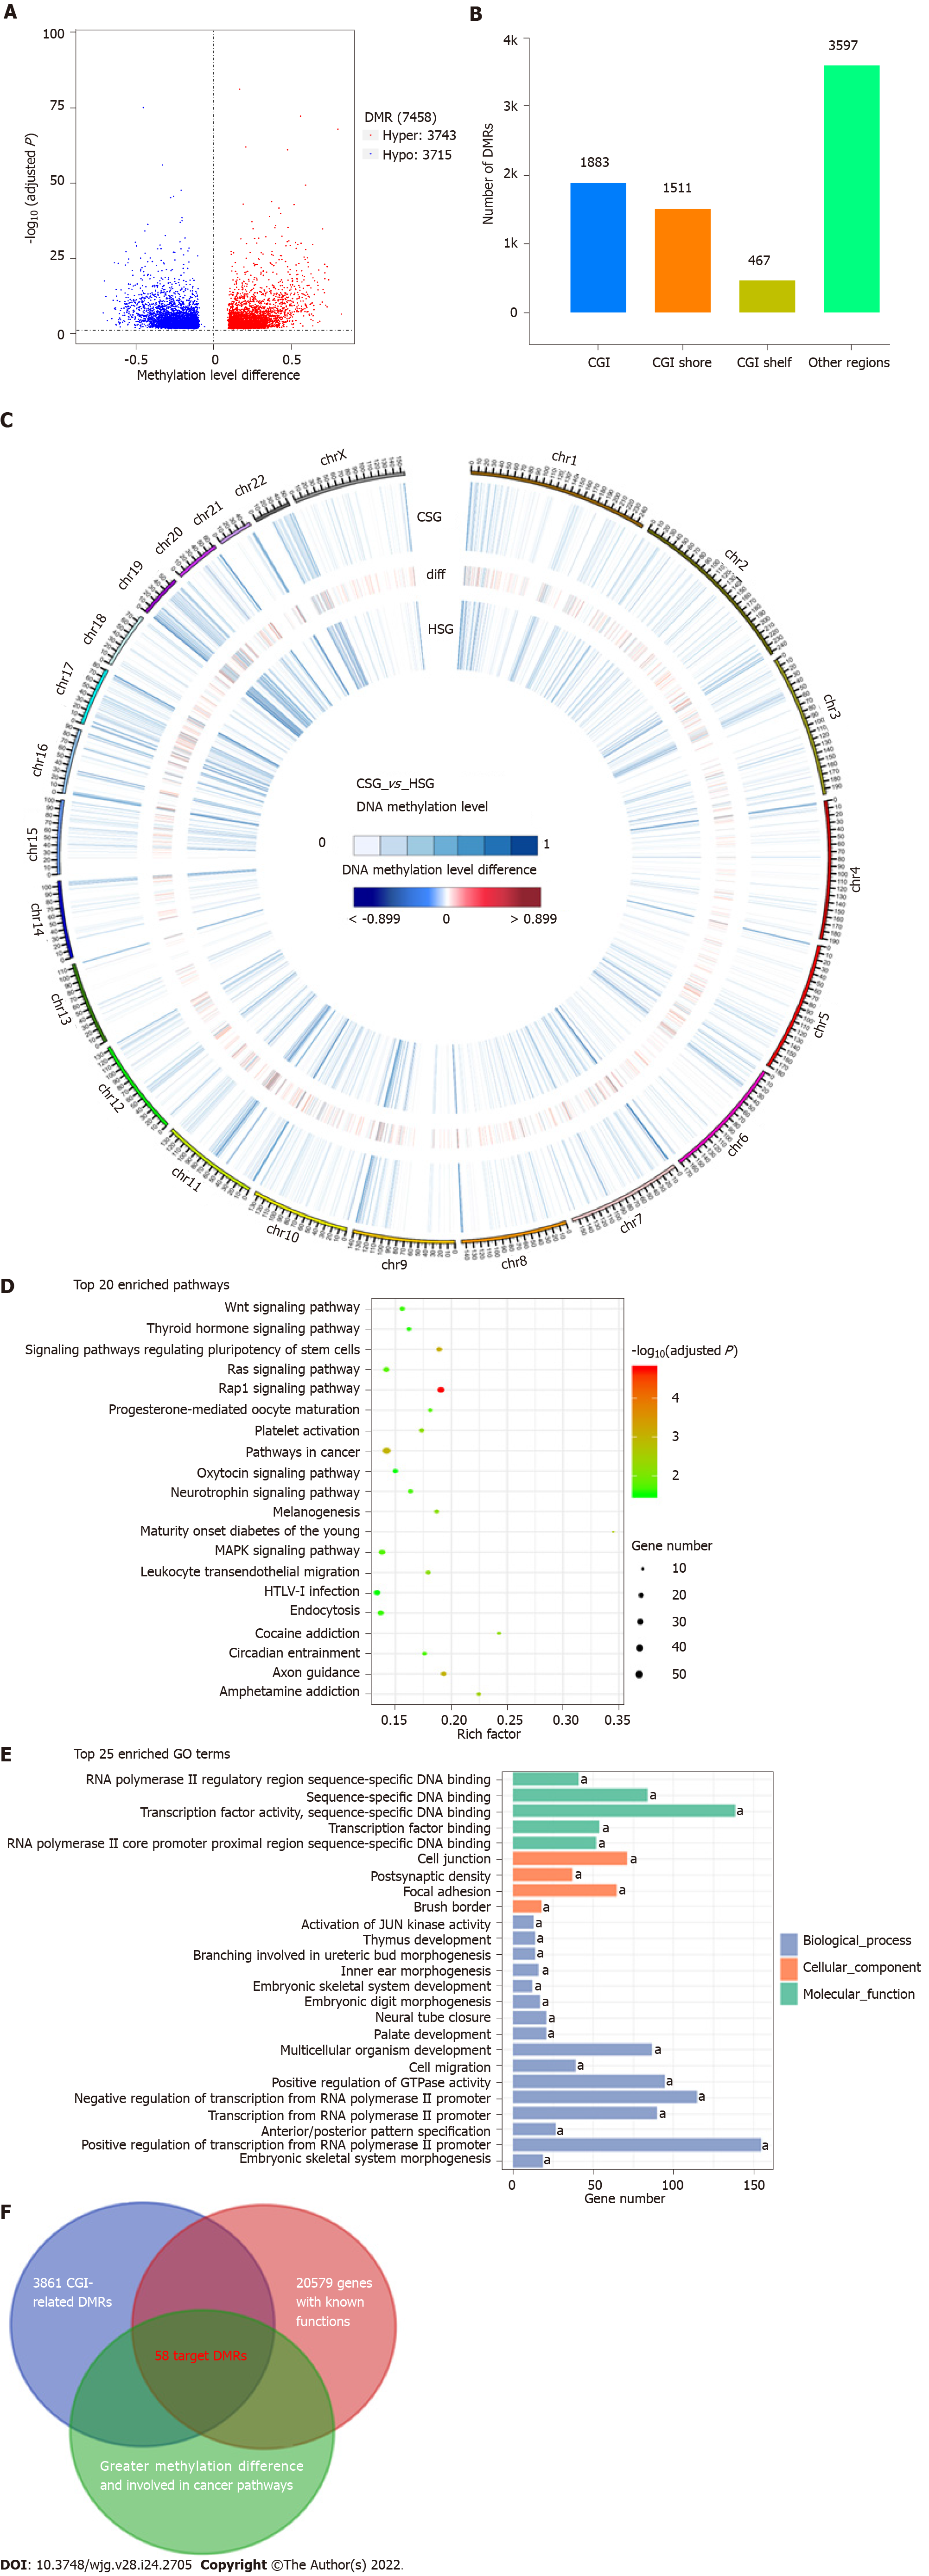
Figure 3 Differentially methylated region analysis and biomarkers discovery.
A: Volcano plot of differentially methylated regions (DMRs) in cancer sample group (CSG) vs healthy sample group (HSG); B: The distribution of the identified DMRs in the genome in relation to cytosine-guanine islands (CGIs); C: Circos plot of 2531 candidate DMRs on each of the 22 autosomes and the X chromosome; D: Kyoto Encyclopedia of Genes and Genomes pathway analysis of 2062 DMR-related genes; E: Gene Ontology analysis of 2062 DMR-related genes; F: Venn diagram of the overlapping target DMRs among different signatures. aP < 0.05. DMRs: Differentially methylated regions; CGI: Cytosine-guanine islands.
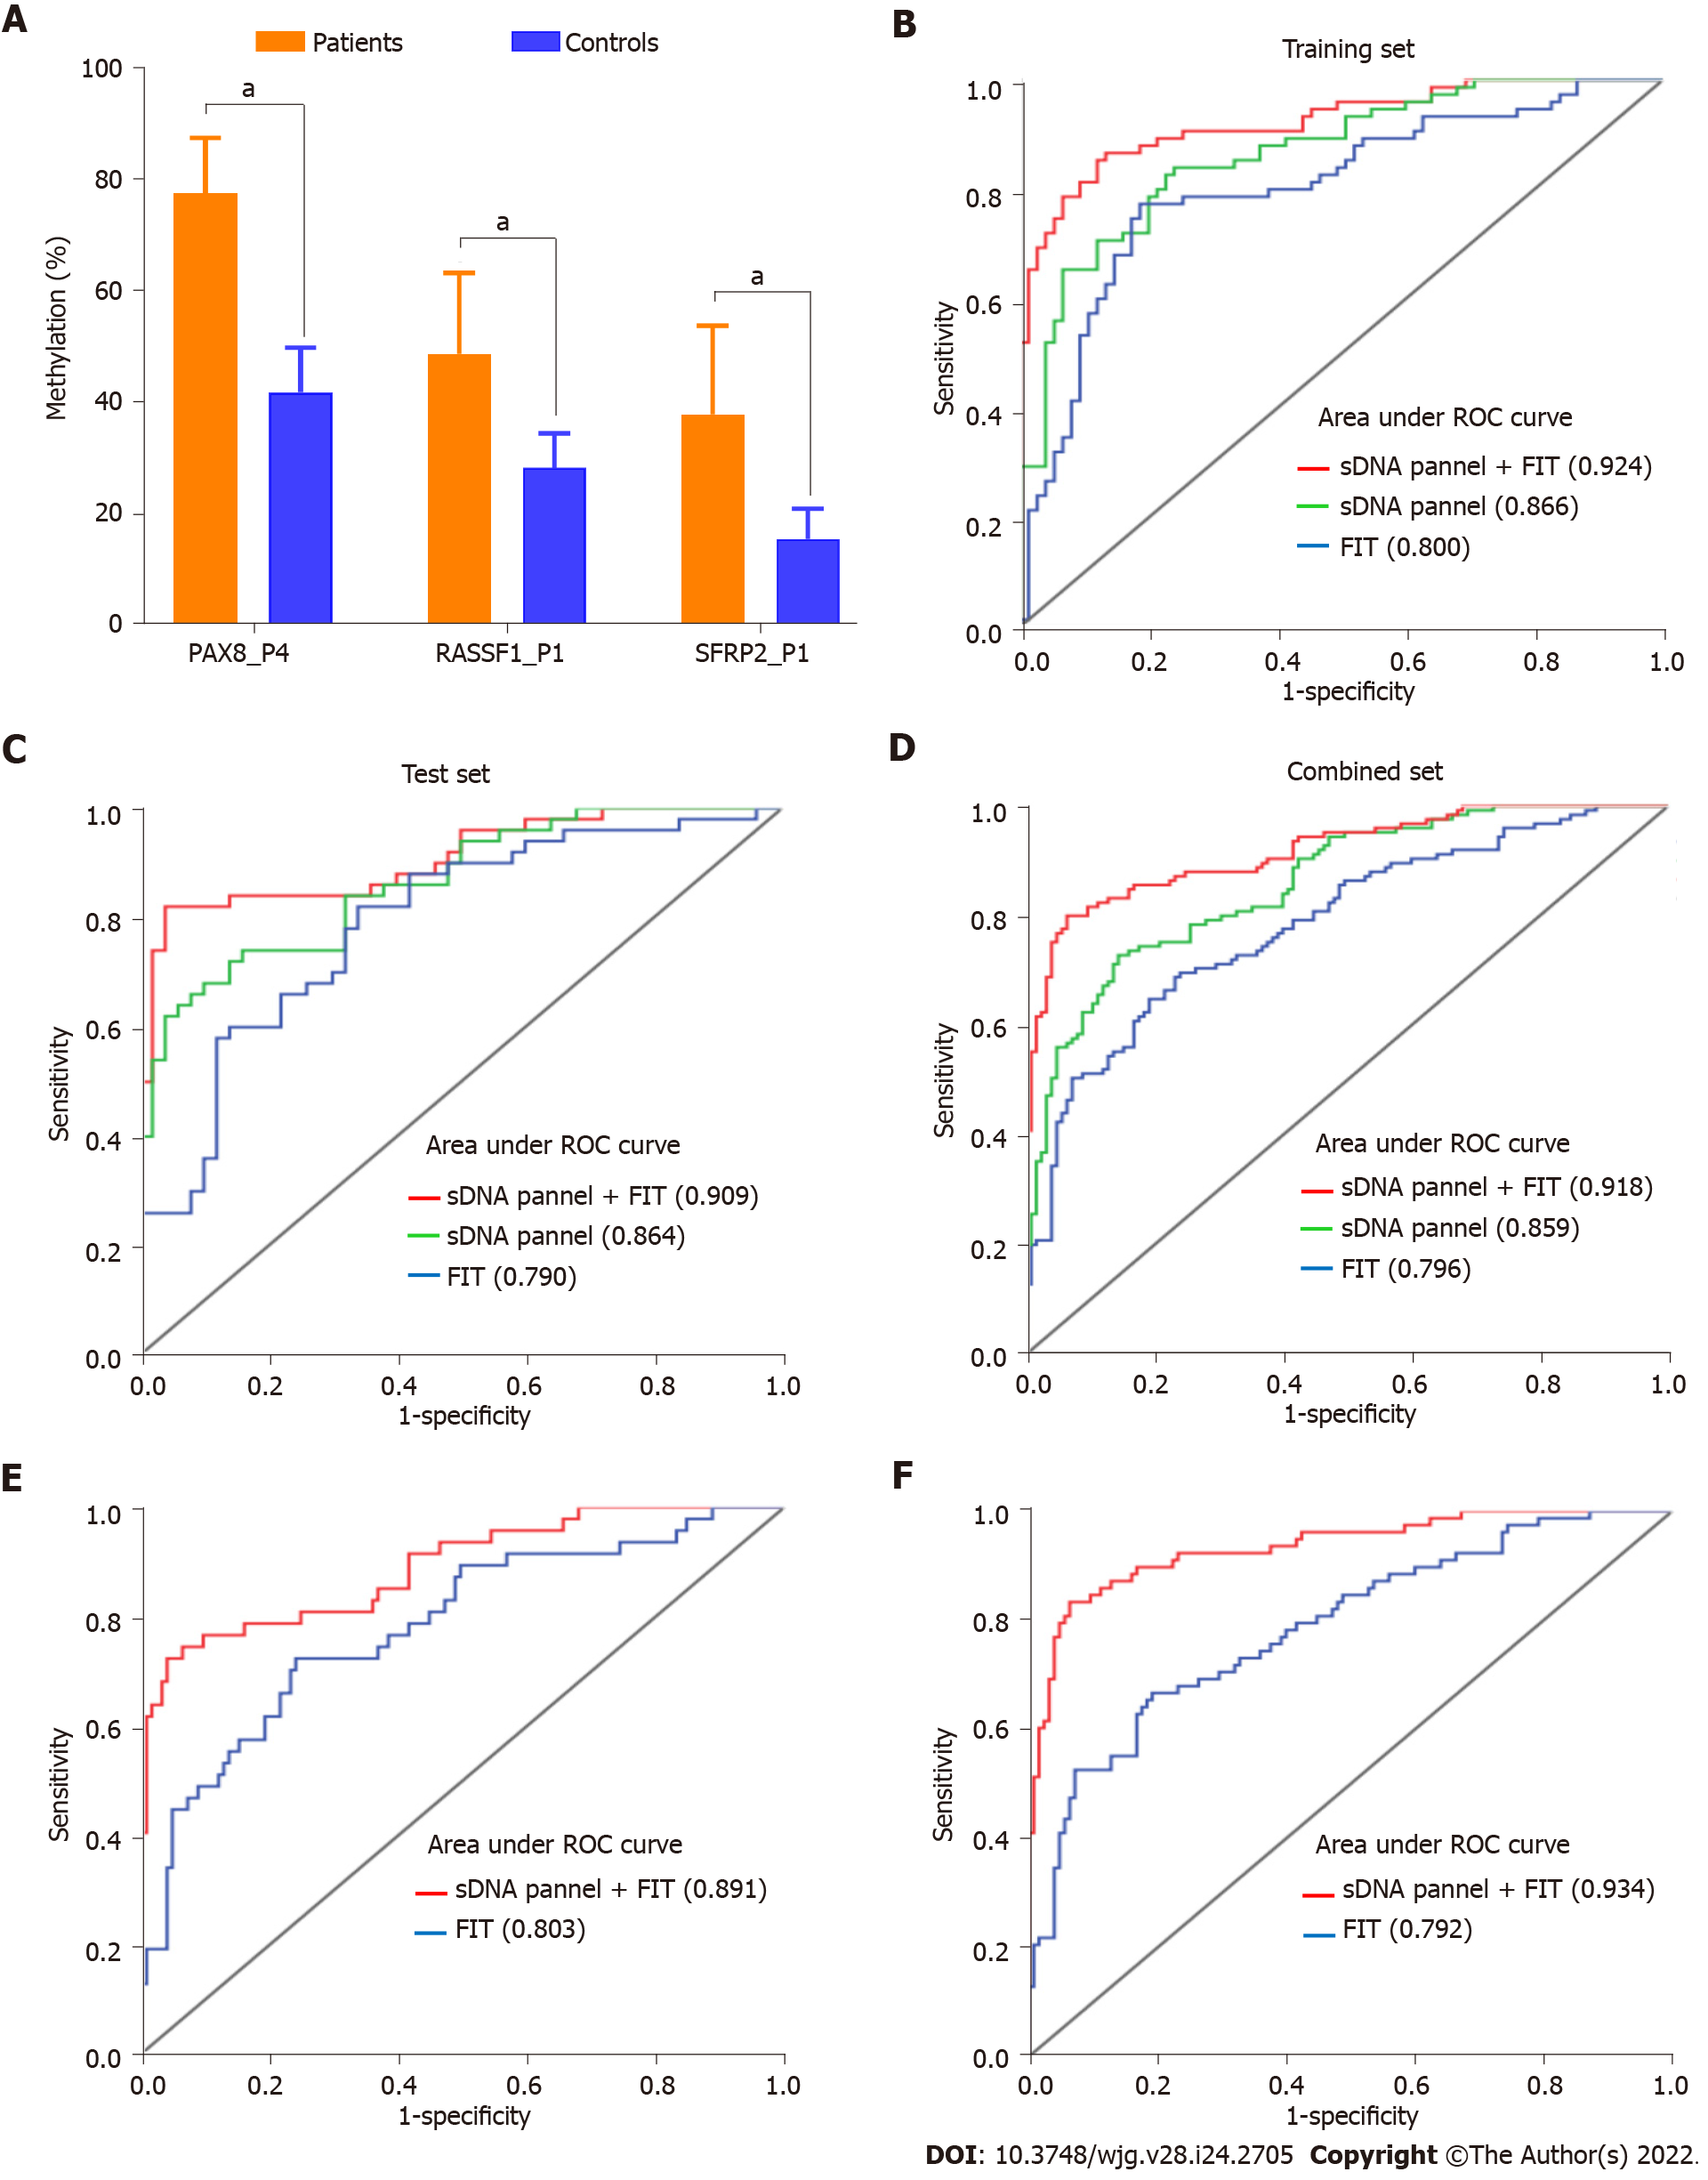
Figure 4 The evaluation of diagnostic model based on pyrosequencing.
A: Comparison of methylation percentage of the three target biomarkers between the patients and controls in training set; B: Receiver operating characteristic (ROC) curves comparing fecal immunochemical test (FIT), stool DNA (sDNA) panel and sDNA panel + FIT for the detection of early-stage colon cancer (ECC) in training set; C: ROC curves comparing FIT, sDNA panel and sDNA panel + FIT for the detection of ECC in test set; D: ROC curves comparing FIT, sDNA panel and sDNA panel + FIT for the detection of ECC in combined set; E: ROC curves comparing FIT and sDNA panel + FIT for the detection of stage I ECC in combined set; F: ROC curves comparing FIT and sDNA panel + FIT for the detection of stage II ECC in combined set. aP < 0.05. sDNA: Stool DNA; FIT: Fecal immunochemical test; ROC: Receiver operating characteristic; PAX8: Paired box 8; RASSF1: Ras-association domain family 1; SFRP2: Secreted frizzled-related protein 2.
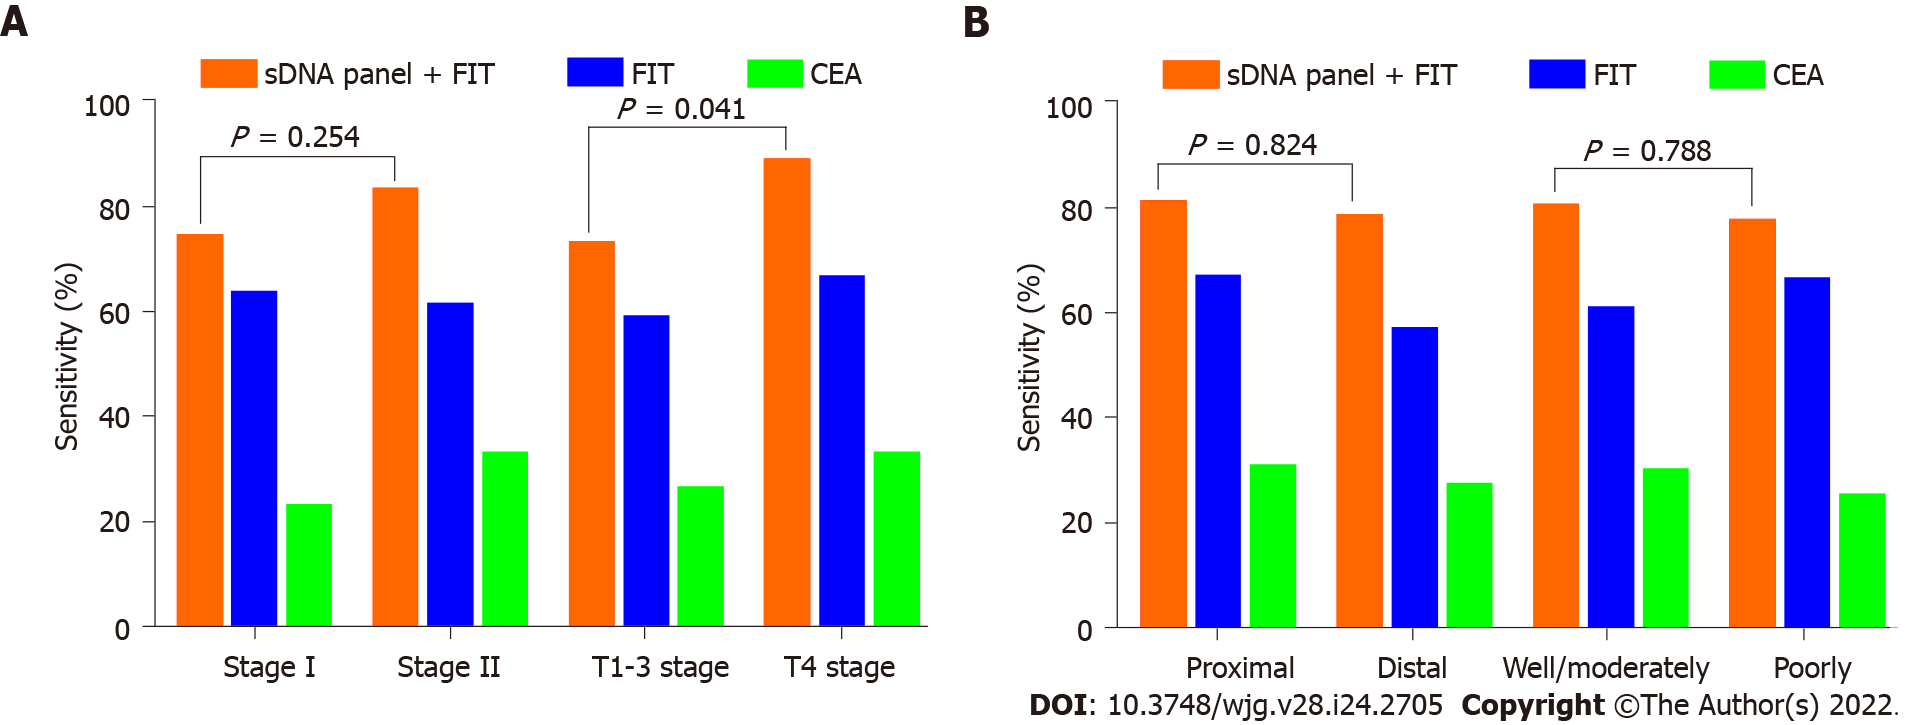
Figure 5 Impact of clinicopathologic covariates on screening.
A: Sensitivities of fecal immunochemical test (FIT), serum carcinoembryonic antigen (CEA) and stool DNA (sDNA) panel + FIT for the detection of early-stage colon cancer (ECC), according to tumor-node-metastasis stage or T stage; B: Sensitivities of FIT, serum CEA and sDNA panel + FIT for the detection of ECC, according to tumor site or histological differentiation. sDNA: Stool DNA; FIT: Fecal immunochemical test; CEA: Carcinoembryonic antigen.
- Citation: Jiang HH, Xing SW, Tang X, Chen Y, Lin K, He LW, Lin MB, Tang EJ. Novel multiplex stool-based assay for the detection of early-stage colon cancer in a Chinese population. World J Gastroenterol 2022; 28(24): 2705-2732
- URL: https://www.wjgnet.com/1007-9327/full/v28/i24/2705.htm
- DOI: https://dx.doi.org/10.3748/wjg.v28.i24.2705


