Copyright
©The Author(s) 2022.
World J Gastroenterol. Jun 21, 2022; 28(23): 2569-2581
Published online Jun 21, 2022. doi: 10.3748/wjg.v28.i23.2569
Published online Jun 21, 2022. doi: 10.3748/wjg.v28.i23.2569
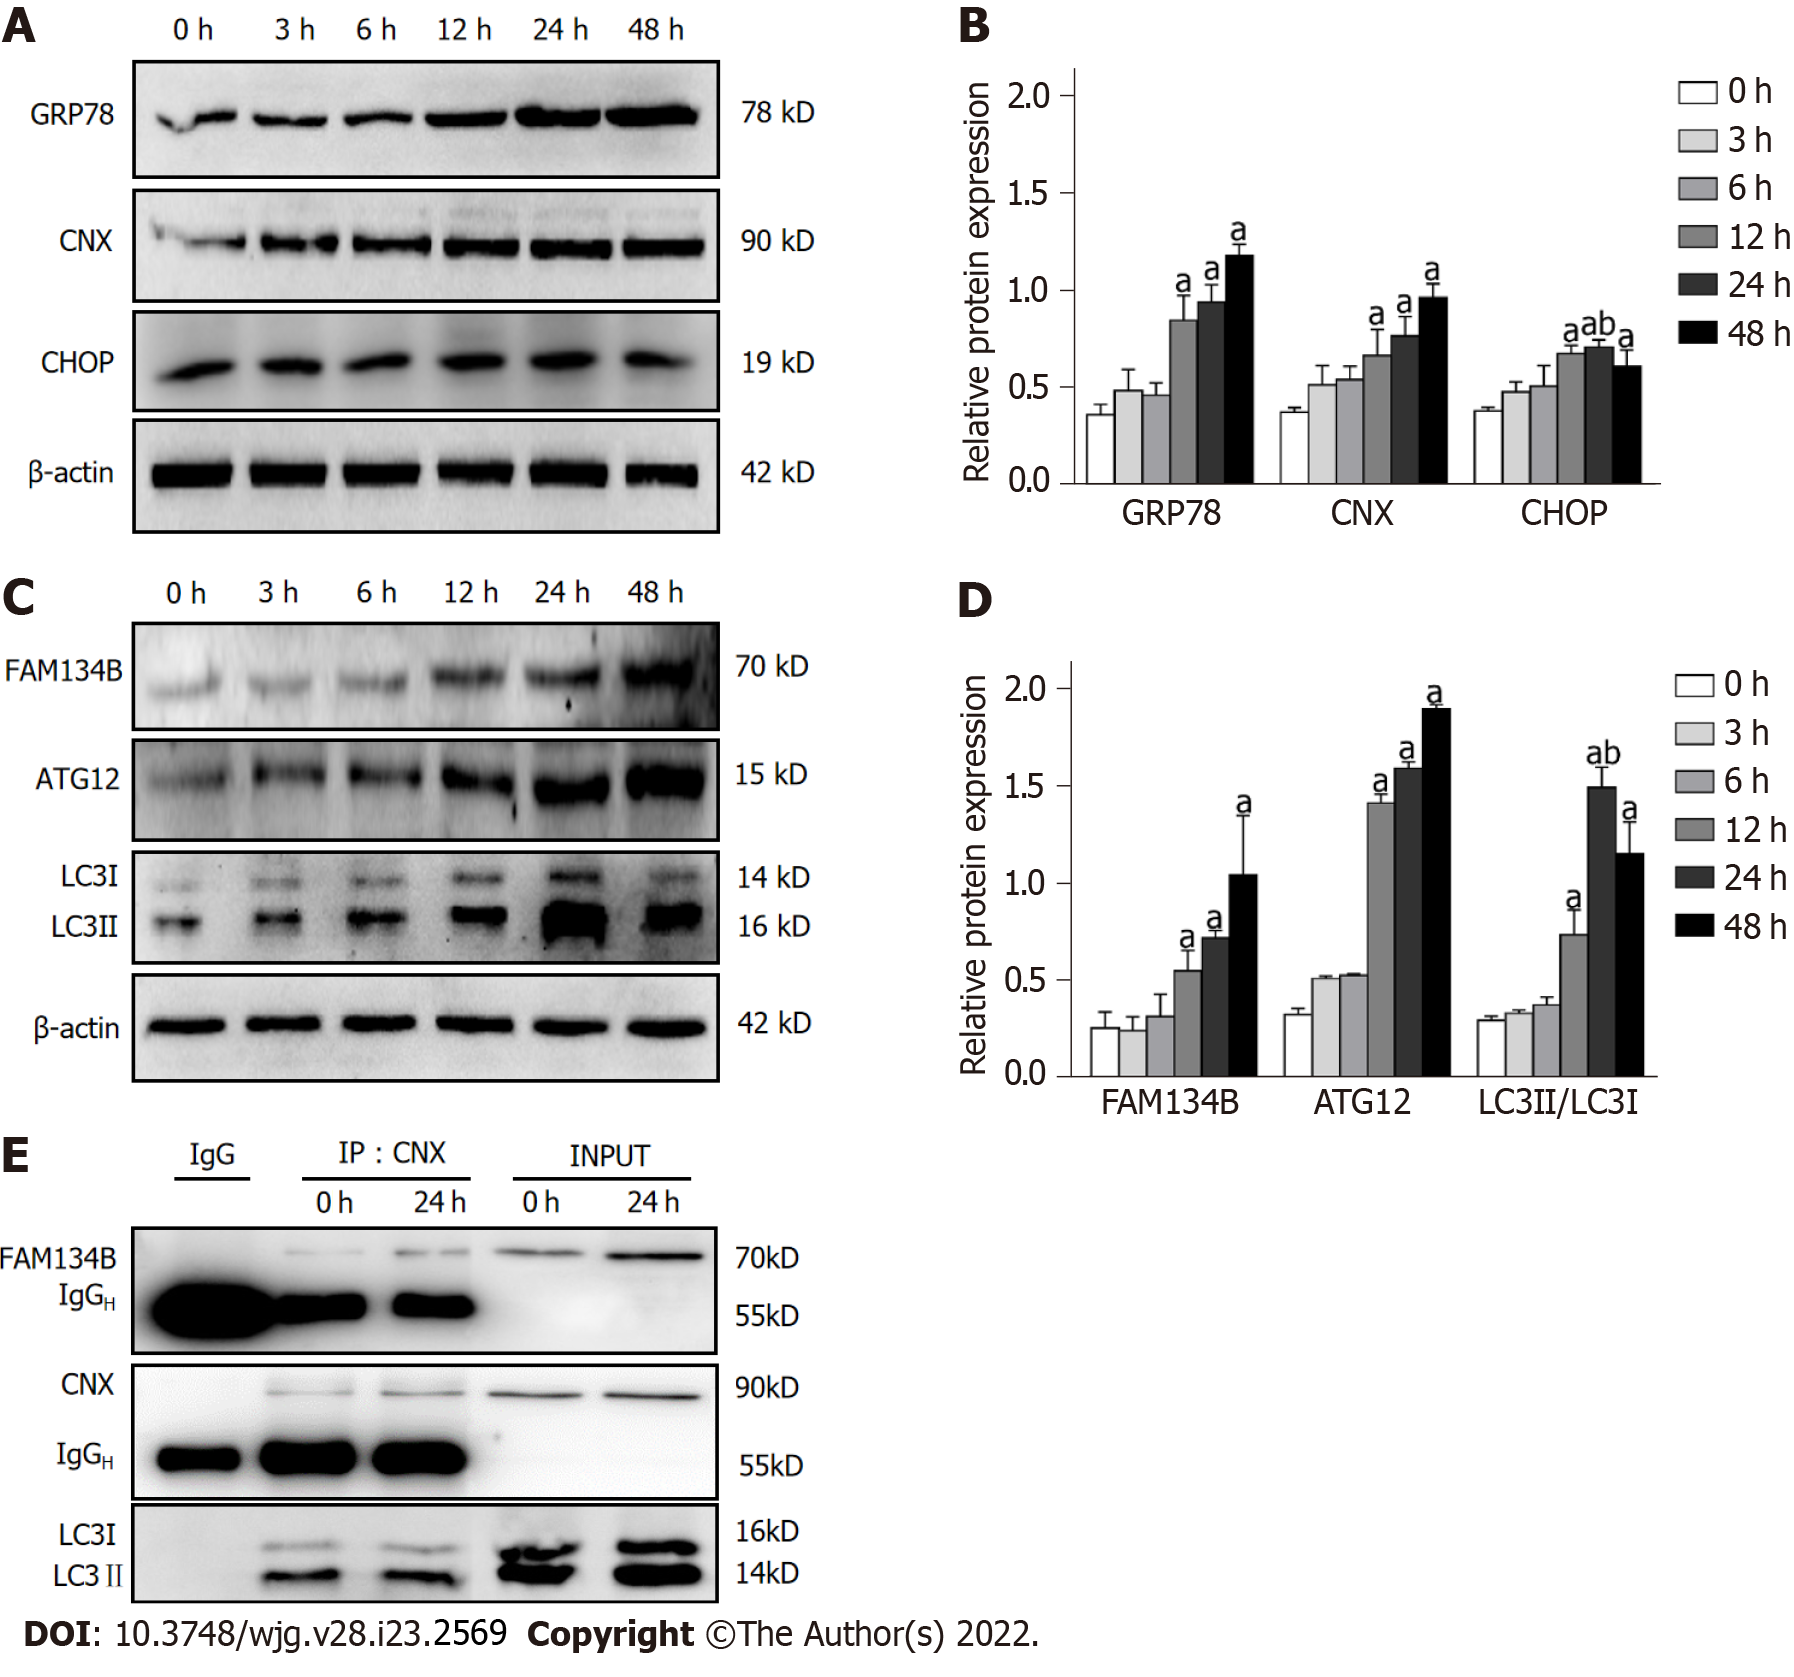
Figure 1 Impact of the endoplasmic reticulum stressor, dithiothreitol, on endoplasmic reticulophagy mediated by family with sequence similarity 134 member B in buffalo rat liver 3A cells.
A and B: Buffalo rat liver 3A (BRL-3A) cells were treated with 2.0 mmol/L dithiothreitol (DTT) for the time intervals (0, 3, 6, 12, 24, 48 h); Western blot showed the effect of endoplasmic reticulum (ER) stressor, DTT, on expression of the ER stress-related proteins glucose-regulated protein 78 (GRP78), calnexin (CNX), and C/EBP homologous protein (CHOP); β-actin was used as a control for normalization; C and D: Analysis of autophagy related gene 12 (ATG12), family with sequence similarity 134 member B (FAM134B), and microtubule-associated protein 1 light chain 3 (LC3) protein expression by western blot. Protein levels were normalized to β-actin; E: BRL-3A cells were treated with 2.0 mmol/L DTT for 0 and 24 h; co-immunoprecipitation analysis detected the presence of CNX-FAM134B-LC3 complex in BRL-3A cells. Values are represented as mean ± SD (n = 3), aP < 0.05 vs 0 h group; bP < 0.05 vs 48 h group.
Figure 2 Impact of dithiothreitol treatment on the formation of autolysosomes in buffalo rat liver 3A cells.
After dithiothreitol treatment for 0, 3, 6, 12, 24, and 48 h, the buffalo rat liver 3A cells labeled with endoplasmic reticulum (ER)-Tracker Red and Lyso-Tracker Green were observed and captured under confocal fluorescence microscopy (200 ×) in a live cell imaging experiment. Insets show the magnification of the pictures. Scale bars indicate 100 μm. Arrows head to indicate ER-localized lysosomes. Values are represented as mean ± SD (n = 3), aP < 0.05 vs 0 h group; bP < 0.05 vs 48 h group.
Figure 3 Impact of dithiothreitol treatment on mitochondrial calcium uptake in buffalo rat liver 3A cells.
Buffalo rat liver 3A cells were treated for 0, 3, 6, 24, and 48 h with 2.0 mM dithiothreitol, followed by co-incubating with Mitochondria-Tracker Green and Rhod-2 AM, and visualized by confocal microscopy (400 ×). Scale bars indicate 100 μm. Values are represented as mean ± SD (n = 3), aP < 0.05 vs 0 h group; bP < 0.05 vs 48 h group.
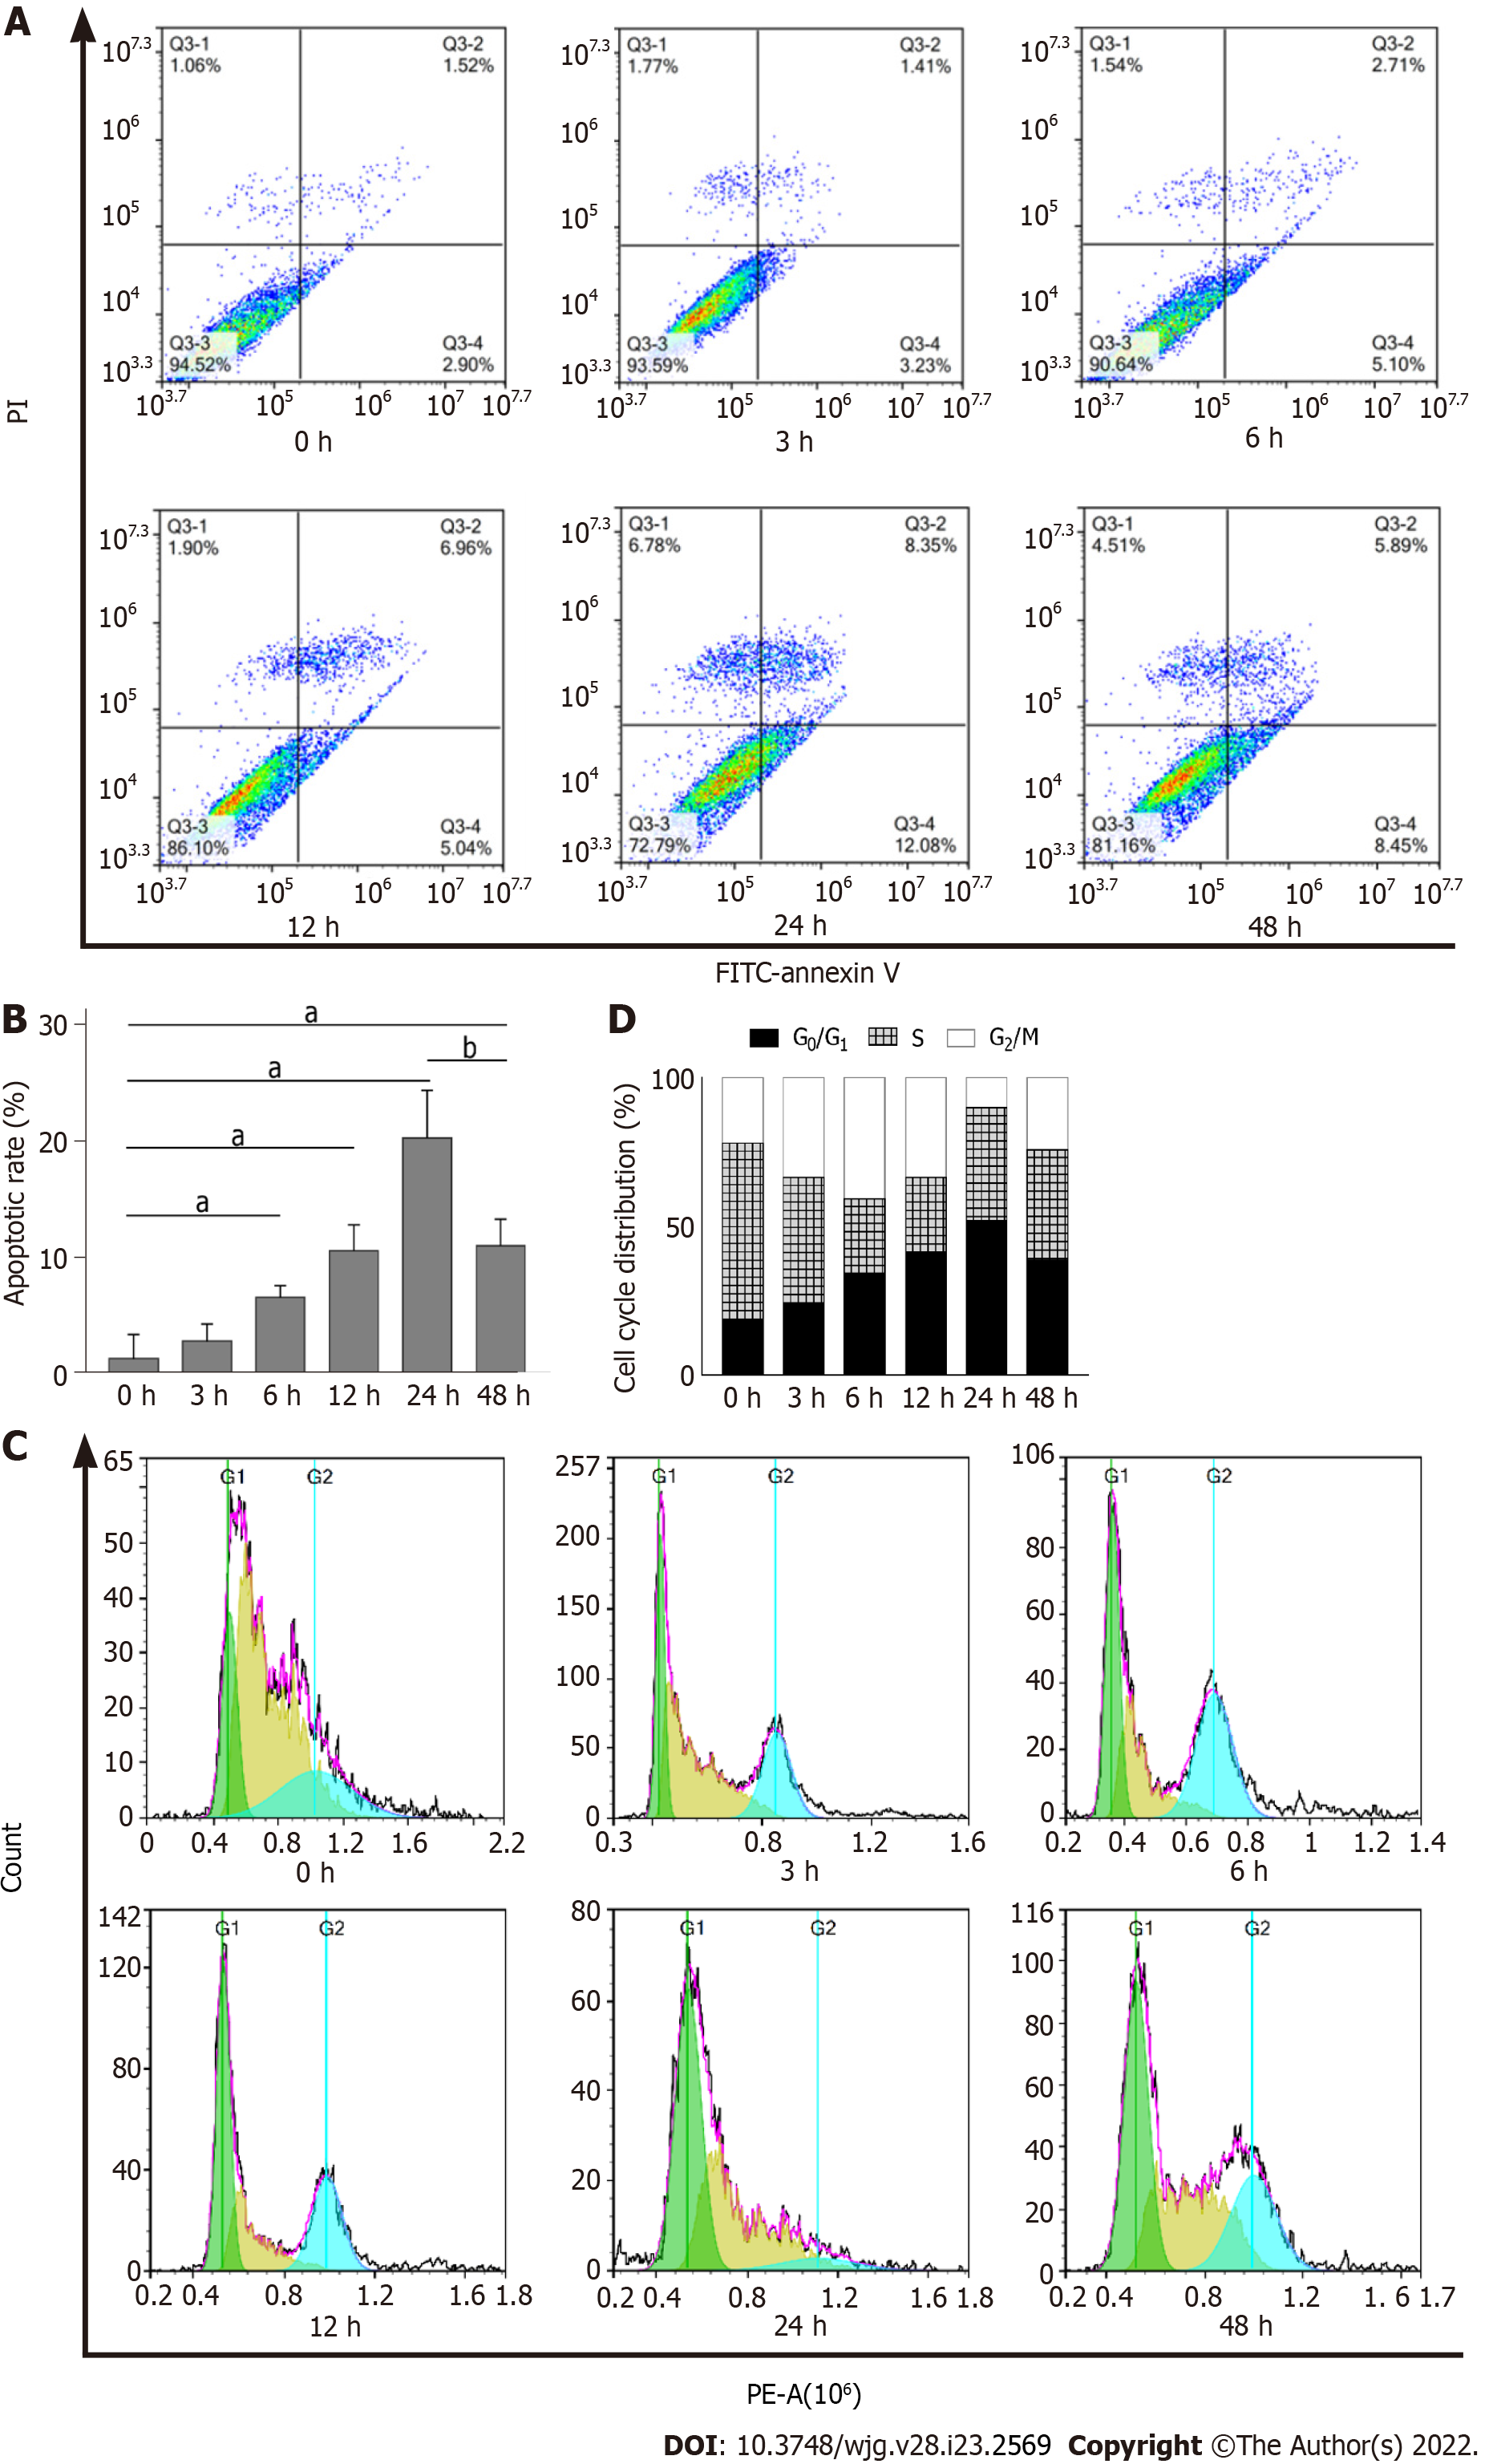
Figure 4 Impact of dithiothreitol treatment on cell cycle and apoptosis of buffalo rat liver 3A cells.
A and B: Buffalo rat liver 3A (BRL-3A) cells were treated with 2.0 mmol/L dithiothreitol (DTT) for 0, 3, 6, 12, 24 and 48 h. The population of apoptotic cells was detected by flow cytometry. The lower right quadrant represents the early apoptotic cells, and the upper right quadrant represents the late apoptotic cells; C and D: BRL-3A cells were treated with 2.0 mmol/L DTT for 0, 3, 6, 12, 24 and 48 h. The analysis of the cell cycle was assessed by flow cytometry. aP < 0.05 vs 0 h group; bP < 0.05 vs 48 h group.
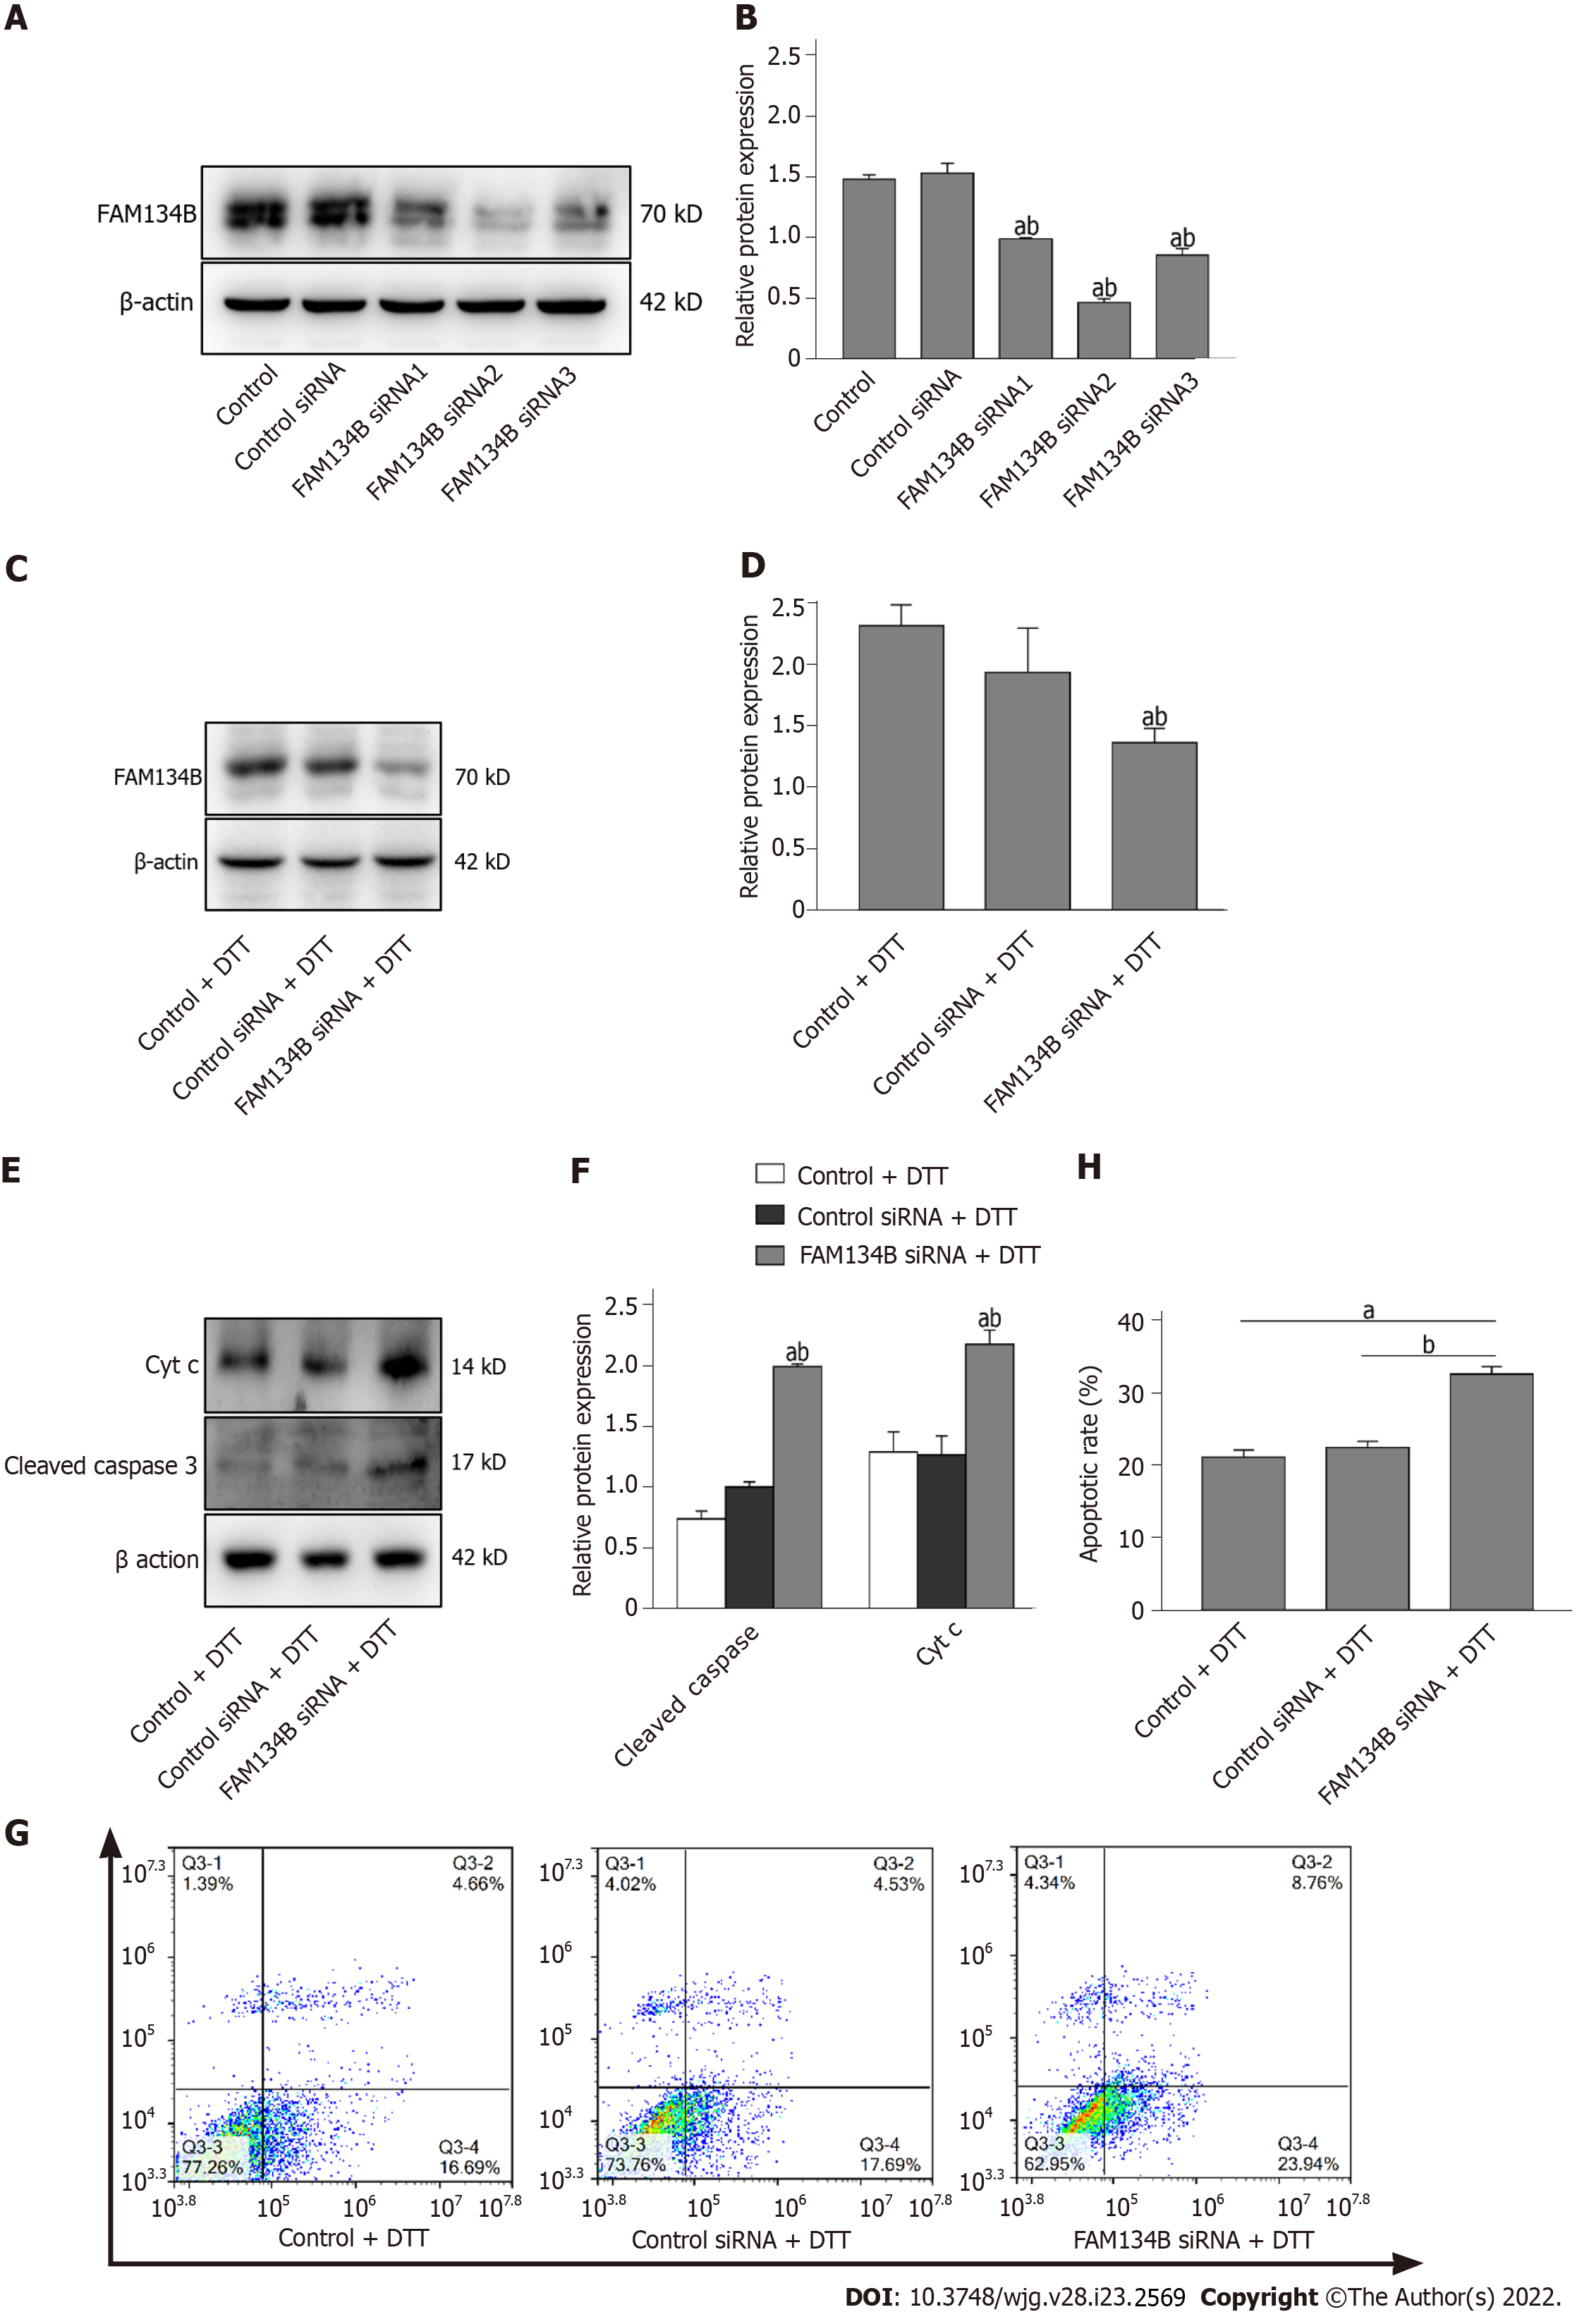
Figure 5 Impact of dithiothreitol treatment on apoptosis of buffalo rat liver 3A cells lacking FAM134B.
A and B: Buffalo rat liver 3A (BRL-3A) cells were transfected with FAM134B small interfering RNAs (siRNAs) 1, 2, and 3; immunoblot was used to detect the transfection efficiency of siRNA. Protein levels were normalized to β-actin; C and D: BRL-3A cells were transfected with FAM134B siRNA, followed by treatment with 2.0 mmol/L dithiothreitol (DTT) for 24 h. Immunoblot was used to detect the expression of FAM134B in BRL-3A cells. Protein levels were normalized to β-actin; E and F: BRL-3A cells were transfected with FAM134B siRNA, followed by treatment with 2.0 mmol/L DTT for 24 h. Immunoblot showed the expression of cleaved caspase-3 and cyt c. Protein levels were normalized to β-actin; G and H: BRL-3A cells were transfected with FAM134B siRNA, followed by treatment with 2.0 mmol/L DTT for 24 h. Representative results showed the apoptotic rate in BRL-3A cells. Untransfected cells served as controls. Cells transfected with control siRNA served as transfection controls. The lower right quadrant represents the early apoptotic cells and the upper right quadrant represents the late apoptotic cells. Values are mean ± SD (n = 3), aP < 0.05 vs control group; bP < 0.05 vs transfection control siRNA group.
- Citation: Guo YX, Han B, Yang T, Chen YS, Yang Y, Li JY, Yang Q, Xie RJ. Family with sequence similarity 134 member B-mediated reticulophagy ameliorates hepatocyte apoptosis induced by dithiothreitol. World J Gastroenterol 2022; 28(23): 2569-2581
- URL: https://www.wjgnet.com/1007-9327/full/v28/i23/2569.htm
- DOI: https://dx.doi.org/10.3748/wjg.v28.i23.2569


