Copyright
©The Author(s) 2021.
World J Gastroenterol. Dec 7, 2021; 27(45): 7844-7854
Published online Dec 7, 2021. doi: 10.3748/wjg.v27.i45.7844
Published online Dec 7, 2021. doi: 10.3748/wjg.v27.i45.7844
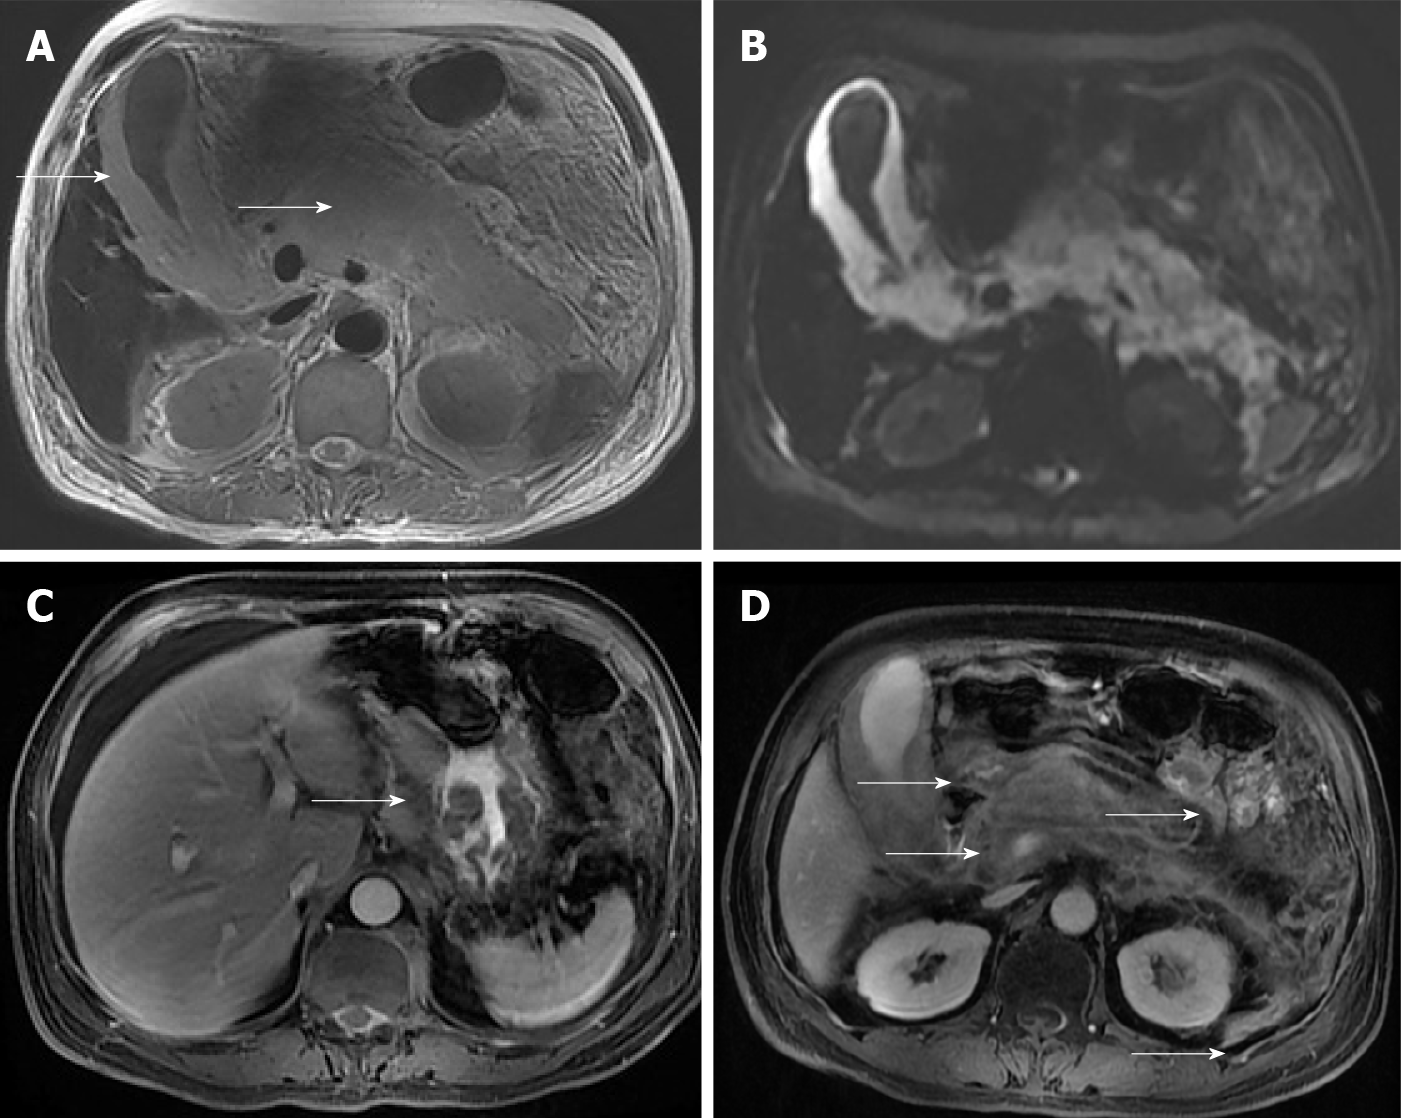
Figure 1 Magnetic resonance imaging of the abdomen at diagnosis.
A: Axial T2-weighted magnetic resonance imaging (MRI) demonstrates homogeneous, hyperintense lesion in the whole pancreas and a markedly swollen gallbladder (arrows); B: Diffusion-weighted MRI shows abnormal hyperintensity in gall bladder wall and pancreas; C: Axial contrast-enhanced T1-weighted MRI shows the abnormal thickened lesions of the gastric wall (arrows), which display contrast enhancement in a × homogeneous fashion; D: Axial contrast-enhanced T1-weighted MRI shows the swollen gallbladder and multiple enlarged retroperitoneal lymph nodes (arrows), which display contrast enhancement in a homogeneous fashion.
Figure 2 Magnetic resonance imaging of the thoracic and lumbar vertebrae at diagnosis.
A: Sagittal T2-weighted magnetic resonance imaging (MRI) shows epidural mass at the centrum and left posterolateral aspect of the spinal cord at the T9 to T12 levels, resulting in severe cord compression; B: Sagittal contrast-enhanced T1-weighted MRI shows the lesions displaying contrast enhancement in a heterogeneous fashion; C: Axial T2-weighted MRI shows that epidural mass involves the centrum and left posterolateral aspect of the spinal cord; D: Axial contrast-enhanced T1-weighted MRI shows the lesions displaying contrast enhancement in a heterogeneous fashion.
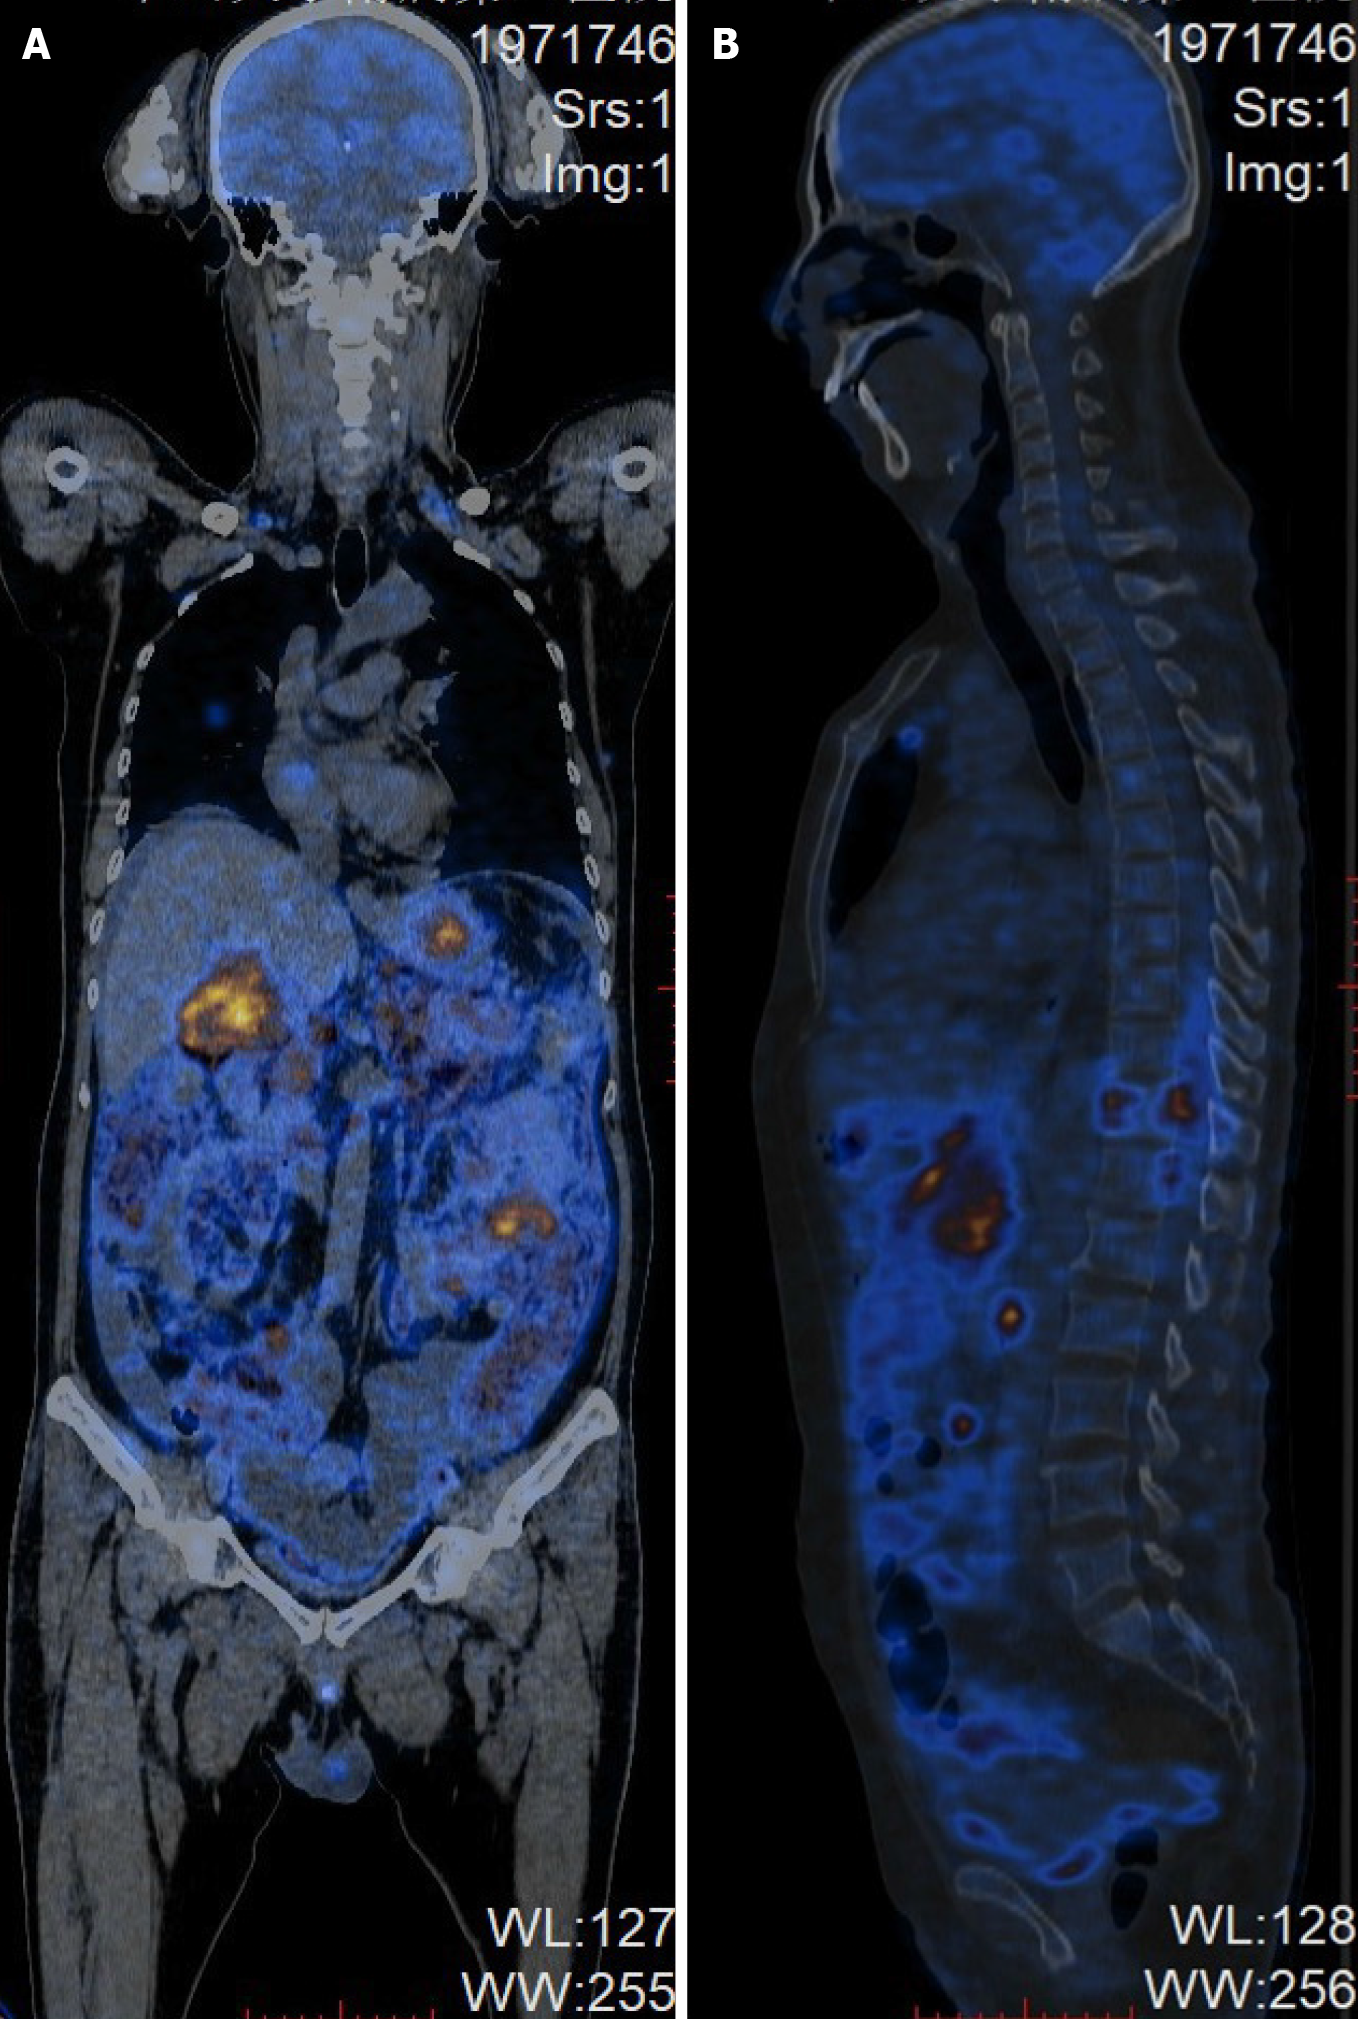
Figure 3 Positron emission tomography-computed tomography of the whole body at diagnosis.
A: Coronal images; B: Sagittal images.
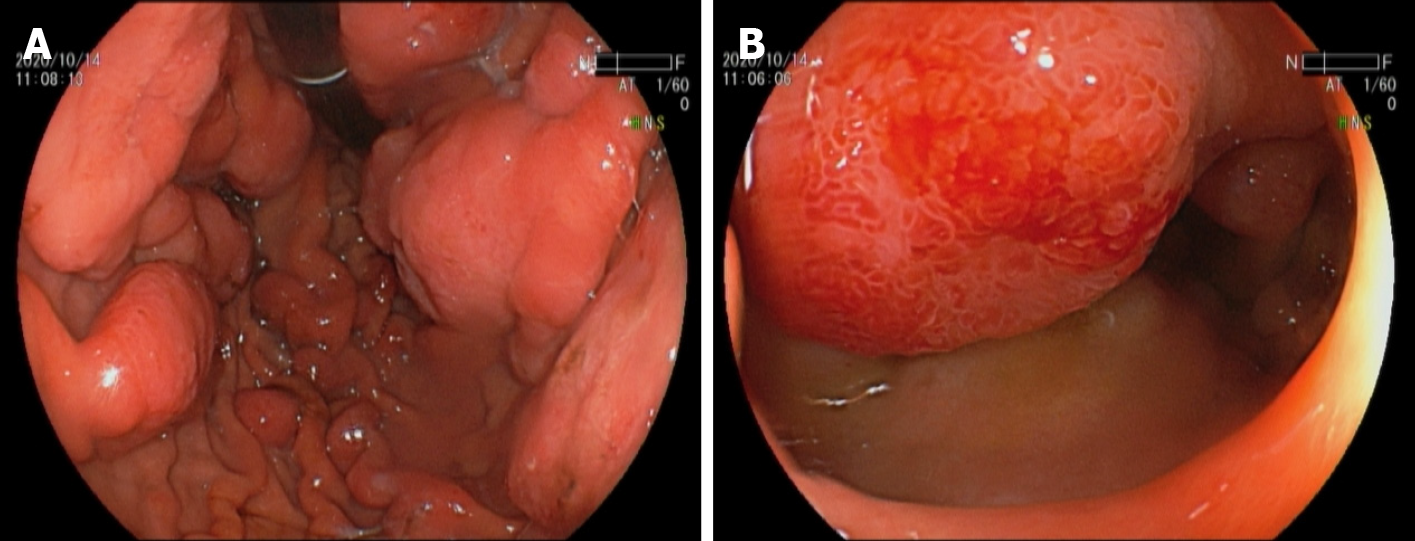
Figure 4 Gastric endoscopy.
A: Multiple large (2 to 3 cm in diameter) raised ulcerated tumors involving both the greater and smaller curvatures of the gastric body; B: Numerous smaller tumors involving the anterior wall of the duodenal bulb and the second part of duodenum.
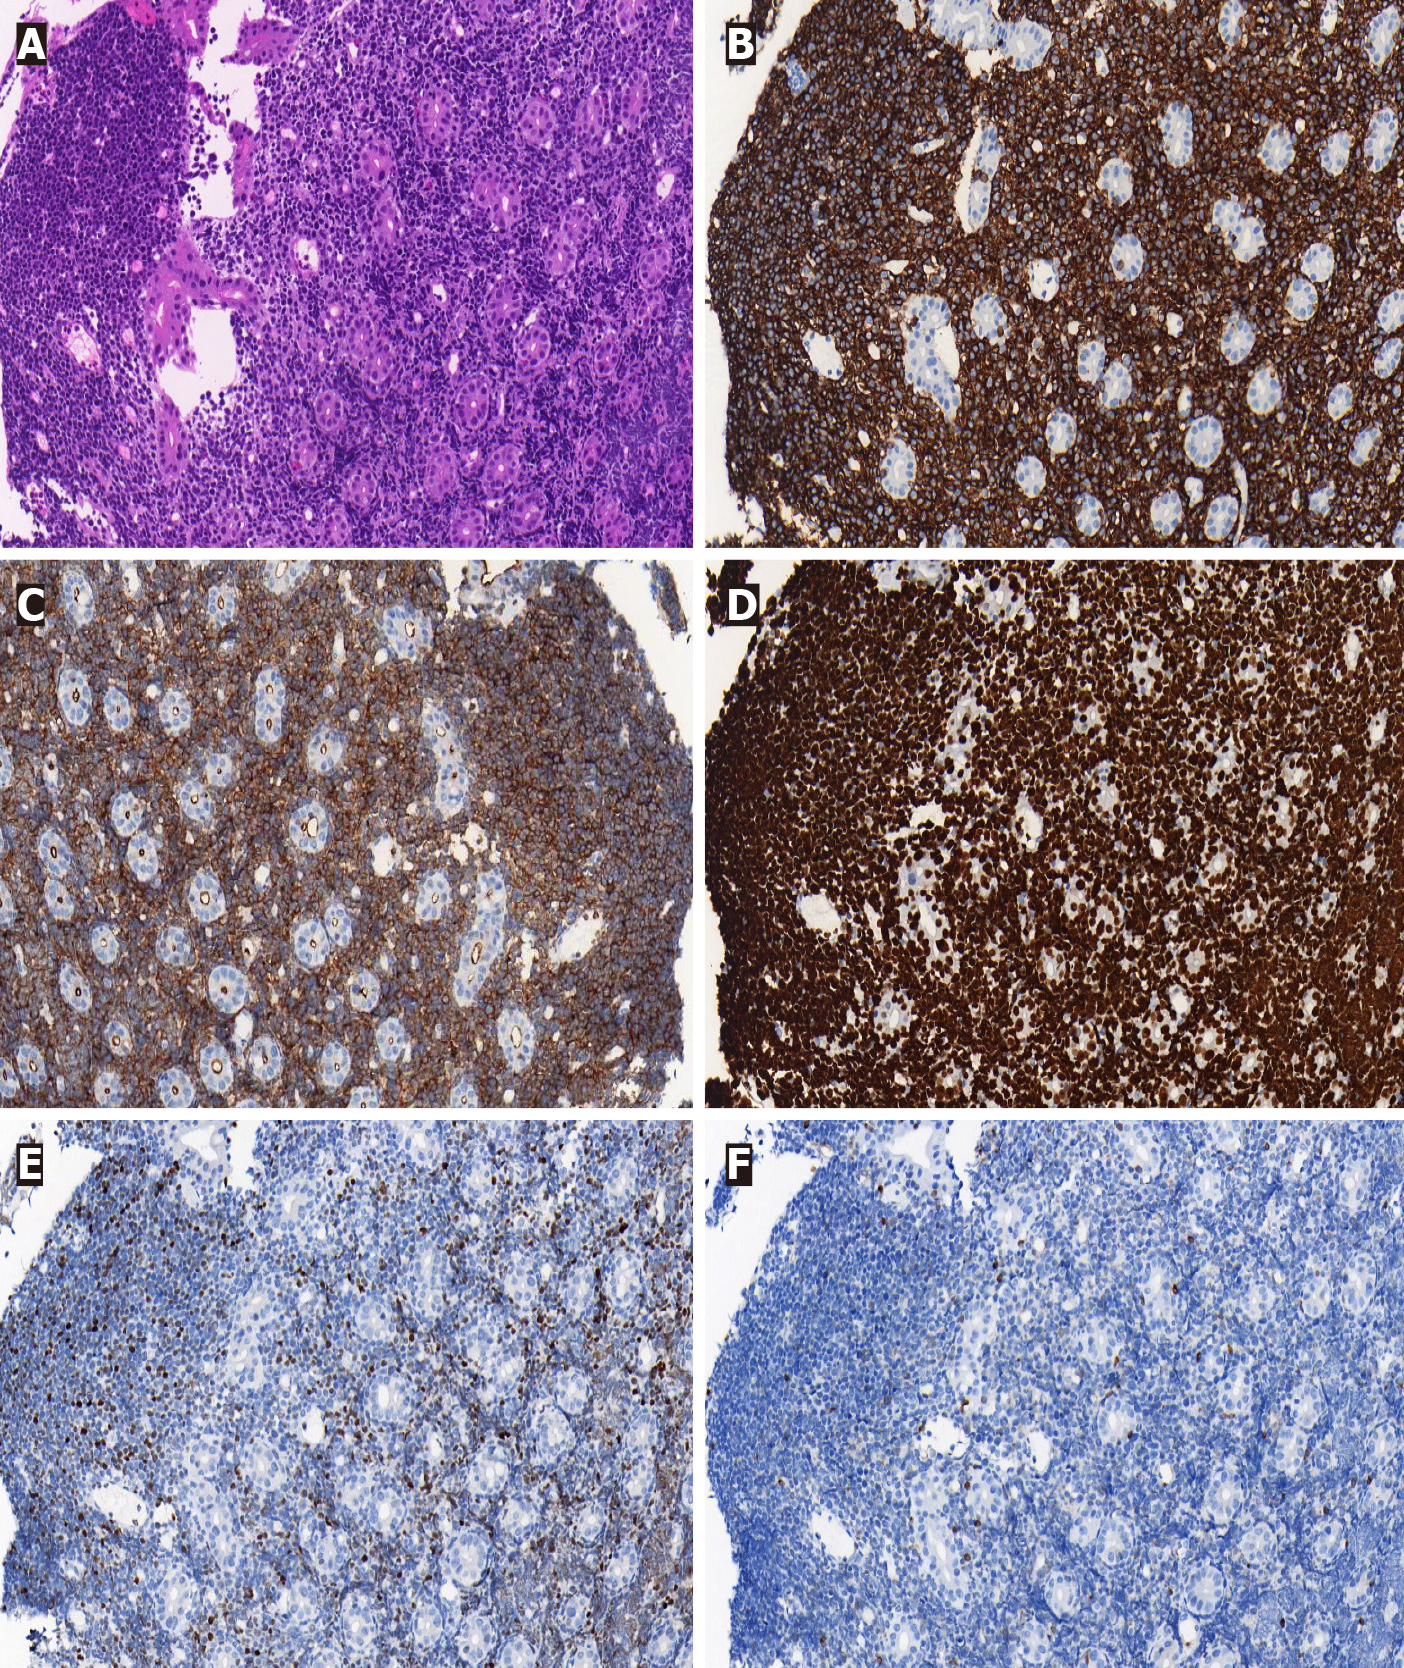
Figure 5 Histology and immunohistochemistry of gastric biopsies (× 200).
A: Haematoxylin and eosin staining showed a characteristic “starry sky” appearance; B: Immunohistochemical staining was positive for CD20; C: Immunohistochemical staining was positive for CD10; D: Immunohistochemical staining was positive for Ki-67 (> 90% +); E: Immunohistochemical staining was positive for BCL-6; F: Immunohistochemical staining was negative for BCL-2.
- Citation: Lin Y, Pan YH, Li MK, Zong XD, Pan XM, Tan SY, Guo YW. Clinical presentation of gastric Burkitt lymphoma presenting with paraplegia and acute pancreatitis: A case report. World J Gastroenterol 2021; 27(45): 7844-7854
- URL: https://www.wjgnet.com/1007-9327/full/v27/i45/7844.htm
- DOI: https://dx.doi.org/10.3748/wjg.v27.i45.7844


