Copyright
©The Author(s) 2021.
World J Gastroenterol. Aug 7, 2021; 27(29): 4879-4889
Published online Aug 7, 2021. doi: 10.3748/wjg.v27.i29.4879
Published online Aug 7, 2021. doi: 10.3748/wjg.v27.i29.4879
Figure 1 Effects of Fusobacteriumnucleatum, Peptostreptococcusanaerobius, and Parvimonasmicra on natural killer cells in vitro.
Natural killer 92 cells were cultured for 24 or 48 h with each organism at a multiplicity of infection of 100:1, 250:1 or 500:1. Post-incubation, viability in the cultures was assessed using trypan blue staining. A: Fusobacterium nucleatum; B: Peptostreptococcus anaerobius; C: Parvimonas micra. F. nucleatum: Fusobacterium nucleatum; P. anaerobius: Peptostreptococcus anaerobius; P. micra: Parvimonas micra.
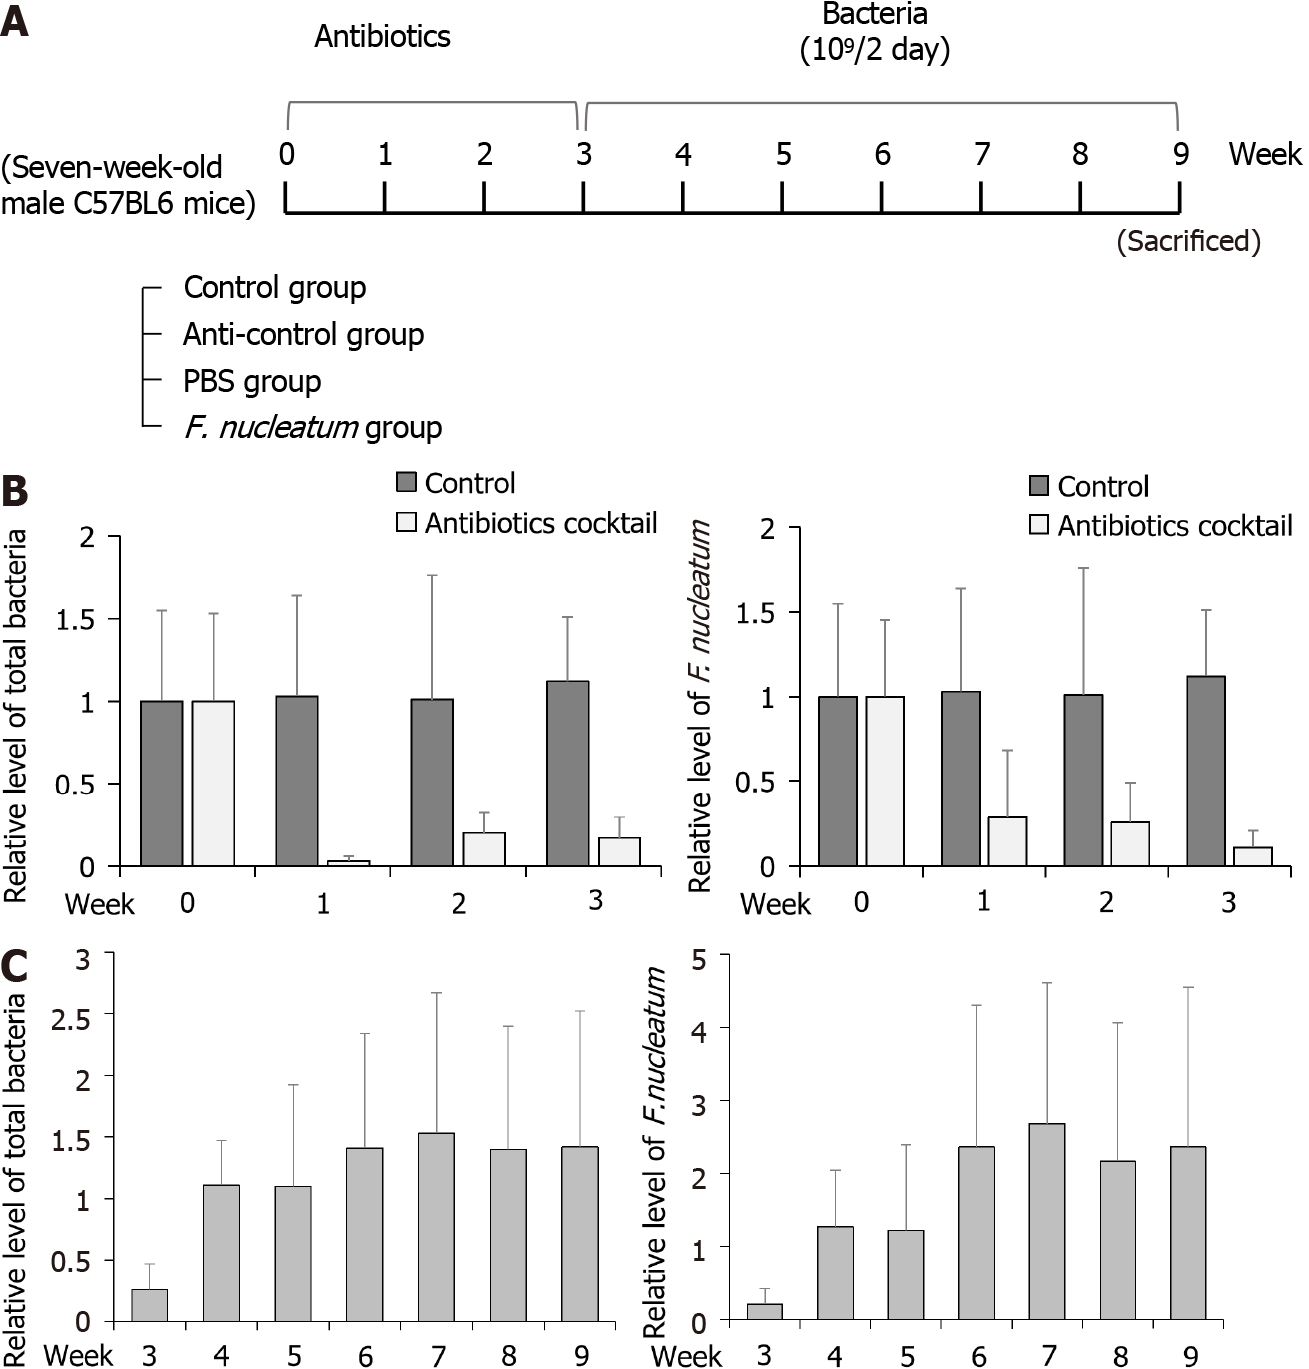
Figure 2 Experimental design.
A: Mice were divided into four goups: Control, anti-control (antibiotics only), phosphate-buffered saline (PBS) (PBS after antibiotics), and Fusobacterium nucleatum (F. nucleatum) (F. nucleatum after antibiotics). The mice were treated with broad-spectrum antibiotics for 3 wk (except control), F. nucleatum was introduced to mice every 2 d for 6 wk by oral gavage; B: After treatments, the levels of total gut bacteria (left) and F. nucleatum (right) were evaluated; C: After administration of F. nucleatum, levels of total bacteria (left) and F. nucleatum (right) in mice were again evaluated. Data are expressed as means ± SD of three independent experiments. PBS: Phosphate-buffered saline.
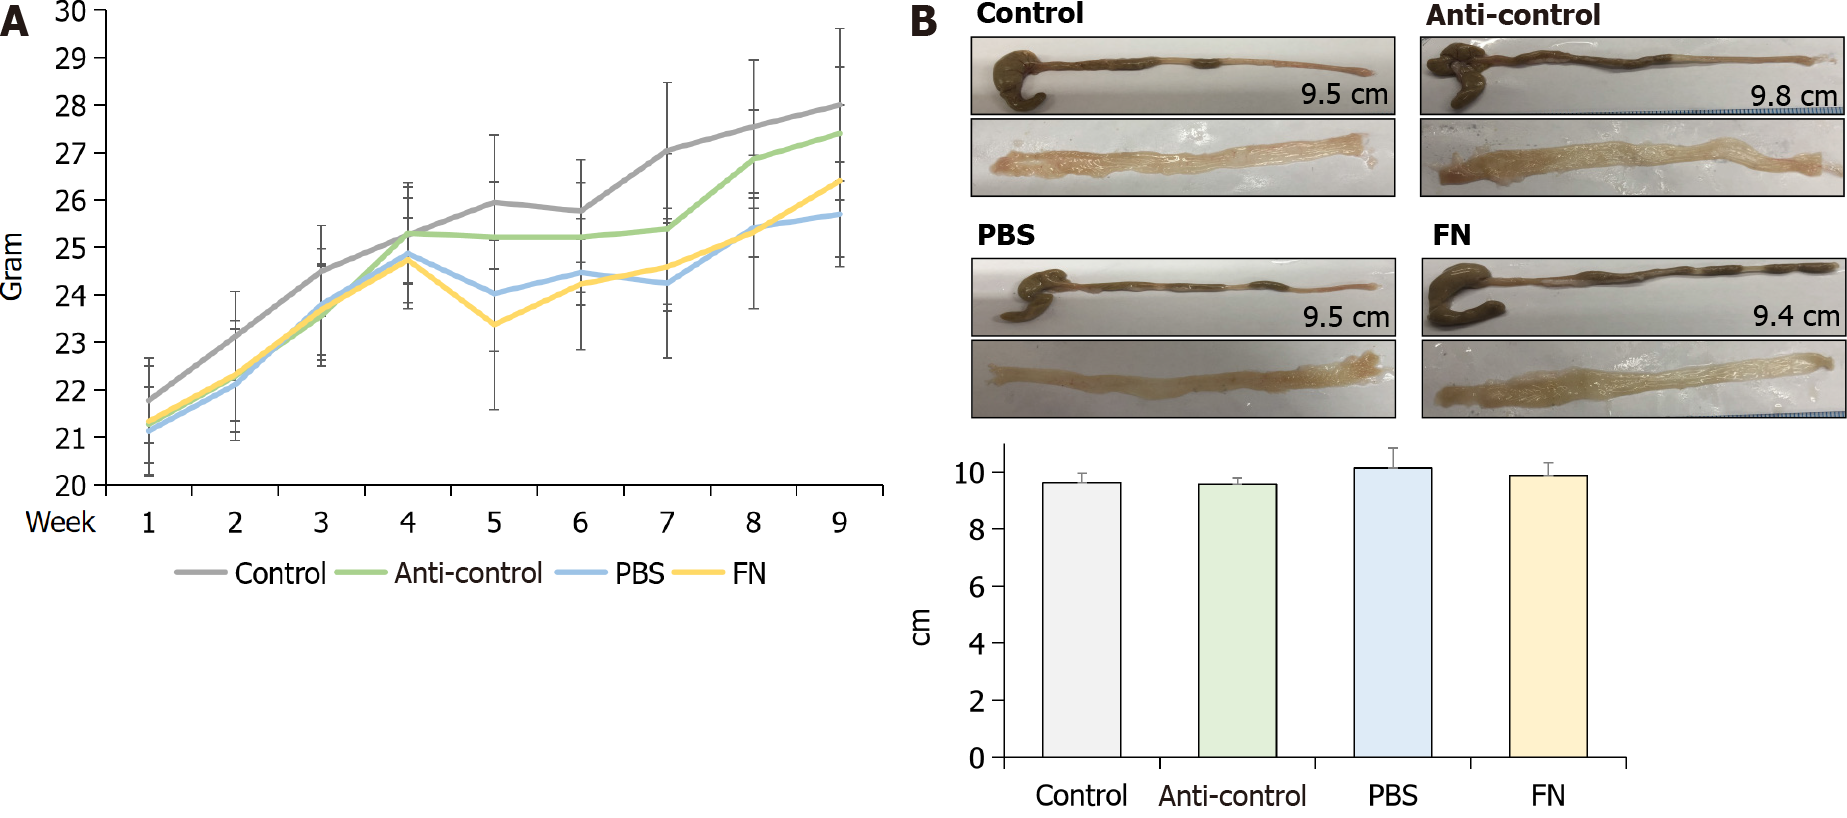
Figure 3 Body weight, colon length, and mucosal surface among the experimental groups.
A: Weights of mice; B: Colon length and mucosal surface. PBS: Phosphate-buffered saline; FN: F. nucleatum.
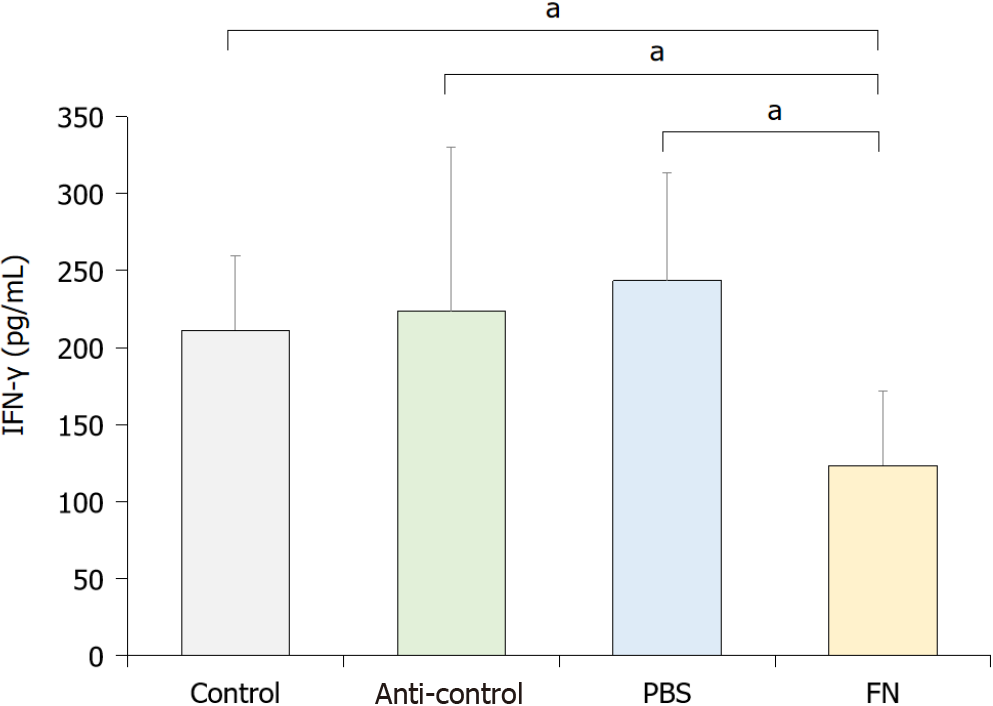
Figure 4 Blood levels of interferon-gamma.
To indirectly evaluate the activity of natural killer cells, whole blood from each mouse was collected at necropsy and levels of interferon-gamma evaluated by ELISA. Data are expressed as means ± SD of three independent experiments. Value significantly different at aP < 0.05. IFN-γ: Interferon-gamma; PBS: Phosphate-buffered saline; FN: F. nucleatum.
Figure 5 Intestinal levels of CD3 and NKp46 cells.
A: CD3+ cells; B: NKp46+ cells. Data are expressed as means ± SD of three independent experiments. Value significantly different at aP < 0.05. NK: Natural killer; PBS: Phosphate-buffered saline; FN: F. nucleatum.
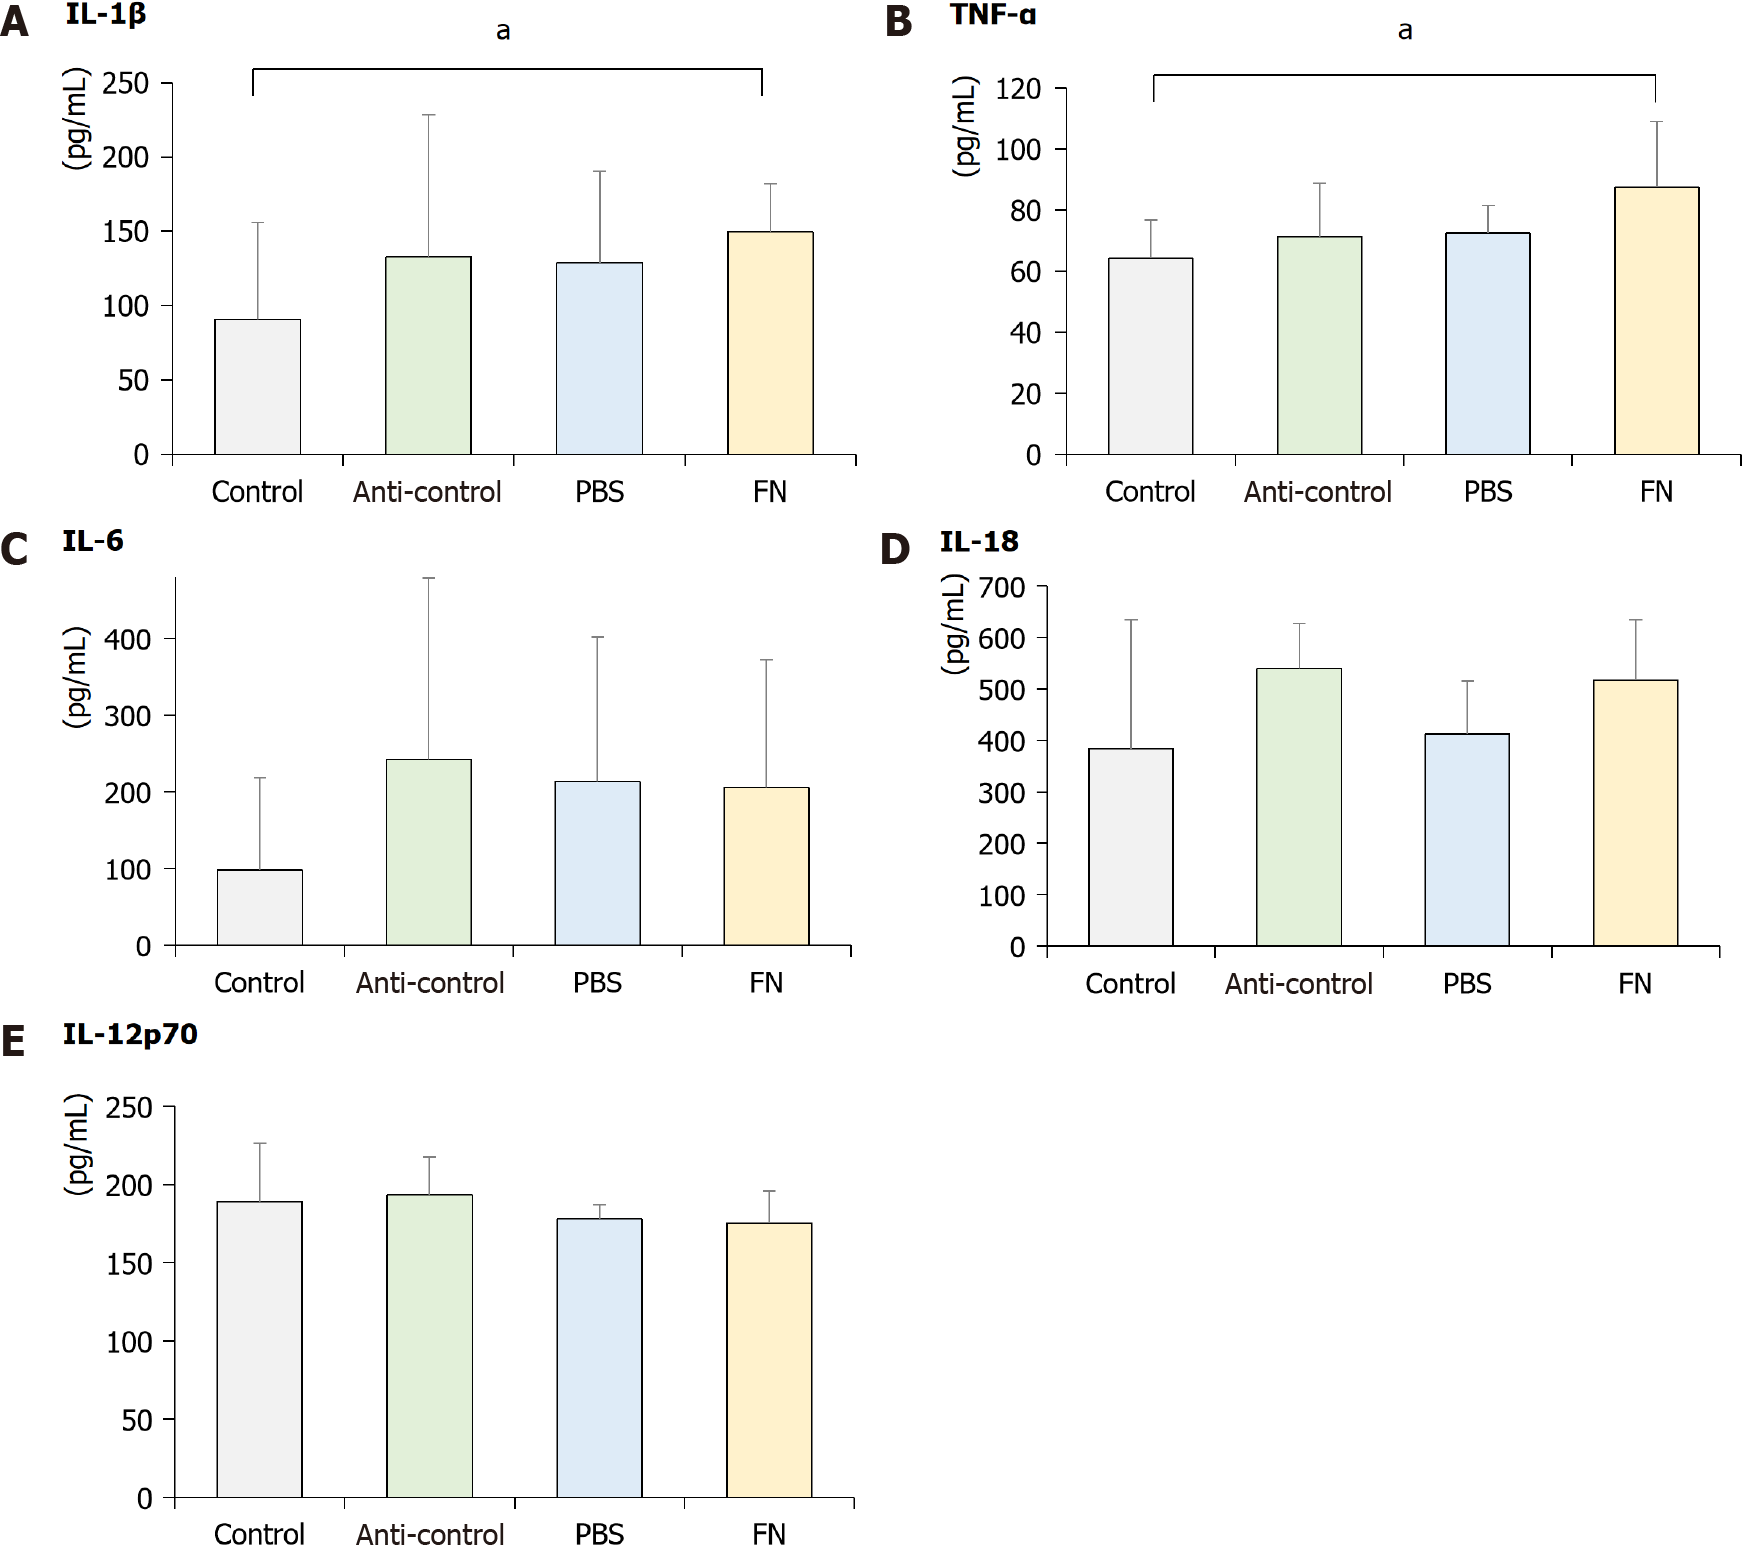
Figure 6 Plasma pro-inflammatory cytokine levels.
A: Interleukin (IL)-1β; B: Tumor necrosis factor-α; C: IL-6; D: IL-18; E: IL-12p70. Data are expressed as means ± SD of three independent experiments. Value significantly different at aP < 0.05. PBS: Phosphate-buffered saline; FN: F. nucleatum; IL: Interleukin; TNF-α: Tumor necrosis factor-α.
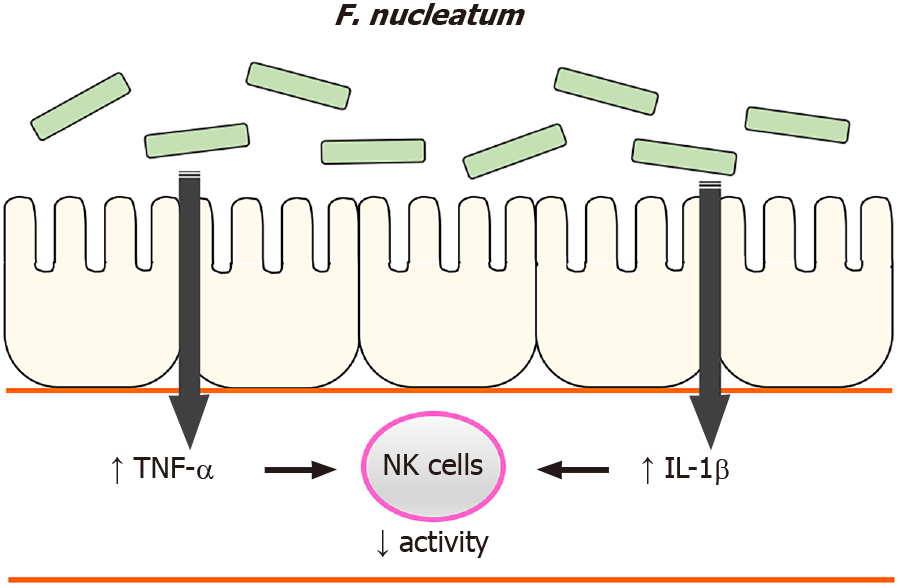
Figure 7 A possible mechanism.
High levels of F. nucleatum in the gastrointestinal tract induce an increase in plasma pro-inflammatory cytokines, which reduces natural killer cell activity. IL: Interleukin; TNF-α: Tumor necrosis factor-α; NK: Natural killer.
- Citation: Kim YJ, Kim BK, Park SJ, Kim JH. Impact of Fusobacterium nucleatum in the gastrointestinal tract on natural killer cells. World J Gastroenterol 2021; 27(29): 4879-4889
- URL: https://www.wjgnet.com/1007-9327/full/v27/i29/4879.htm
- DOI: https://dx.doi.org/10.3748/wjg.v27.i29.4879


