Copyright
©The Author(s) 2020.
World J Gastroenterol. Oct 21, 2020; 26(39): 5970-5982
Published online Oct 21, 2020. doi: 10.3748/wjg.v26.i39.5970
Published online Oct 21, 2020. doi: 10.3748/wjg.v26.i39.5970
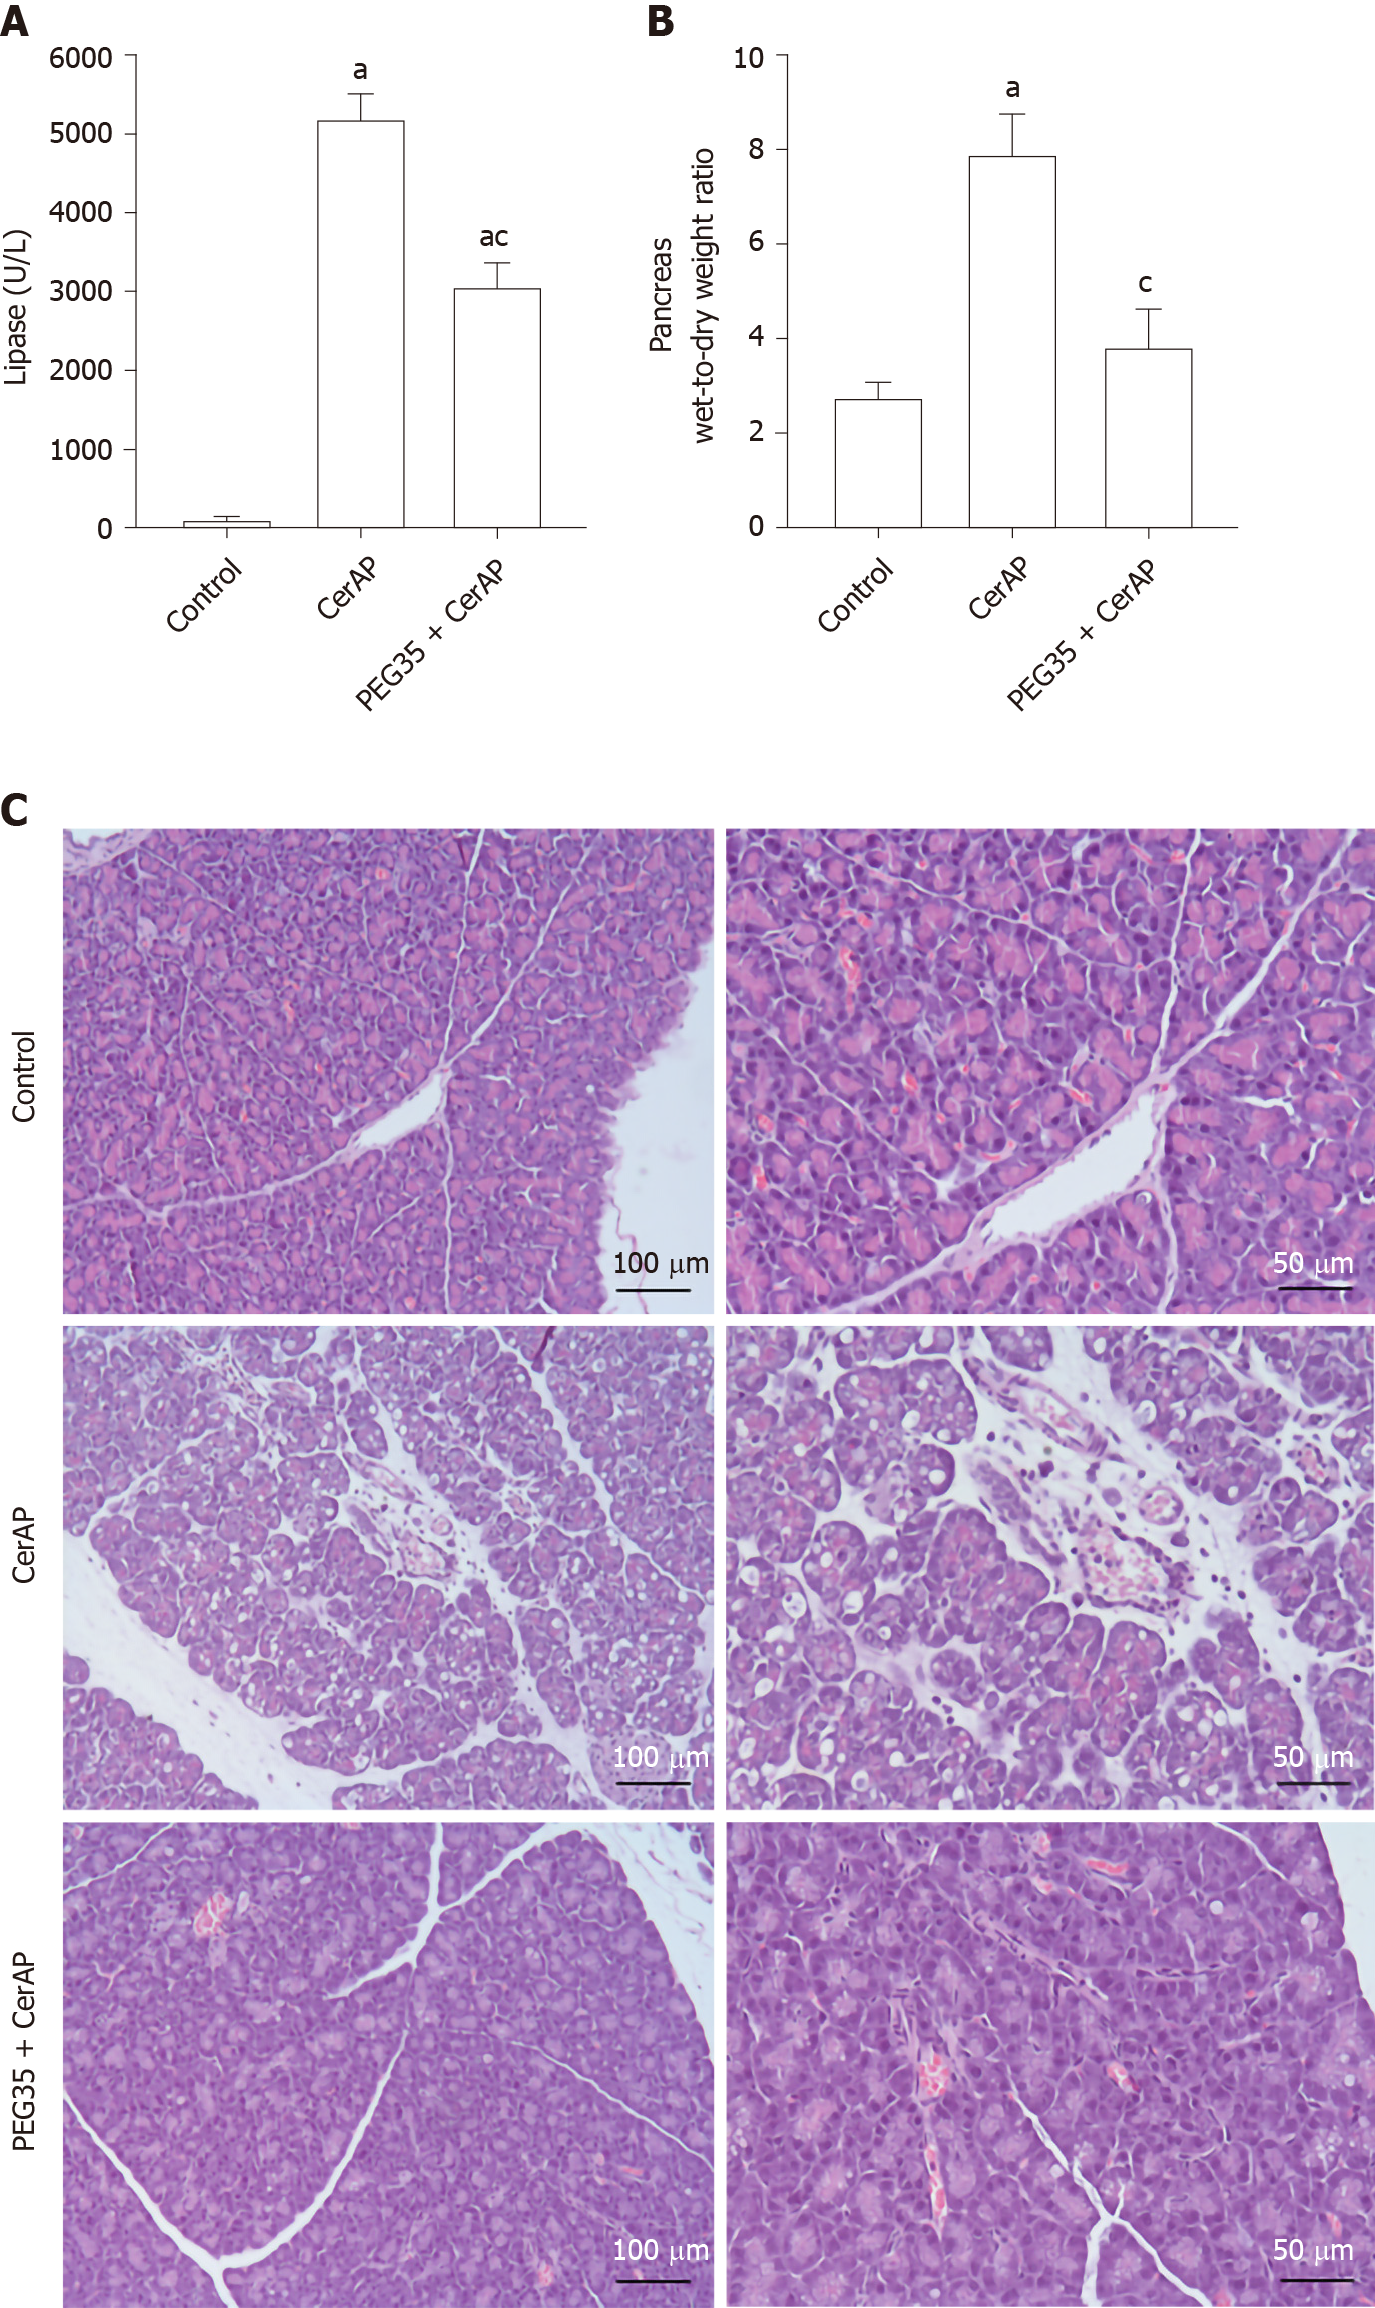
Figure 1 Effect of PEG35 treatment on plasma lipase activity, pancreatic edema and histological changes in experimental cerulein-induced acute pancreatitis.
A: Plasma lipase levels in U/L; B: Pancreatic wet-to-dry weight ratio. Bars represent mean values of each group ± SEM. aP < 0.05 vs control, cP < 0.05 vs Cerulein-induced acute pancreatitis (CerAP). Each determination was carried out in triplicate; C: Representative images of hematoxylin and eosin-stained pancreatic sections for each experimental group. Control group showed normal pancreas structure. CerAP group presented areas of necrosis, infiltrated polymorphonuclear neutrophils, interstitial edema and vacuolation of the acinar cells. Administration of 35-kDa polyethylene glycol notably reduced these features. Scale bar, 100 and 50 μm. CerAP: Cerulein-induced acute pancreatitis; PEG35: 35-kDa polyethylene glycol.
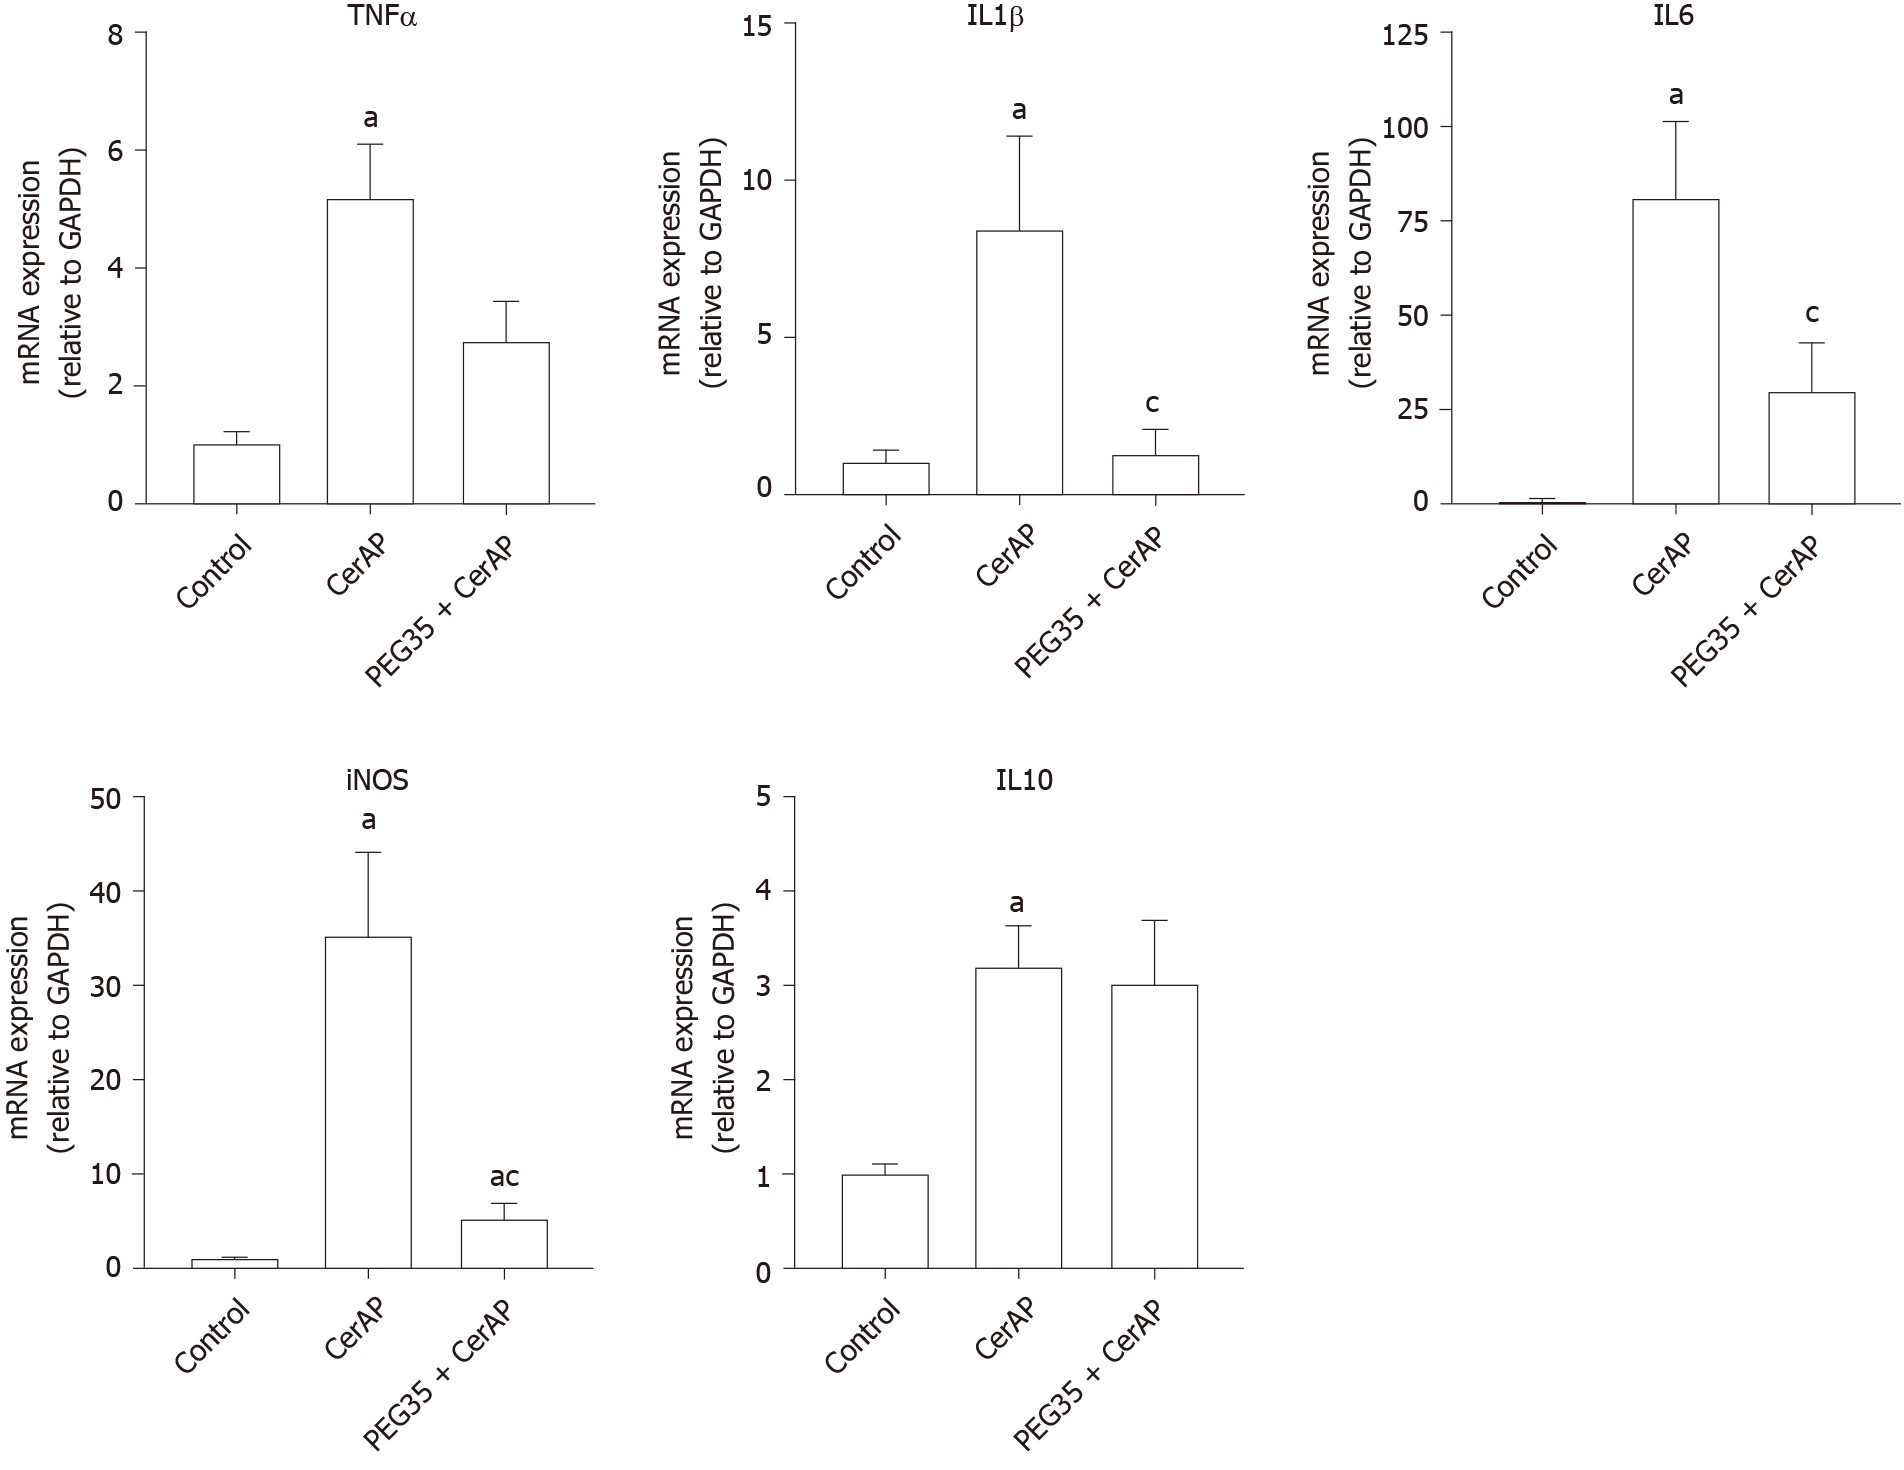
Figure 2 Role of PEG35 on the modulation of inflammation-associated cytokines and inducible nitric oxide synthase enzyme expression in cerulein-induced acute pancreatitis.
Pancreatic tissue gene expression of tumor necrosis factor α, interleukin (IL) 1β, IL6, inducible nitric oxide synthase and IL10 by real-time qRT-PCR. Bars represent mean values of each group ± SEM. aP < 0.05 vs control, cP < 0.05 vs cerulein-induced acute pancreatitis. Each determination was carried out in triplicate. CerAP: Cerulein-induced acute pancreatitis; PEG35: 35-kDa polyethylene glycol.
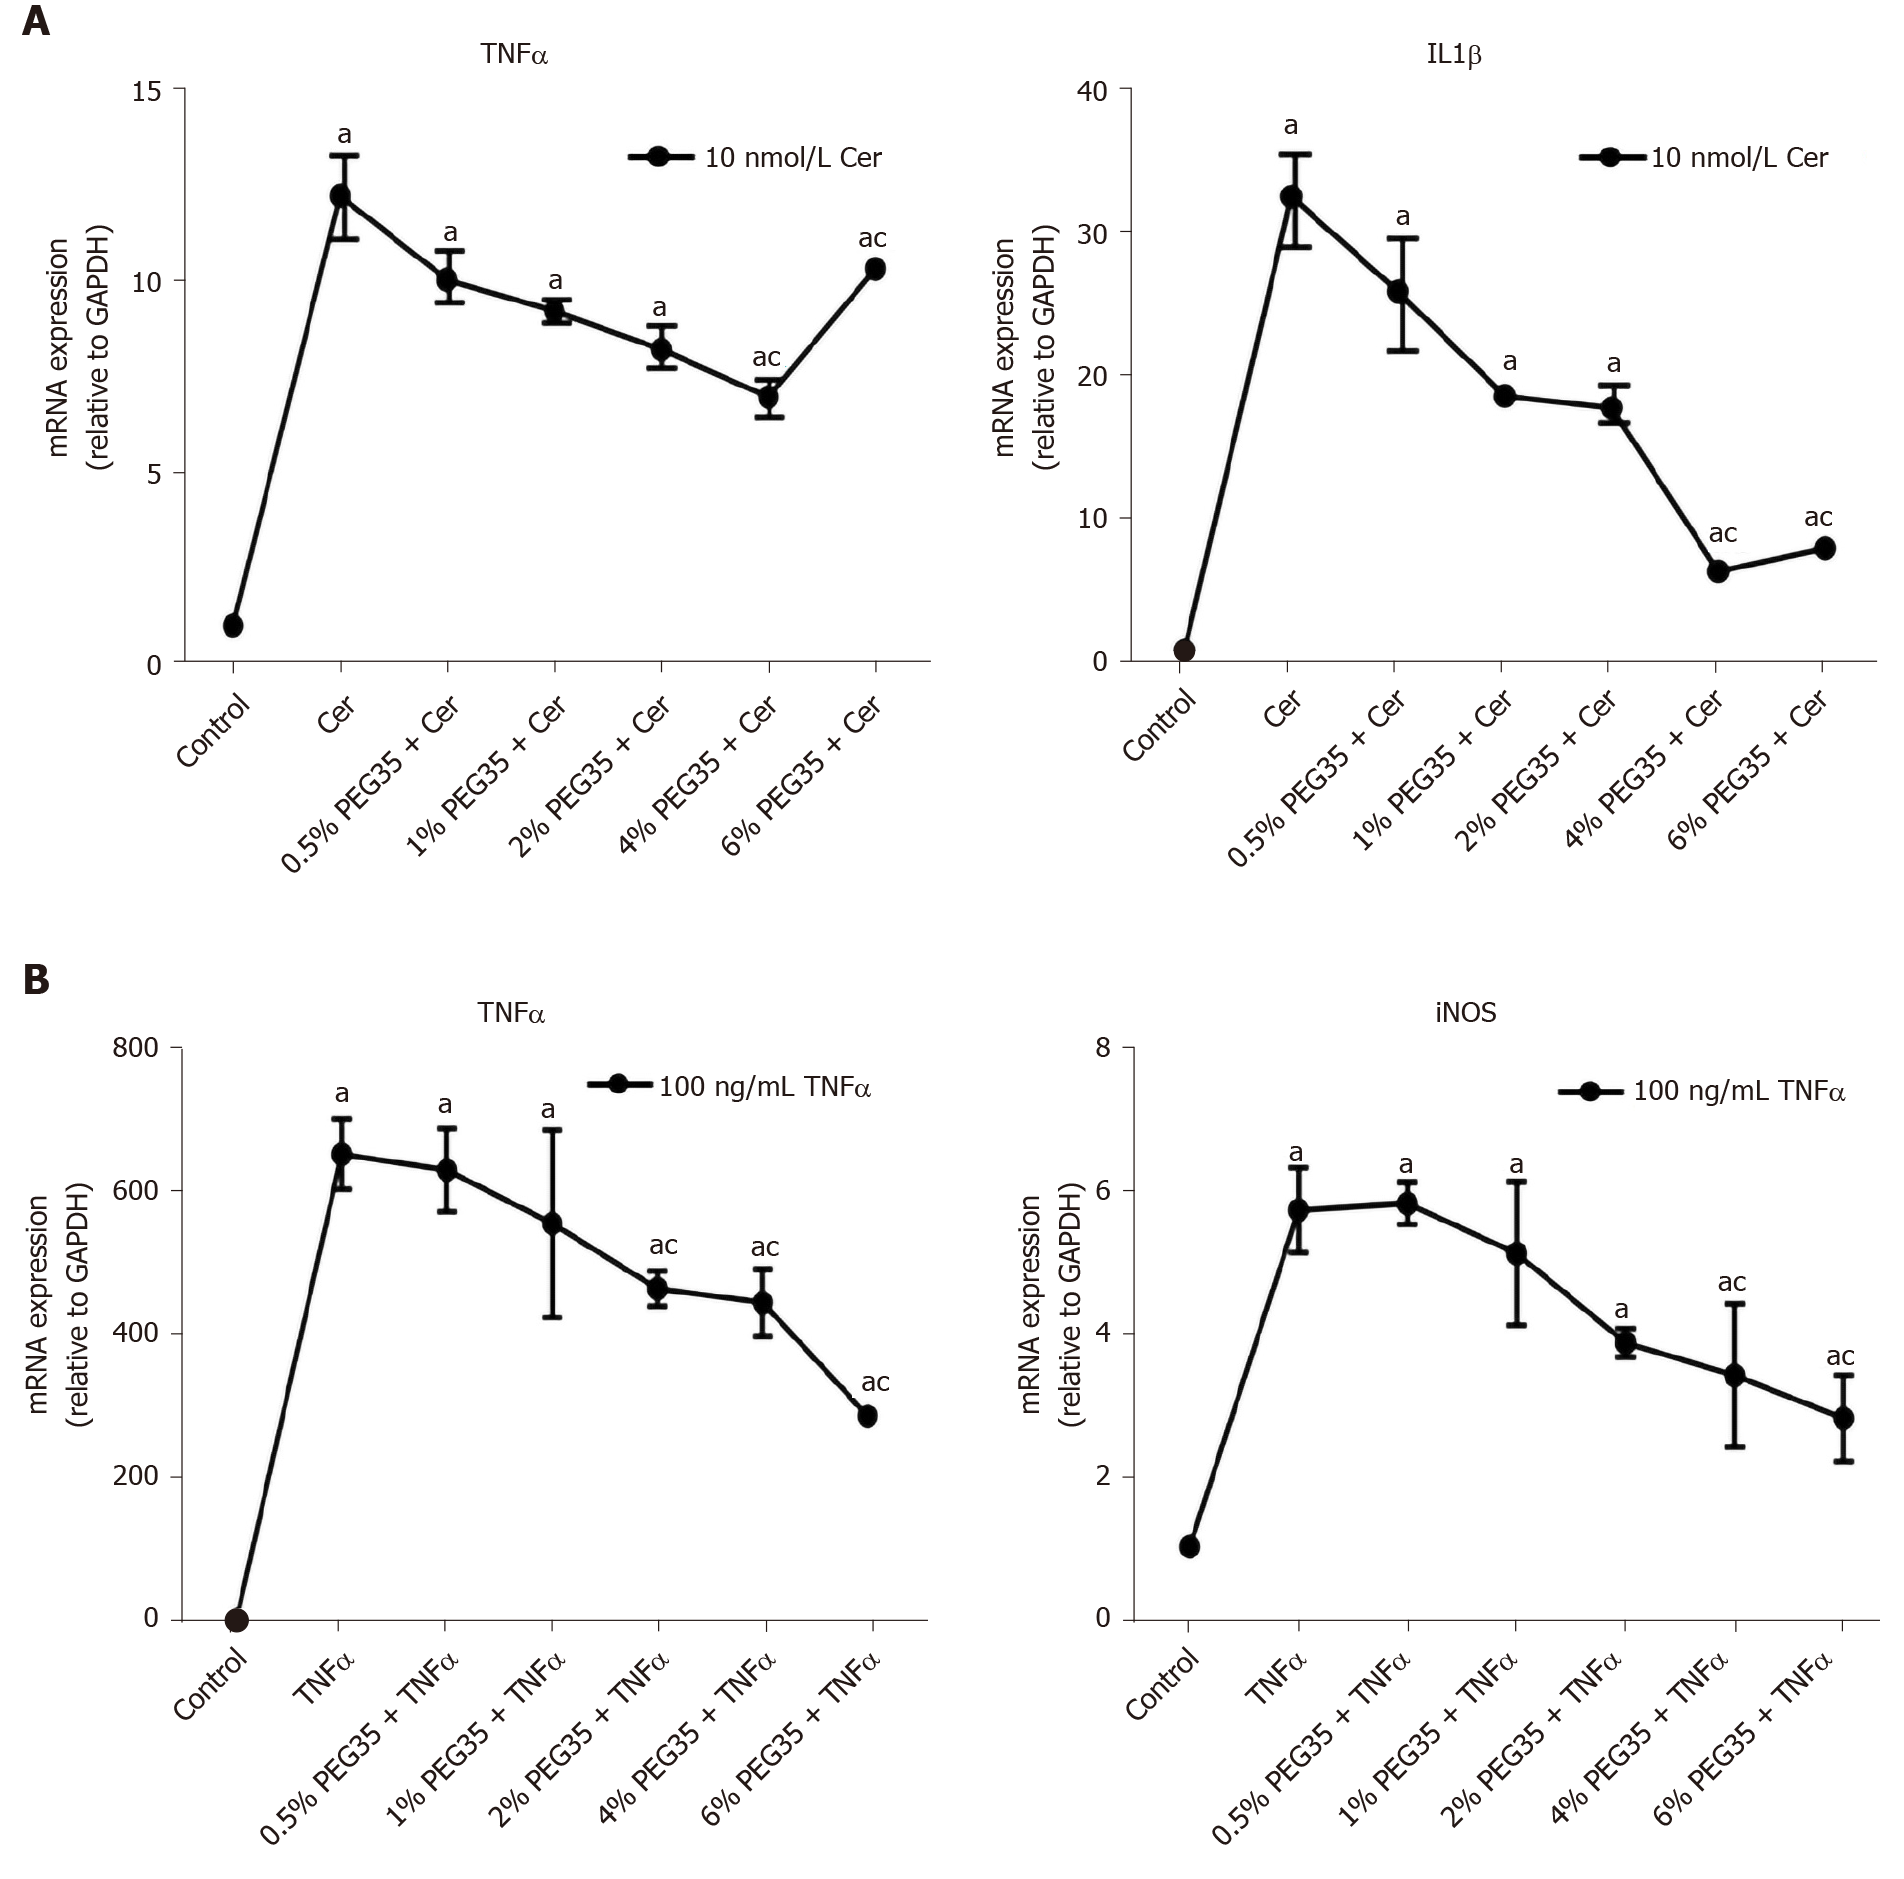
Figure 3 Gene expressions of inflammatory markers in AR42J-treated cells.
A: Gene expression by real-time qRT-PCR of tumor necrosis factor α (TNFα) and IL1β in cerulein-treated AR42J cells subjected to increasing concentrations of 35-kDa polyethylene glycol (PEG35); B: Gene expression by real-time qRT-PCR of TNFα and inducible nitric oxide synthase in TNFα-treated AR42J cells subjected to increasing concentrations of PEG35. In both cases, mRNA induction levels were normalized to GAPDH mRNA expression. Bars represent mean values of each group ± SEM. aP < 0.05 vs control, cP < 0.05 vs cerulein or TNFα. Each determination was carried out in triplicate. Cer: Cerulein; PEG35: 35-kDa polyethylene glycol; TNFα: Tumor necrosis factor α.
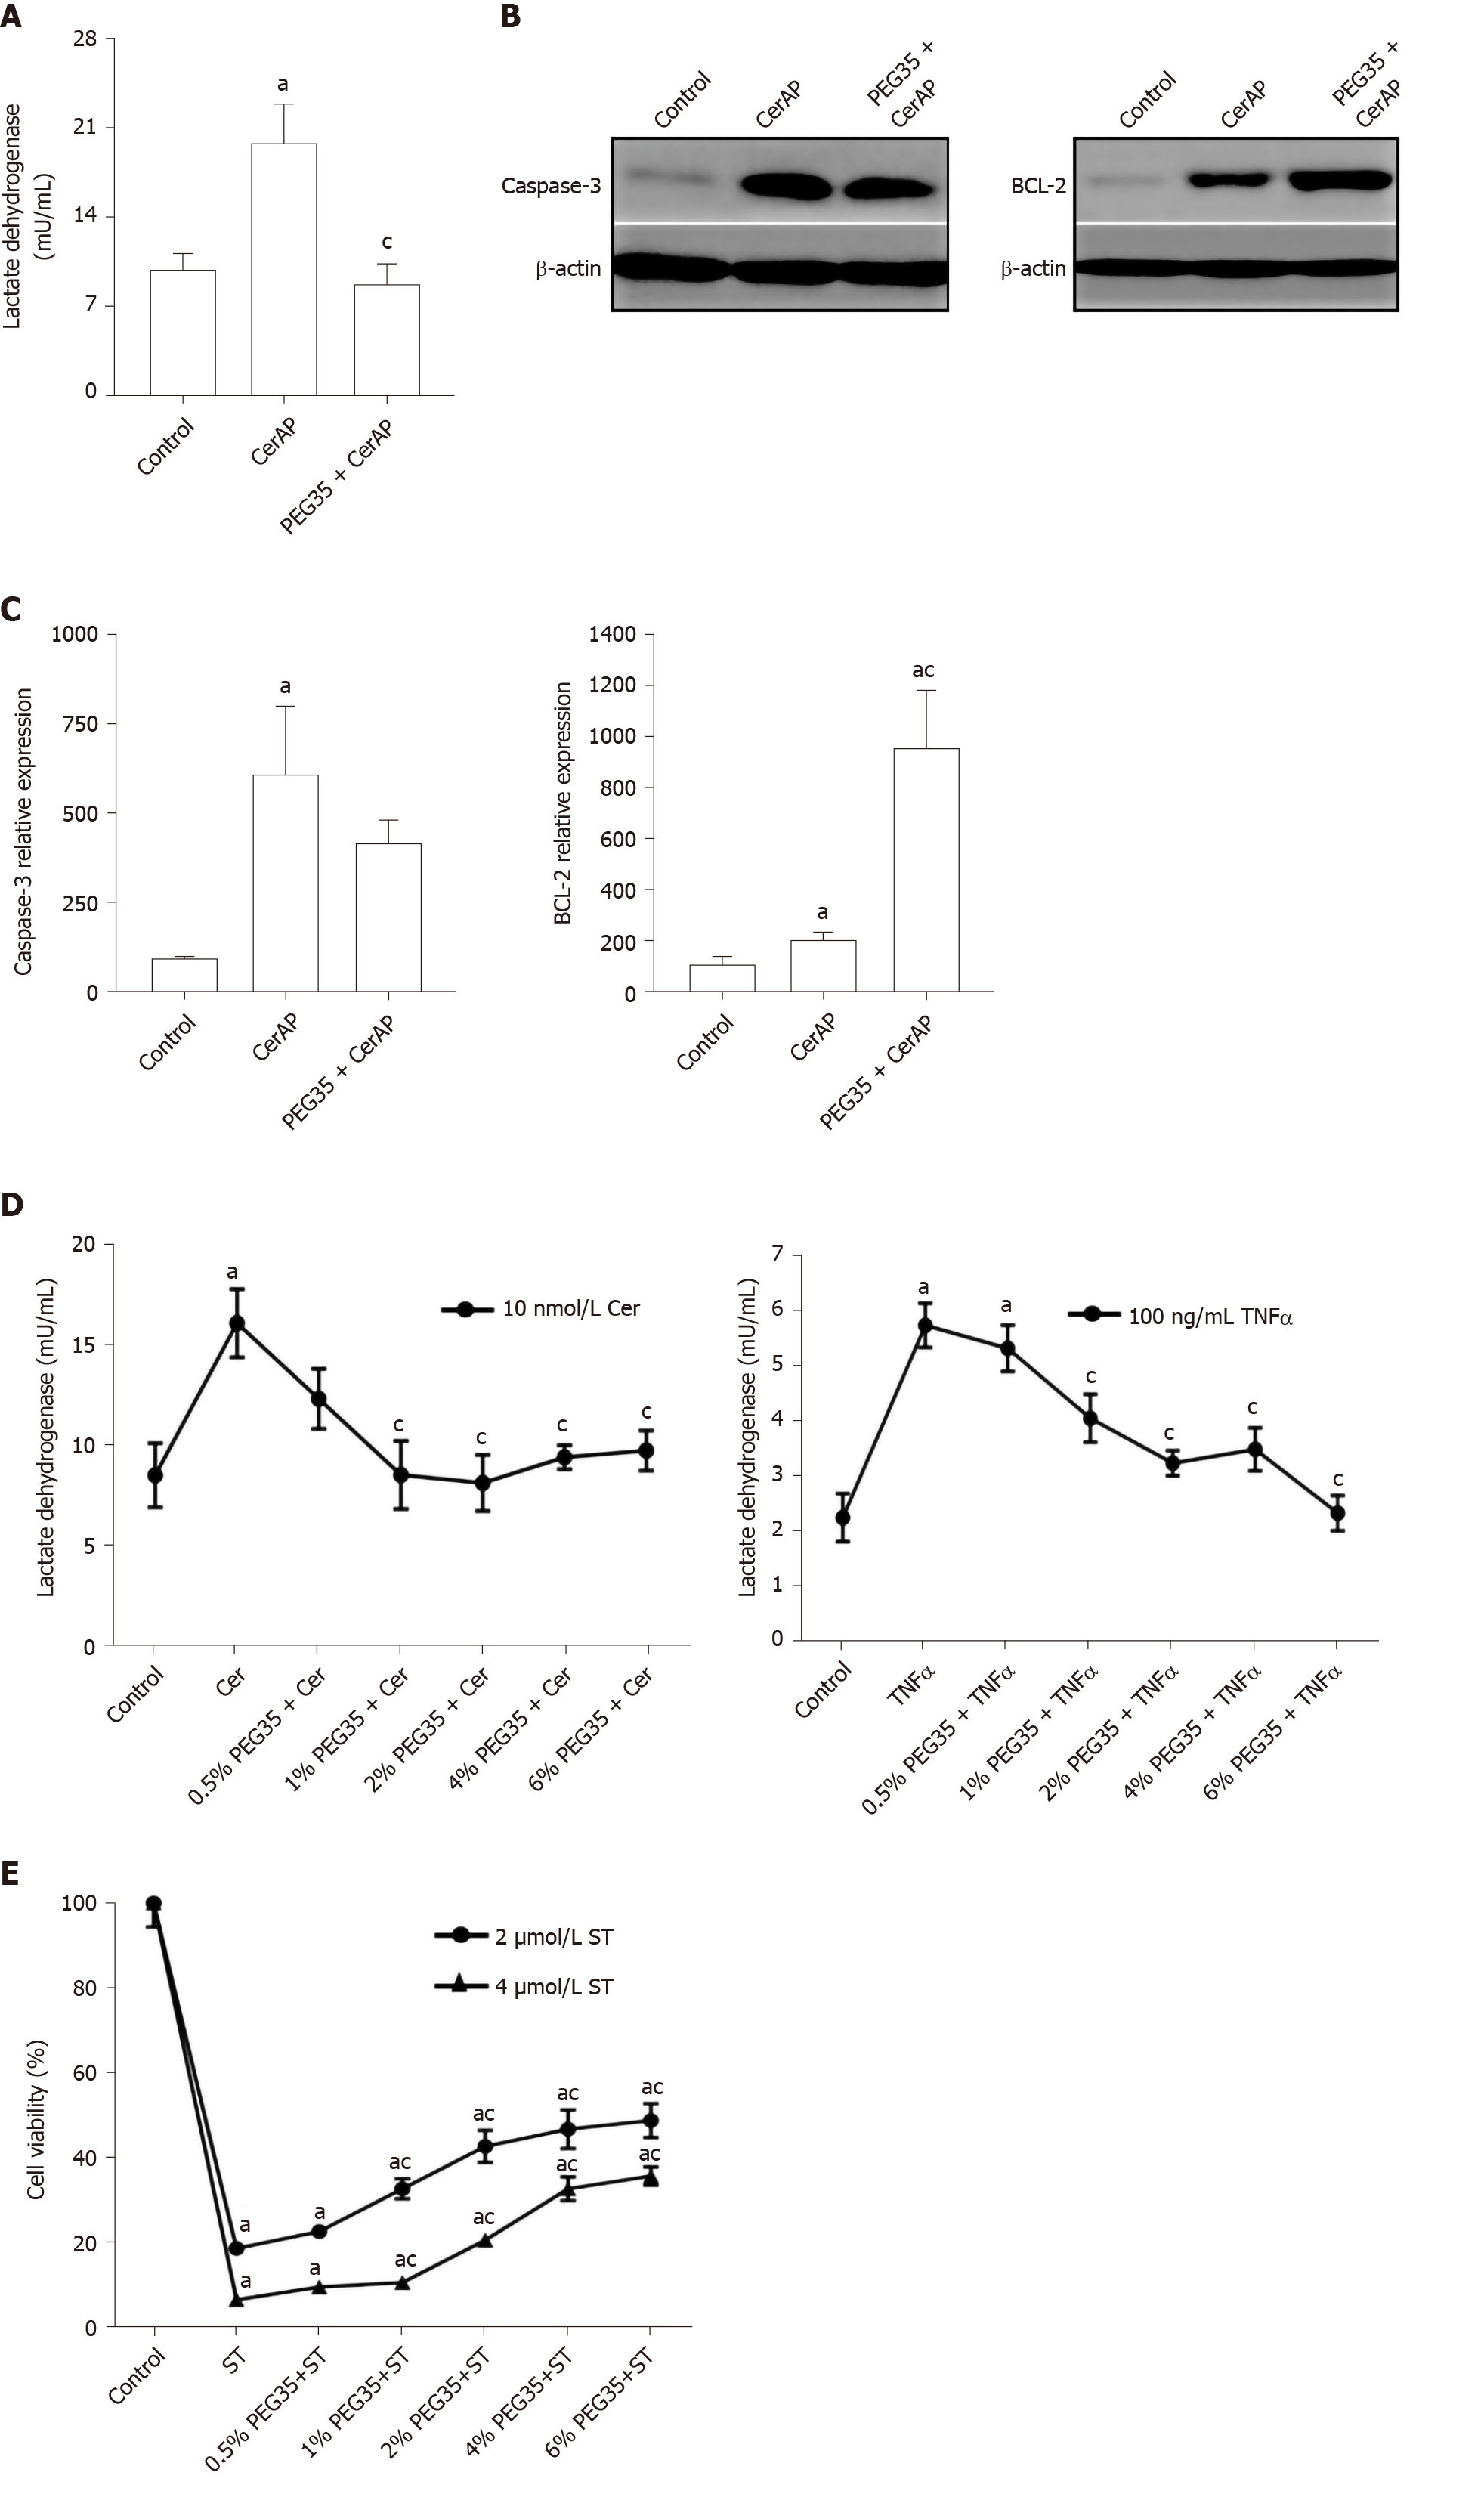
Figure 4 Effect of 35-kDa polyethylene glycol on inflammation-induced cell death in cerulein-induced acute pancreatitis and cultured pancreatic acinar AR42J cells.
A: Plasma lactate dehydrogenase (LDH) activity after cerulein-induced acute pancreatitis expressed as mU/mL; B: Pancreatic protein expression of cleaved caspase-3 and BCL-2 assessed by western blot analysis. β-actin expression was used as loading control. Data shown are representative blots for each group; C: Densitometry quantification of western blot for cleaved caspase-3 and BCL-2 in pancreatic tissue; D: Cell death rate measured through LDH activity. AR42J cells pre-treated with increasing concentrations of PEG35 (0.5%, 1%, 2%, 4% or 6%) for 30 min and then co-incubated with 10nM cerulein for another 24 h or 100 ng/mL of tumor necrosis factor α (TNFα) for another 2.5 h; E: Cell viability rate determined by MTT assay. AR42J cells were pre-treated with increasing concentrations of PEG35, as indicated, for 30 min and then incubated with or without 2 µM or 4 µM staurosporine for another 24 h. The values shown represent the mean ± SEM. aP < 0.05 vs control, cP < 0.05 vs cerulein-induced acute pancreatitis, cerulein, TNFα or staurosporine. Each determination was carried out in triplicate. CerAP: Cerulein-induced acute pancreatitis; Cer: Cerulein; PEG35: 35-kDa polyethylene glycol; TNFα: Tumor necrosis factor α; ST: Staurosporine.
- Citation: Ferrero-Andrés A, Panisello-Roselló A, Roselló-Catafau J, Folch-Puy E. Polyethylene glycol 35 ameliorates pancreatic inflammatory response in cerulein-induced acute pancreatitis in rats. World J Gastroenterol 2020; 26(39): 5970-5982
- URL: https://www.wjgnet.com/1007-9327/full/v26/i39/5970.htm
- DOI: https://dx.doi.org/10.3748/wjg.v26.i39.5970


