Copyright
©The Author(s) 2020.
World J Gastroenterol. Oct 14, 2020; 26(38): 5874-5883
Published online Oct 14, 2020. doi: 10.3748/wjg.v26.i38.5874
Published online Oct 14, 2020. doi: 10.3748/wjg.v26.i38.5874
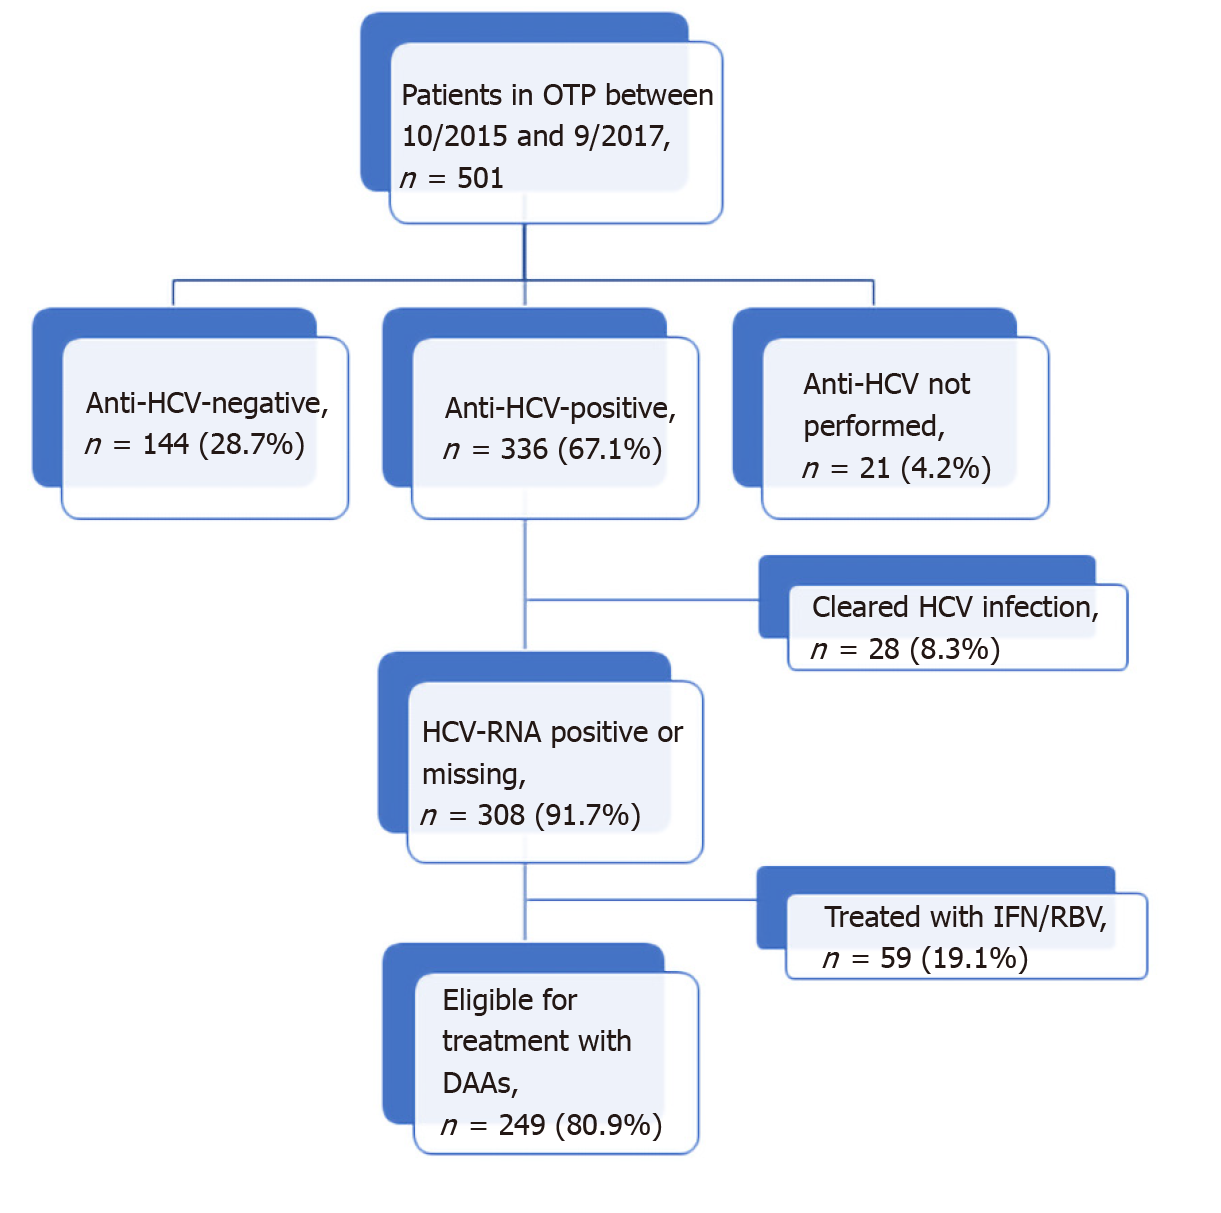
Figure 1 Flowchart of patients visited in the Opioid Treatment Program and hepatitis C virus infection status.
OTP: Opioid Treatment Program; HCV: Hepatitis C virus; DAAs: Direct antiviral agents.
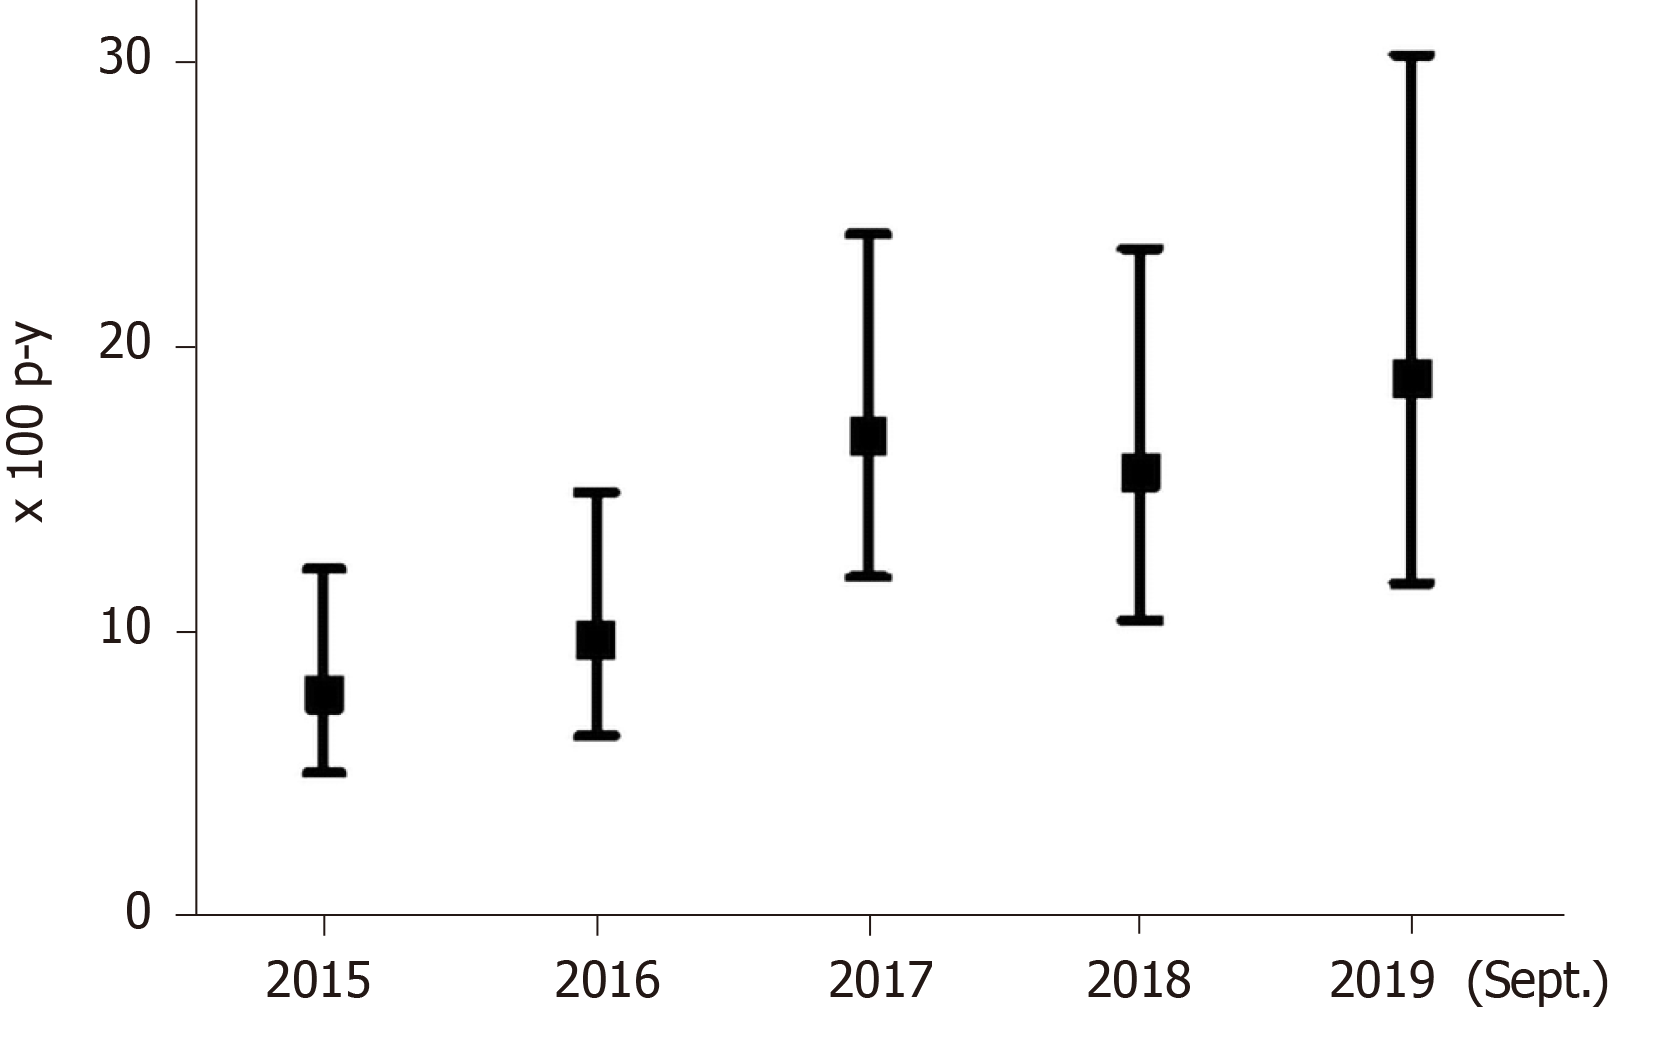
Figure 2 Annual rates of hepatitis C virus treatment with direct antiviral agents in an Opioid Treatment Program.
p-y: Person-years.
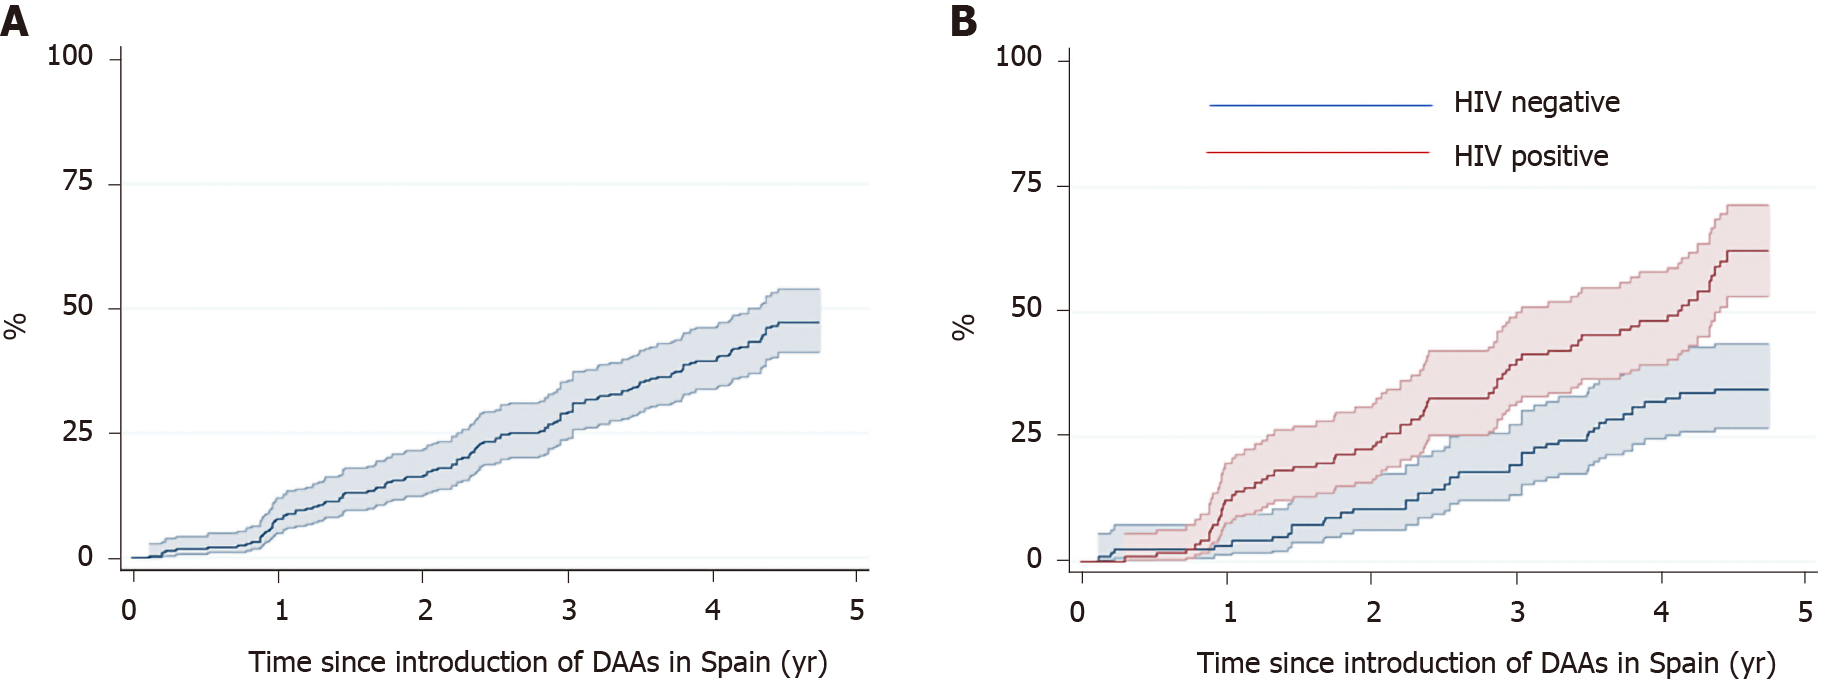
Figure 3 Kaplan Meier estimates (95%CI) of direct antiviral agent treatment for hepatitis C virus.
Plots included (A) all patients and (B) patients with hepatitis C virus (HCV) mono-infection and HCV-human immunodeficiency virus co-infection. HIV: Human immunodeficiency virus; DAAs: Direct antiviral agents.
- Citation: Sanvisens A, Rivas I, Faure E, Espinach N, Hernandez-Rubio A, Majó X, Colom J, Muga R. Monitoring hepatitis C virus treatment rates in an Opioid Treatment Program: A longitudinal study. World J Gastroenterol 2020; 26(38): 5874-5883
- URL: https://www.wjgnet.com/1007-9327/full/v26/i38/5874.htm
- DOI: https://dx.doi.org/10.3748/wjg.v26.i38.5874


