Copyright
©The Author(s) 2020.
World J Gastroenterol. Aug 28, 2020; 26(32): 4866-4877
Published online Aug 28, 2020. doi: 10.3748/wjg.v26.i32.4866
Published online Aug 28, 2020. doi: 10.3748/wjg.v26.i32.4866
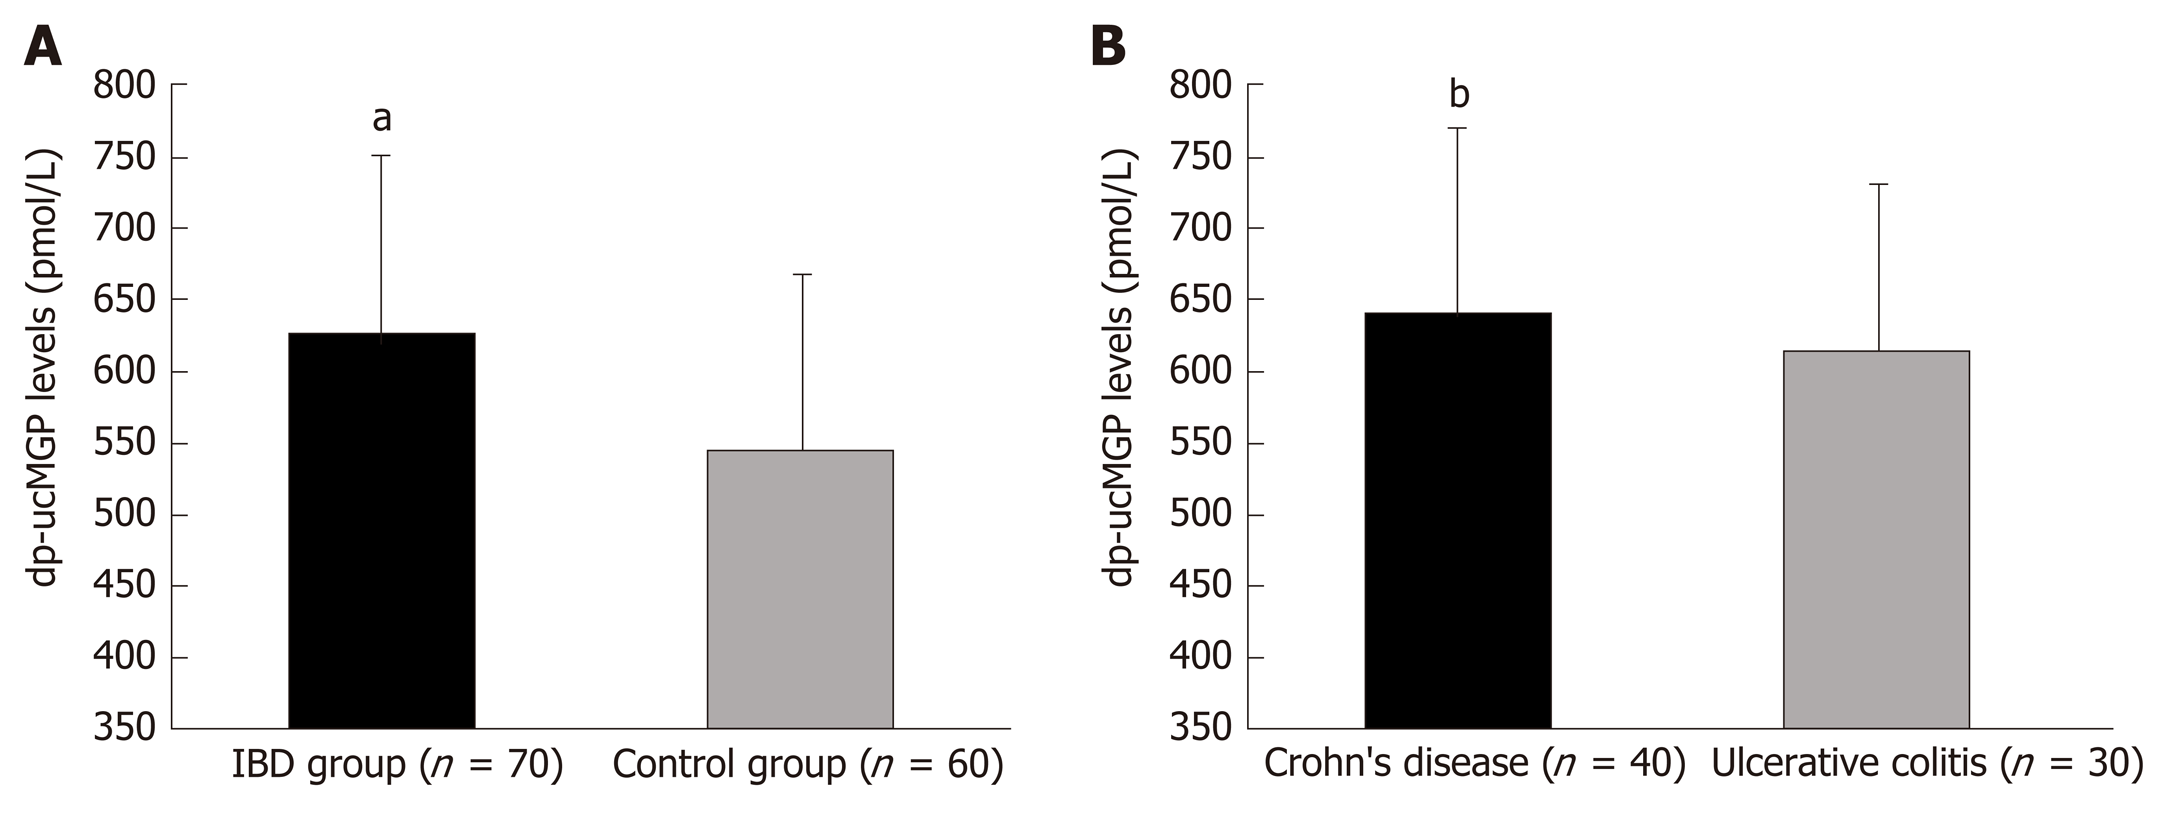
Figure 1 Plasma dephosphorylated and uncarboxylated matrix Gla protein levels in inflammatory bowel disease patients and control group (A) and between patients with Crohn’s disease and ulcerative colitis (B).
aP < 0.001 vs control group; bP = 0.432 vs ulcerative colitis group. dp-ucMGP: Dephosphorylated and uncarboxylated matrix Gla protein.
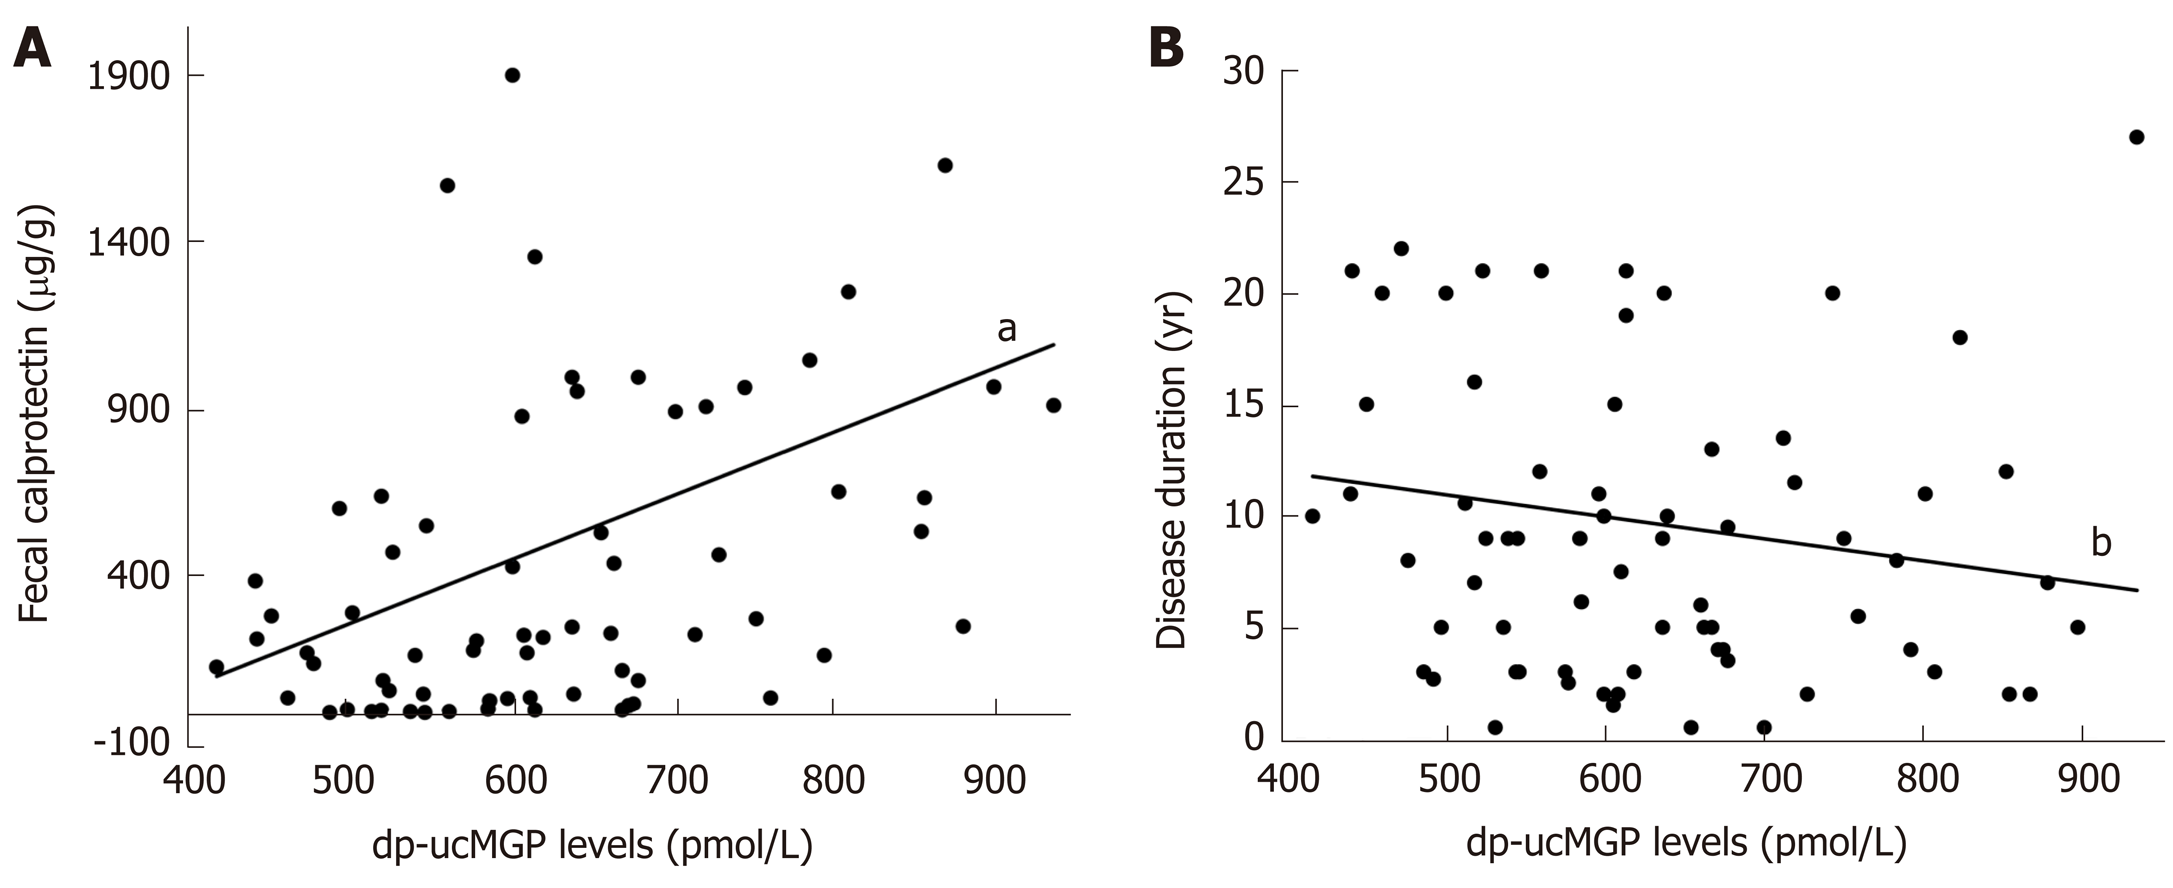
Figure 2 Correlation analysis between plasma dephosphorylated and uncarboxylated matrix Gla protein levels and fecal calprotectin (A) and disease duration (B) in patients with inflammatory bowel disease (n = 70).
aP < 0.001, r = 0.396; bP = 0.115, r = -0.190. dp-ucMGP: Dephosphorylated and uncarboxylated matrix Gla protein.
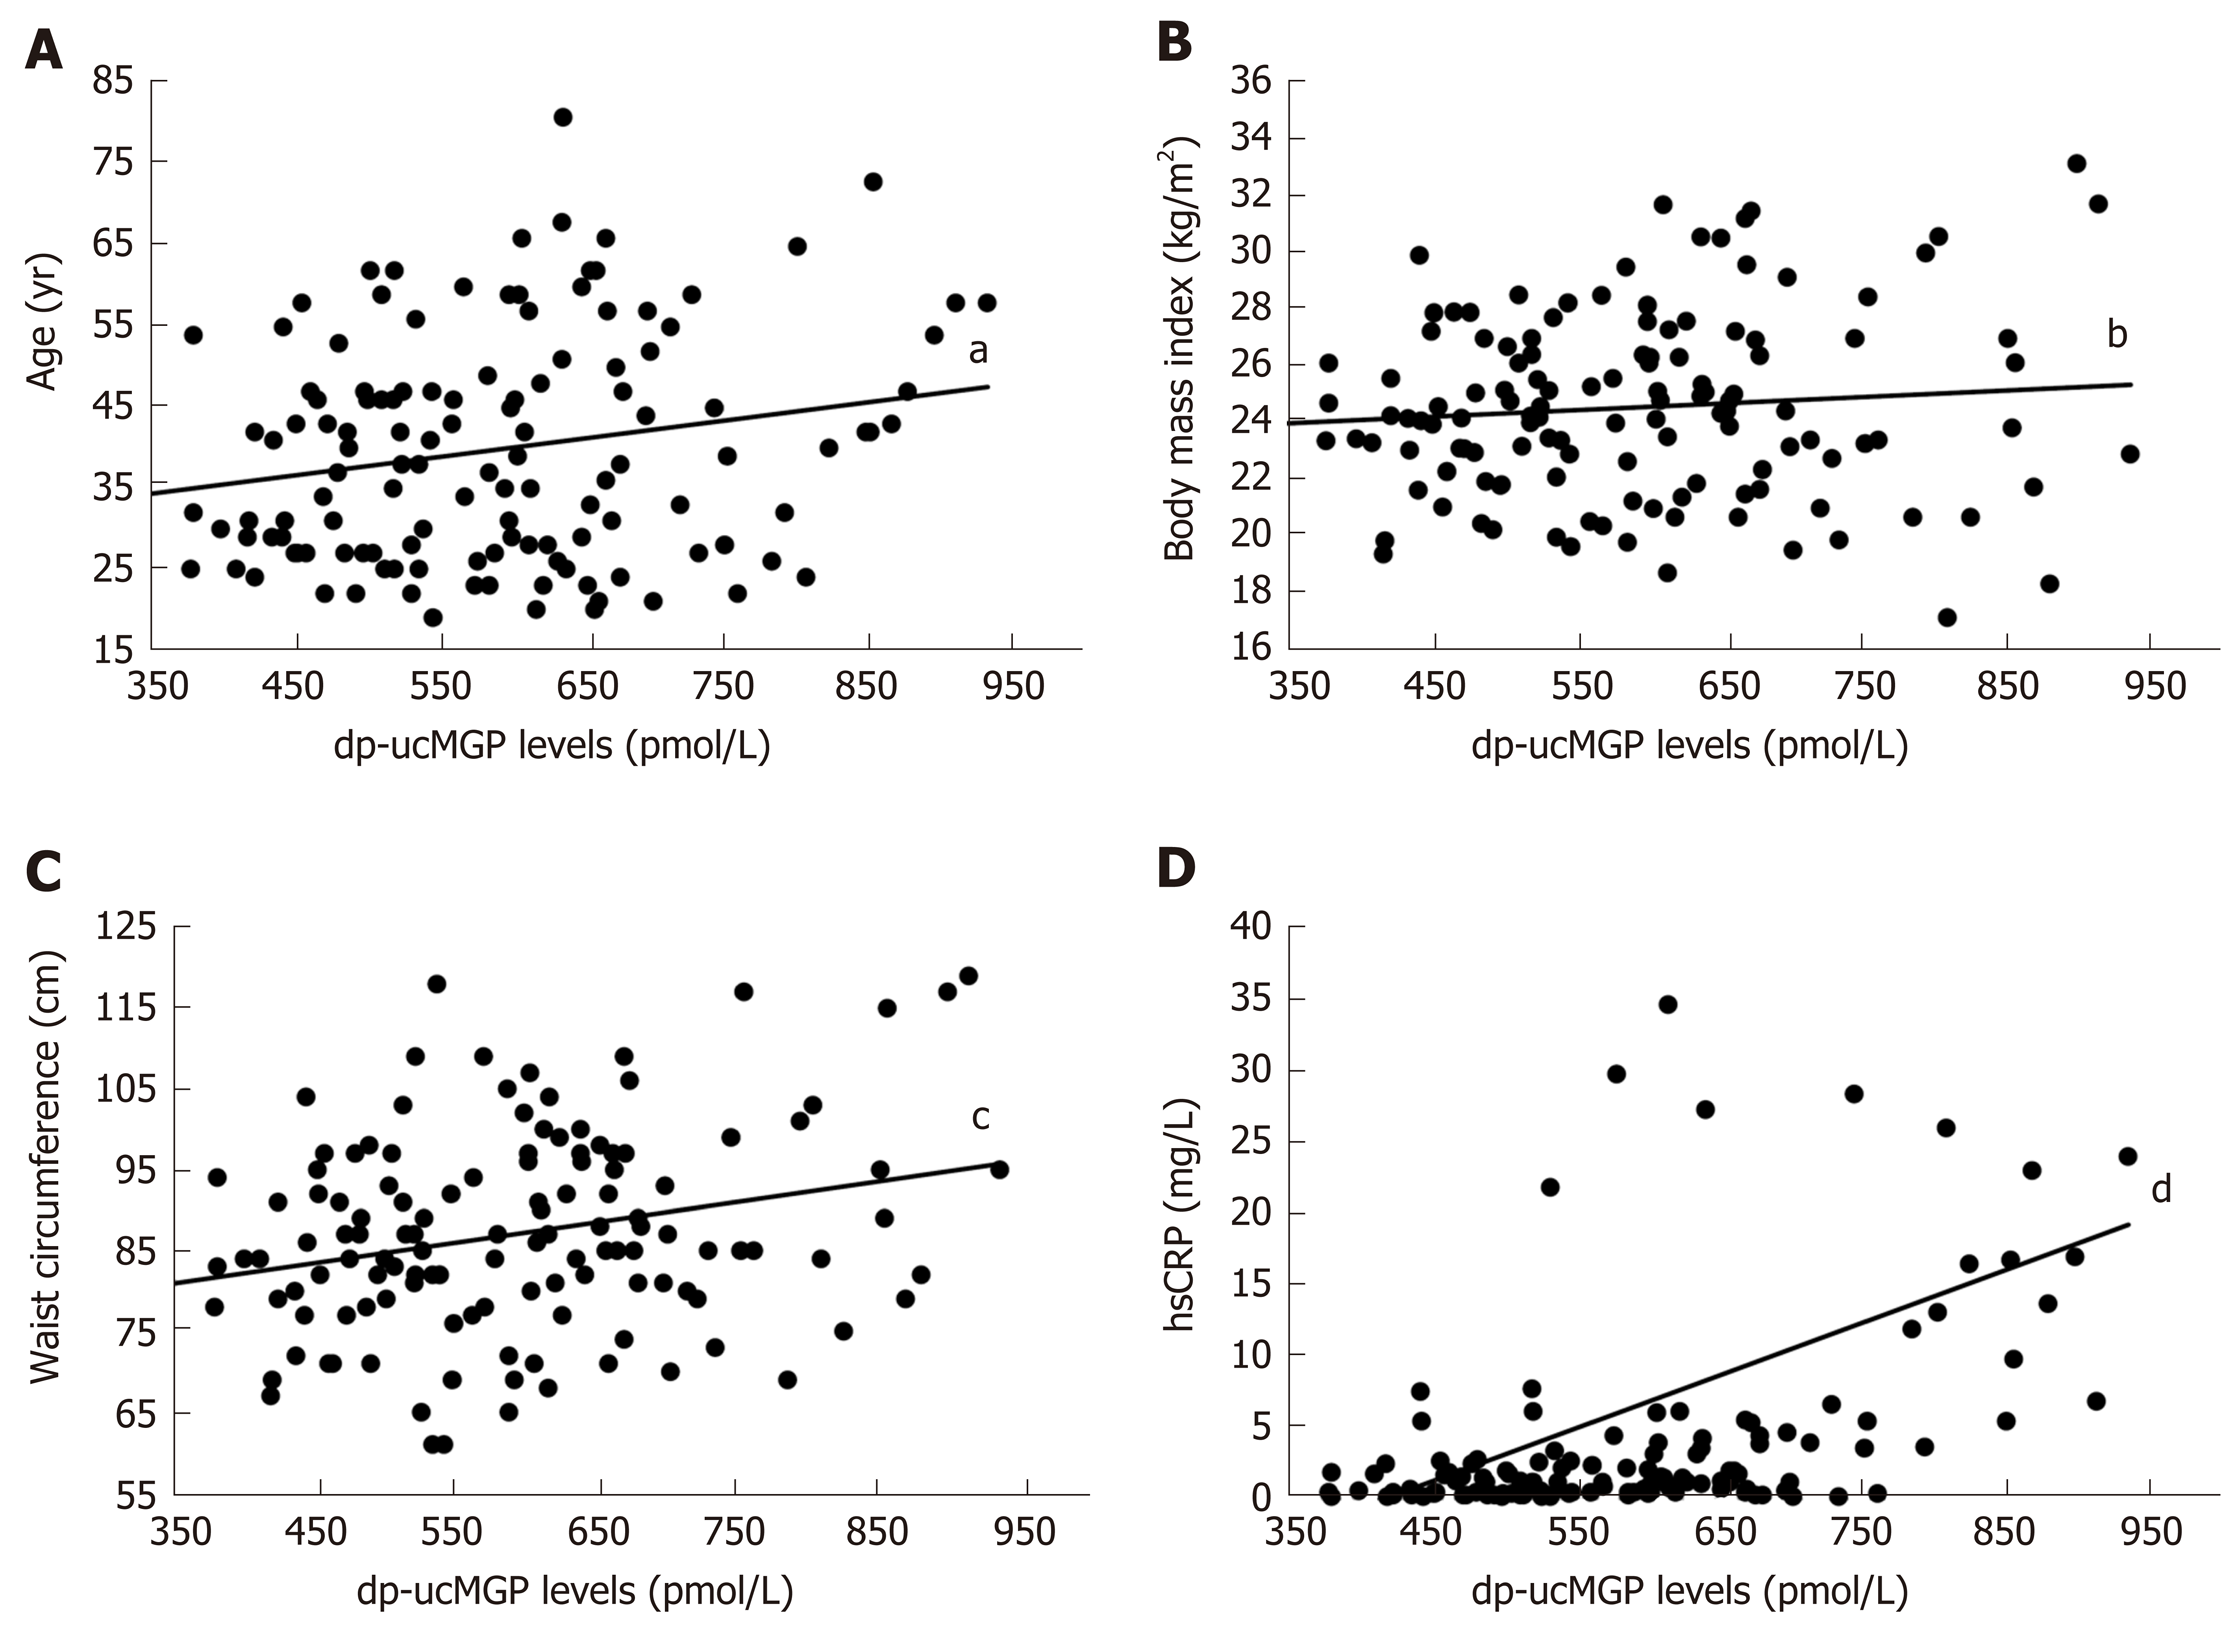
Figure 3 Correlation analysis between plasma dephosphorylated and uncarboxylated matrix Gla protein levels and age (A), body Mass Index (B) waist circumference (C) and hsCRP (D) in total study population (n = 130).
aP = 0.016, r = 0.210; bP = 0.289, r = 0.094; cP = 0.002, r = 0.264; dP < 0.001, r = 0.477.
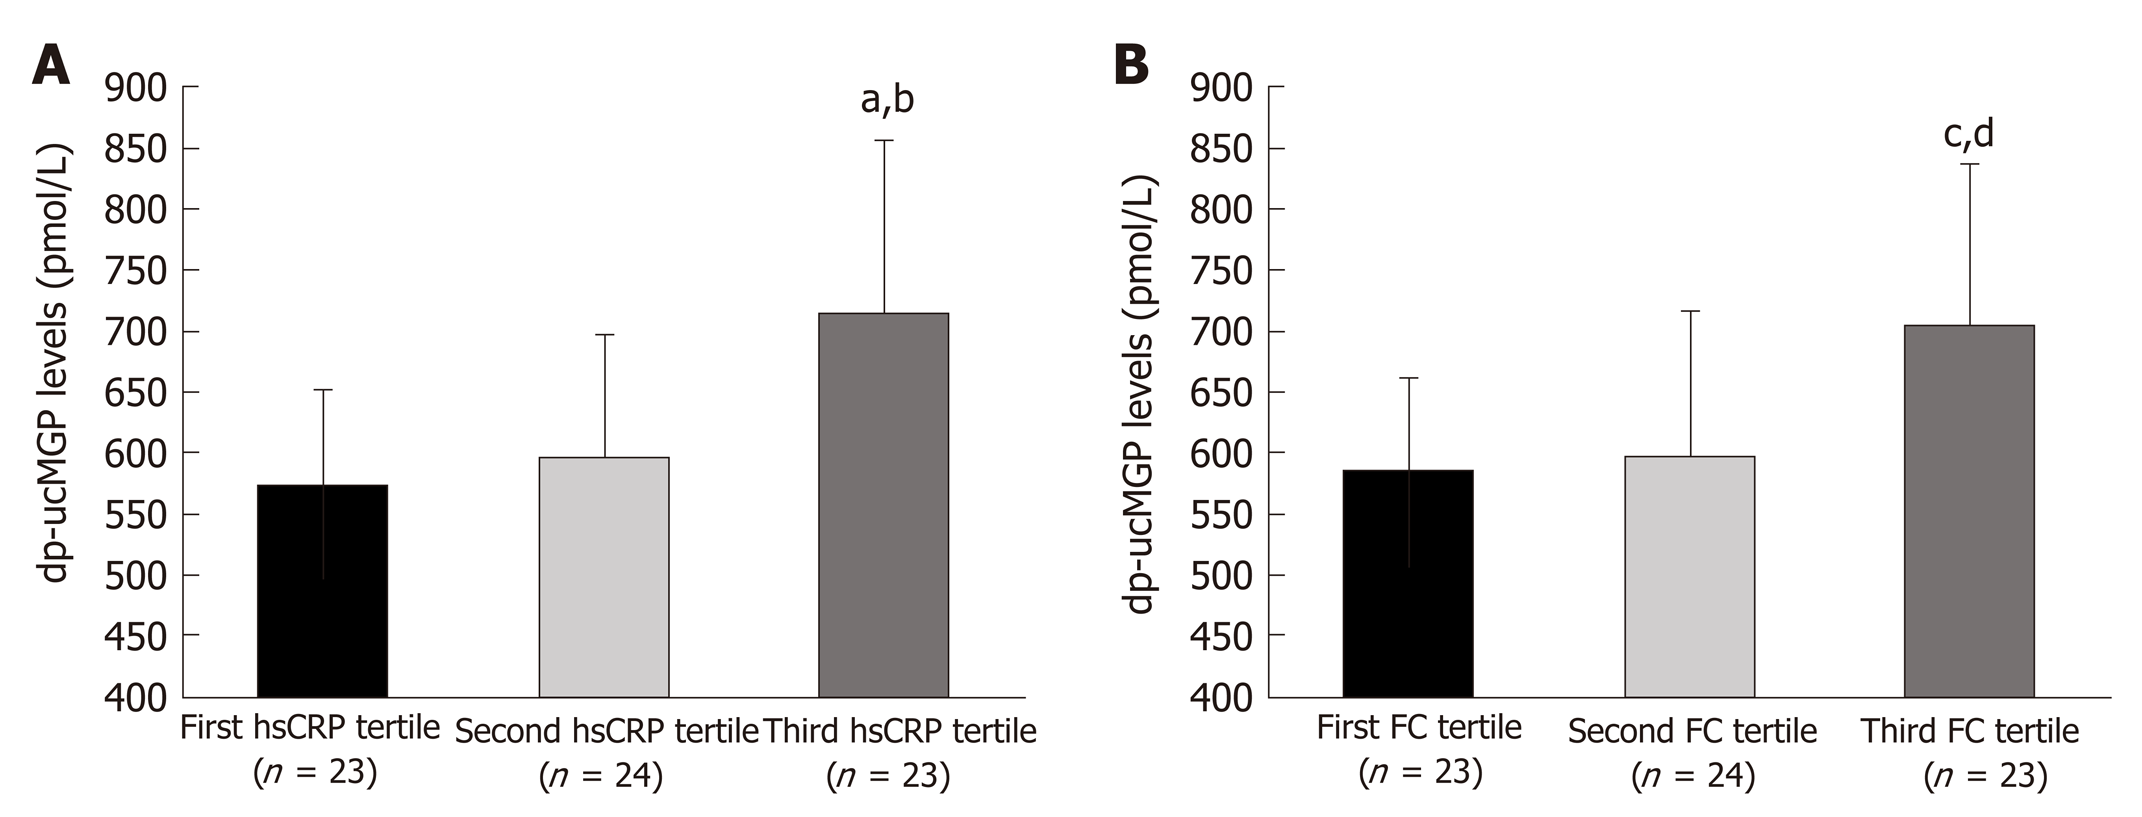
Figure 4 Dephosphorylated and uncarboxylated matrix Gla protein concentrations between tertiles of high sensitivity C-reactive protein (A) and FC levels (B).
Tested with one-way analysis of variance with post hoc Sceffé test to examine differences between each of the groups; aP < 0.05 vs first hsCRP tertile; bP < 0.05 vs second hsCRP tertile ; cP < 0.05 vs first FC tertile; dP < 0.05 vs second FC tertile; hsCRP: High sensitivity C-reactive protein; FC: Fecal calprotectin.
- Citation: Brnic D, Martinovic D, Zivkovic PM, Tokic D, Vilovic M, Rusic D, Tadin Hadjina I, Libers C, Glumac S, Supe-Domic D, Tonkic A, Bozic J. Inactive matrix Gla protein is elevated in patients with inflammatory bowel disease. World J Gastroenterol 2020; 26(32): 4866-4877
- URL: https://www.wjgnet.com/1007-9327/full/v26/i32/4866.htm
- DOI: https://dx.doi.org/10.3748/wjg.v26.i32.4866


