Copyright
©The Author(s) 2020.
World J Gastroenterol. Jan 14, 2020; 26(2): 168-183
Published online Jan 14, 2020. doi: 10.3748/wjg.v26.i2.168
Published online Jan 14, 2020. doi: 10.3748/wjg.v26.i2.168
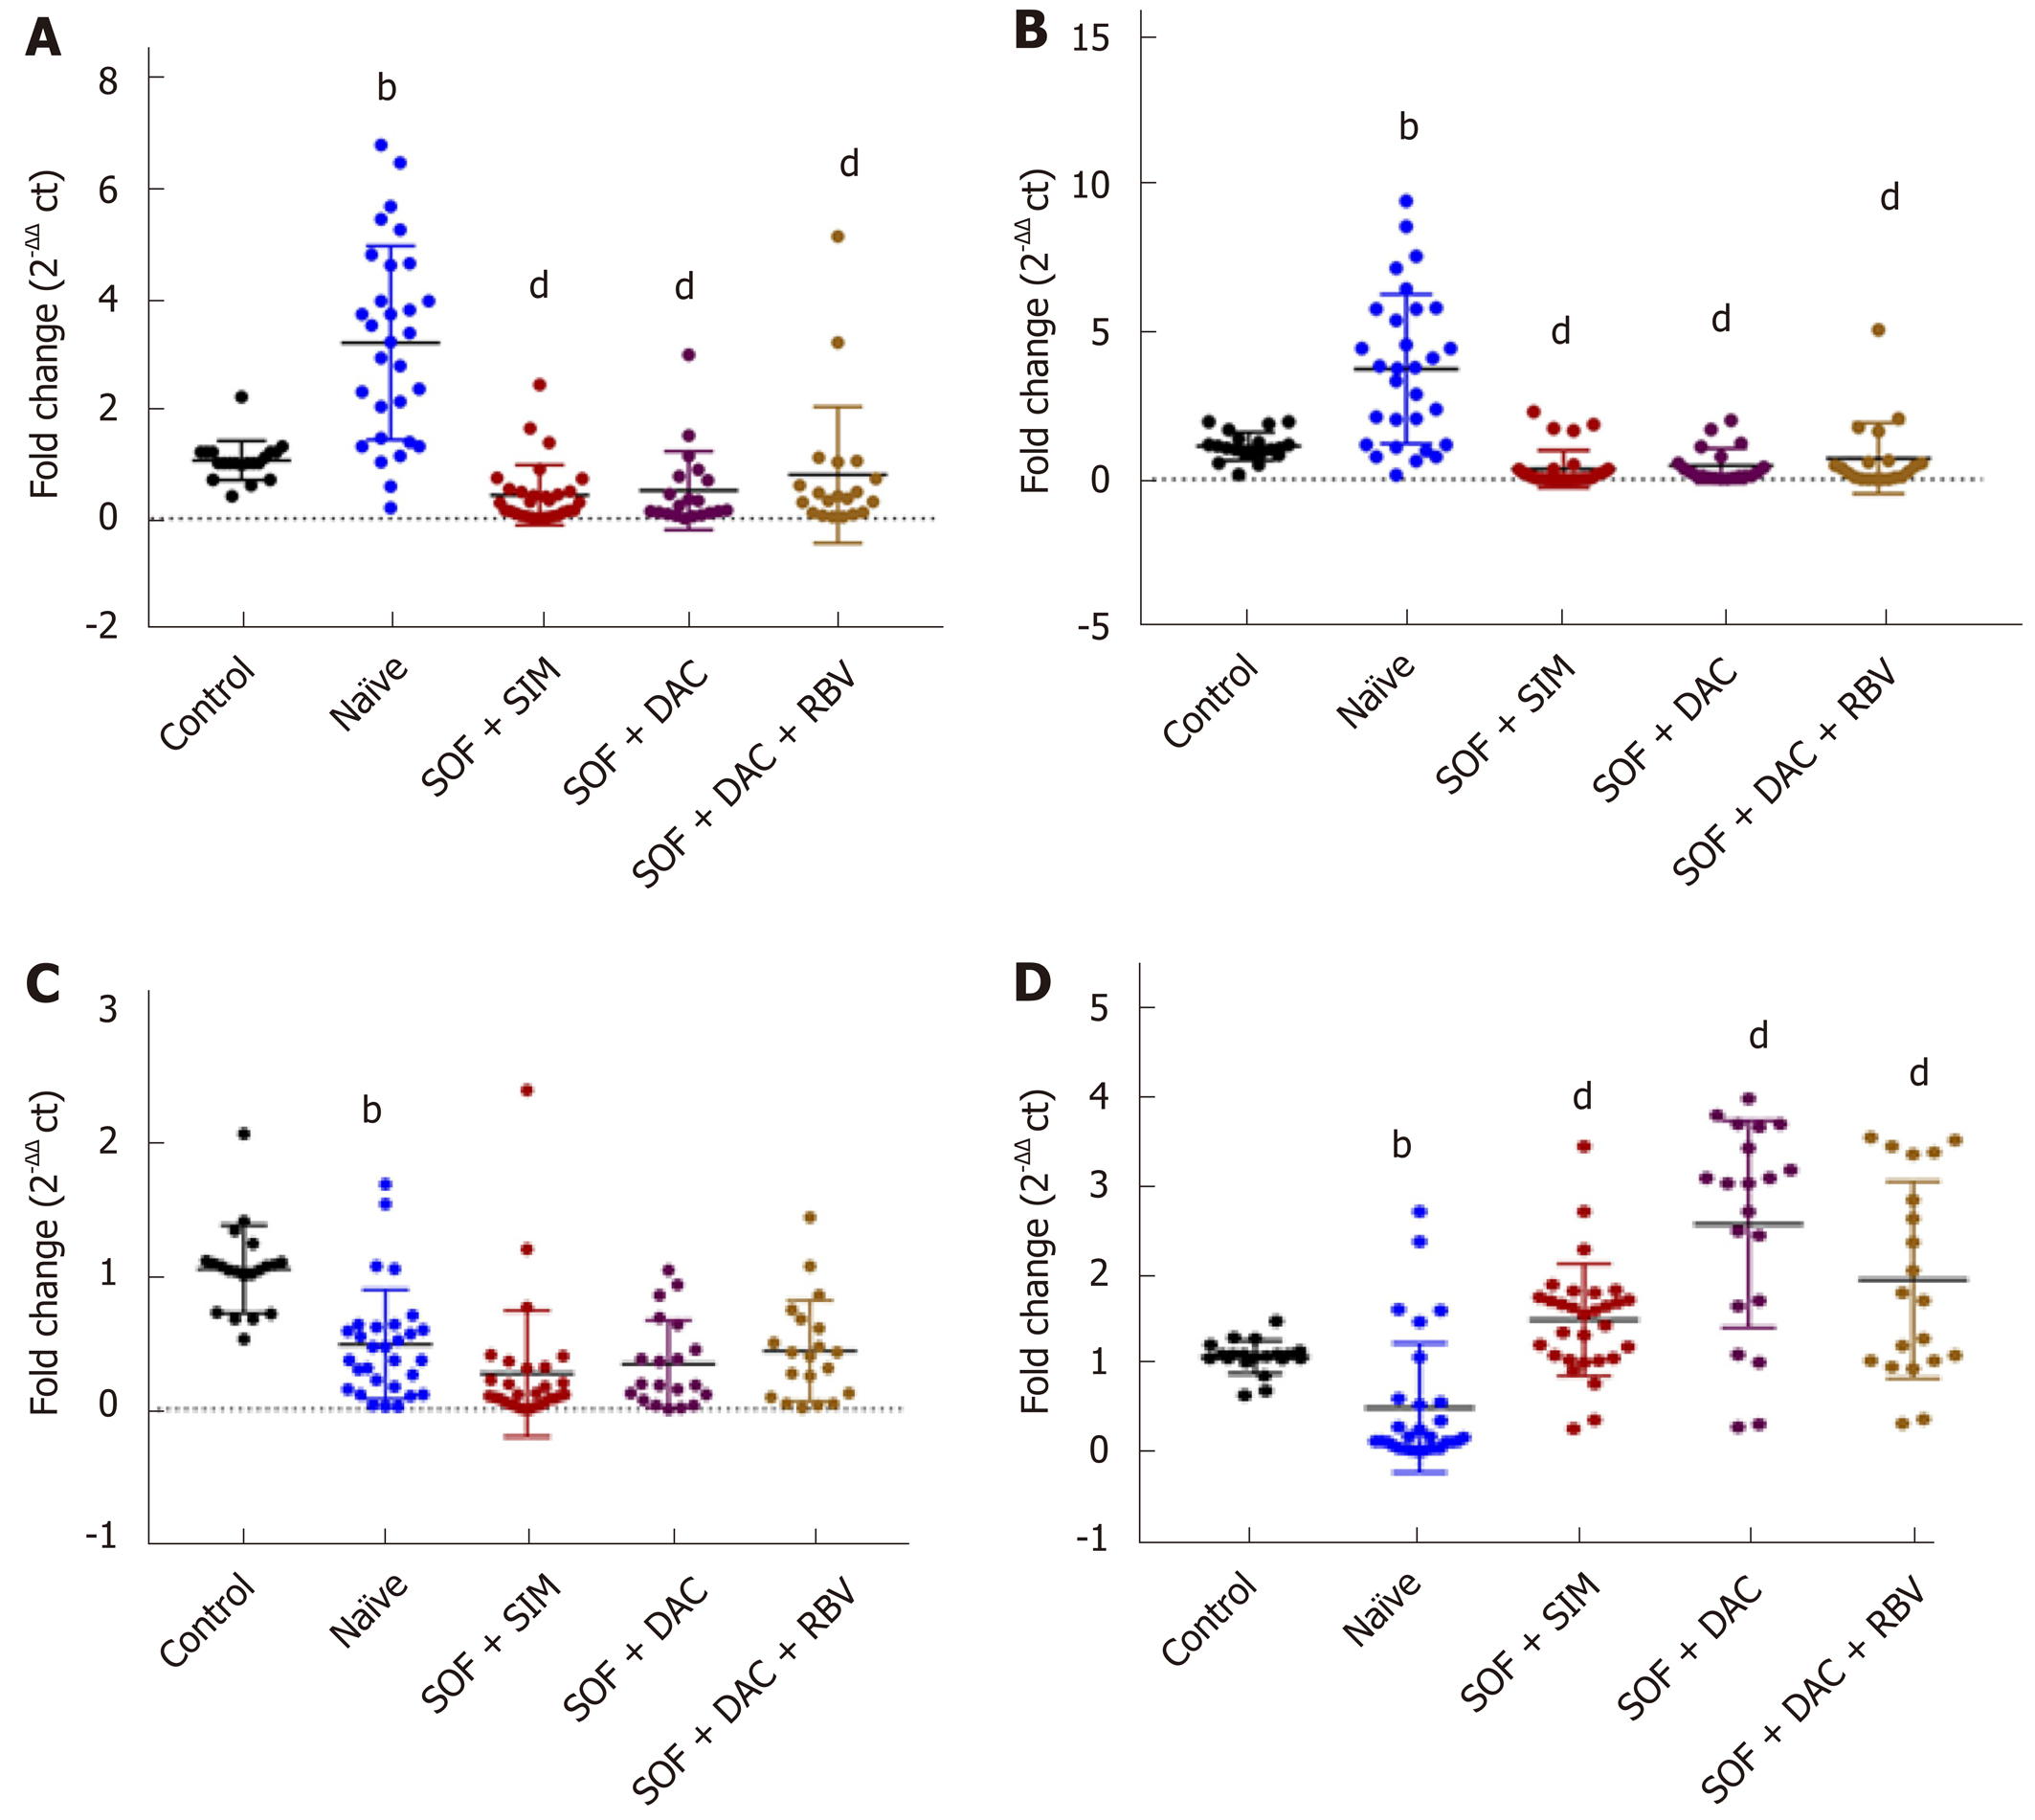
Figure 1 Serum expression levels of lncRNAs and mRNA in healthy controls, hepatitis C virus naïve patients and hepatitis C virus treated patients with different treatment regimens.
A: LncRNA GAS5; B: LncRNA BISPR; C: LncRNA HEIH; D: mRNA BST2. bP < 0.01, vs control group; dP < 0.01, vs naïve group; Data were analyzed by On e-way ANOVA test followed by Tukey HSD multiple comparison test.
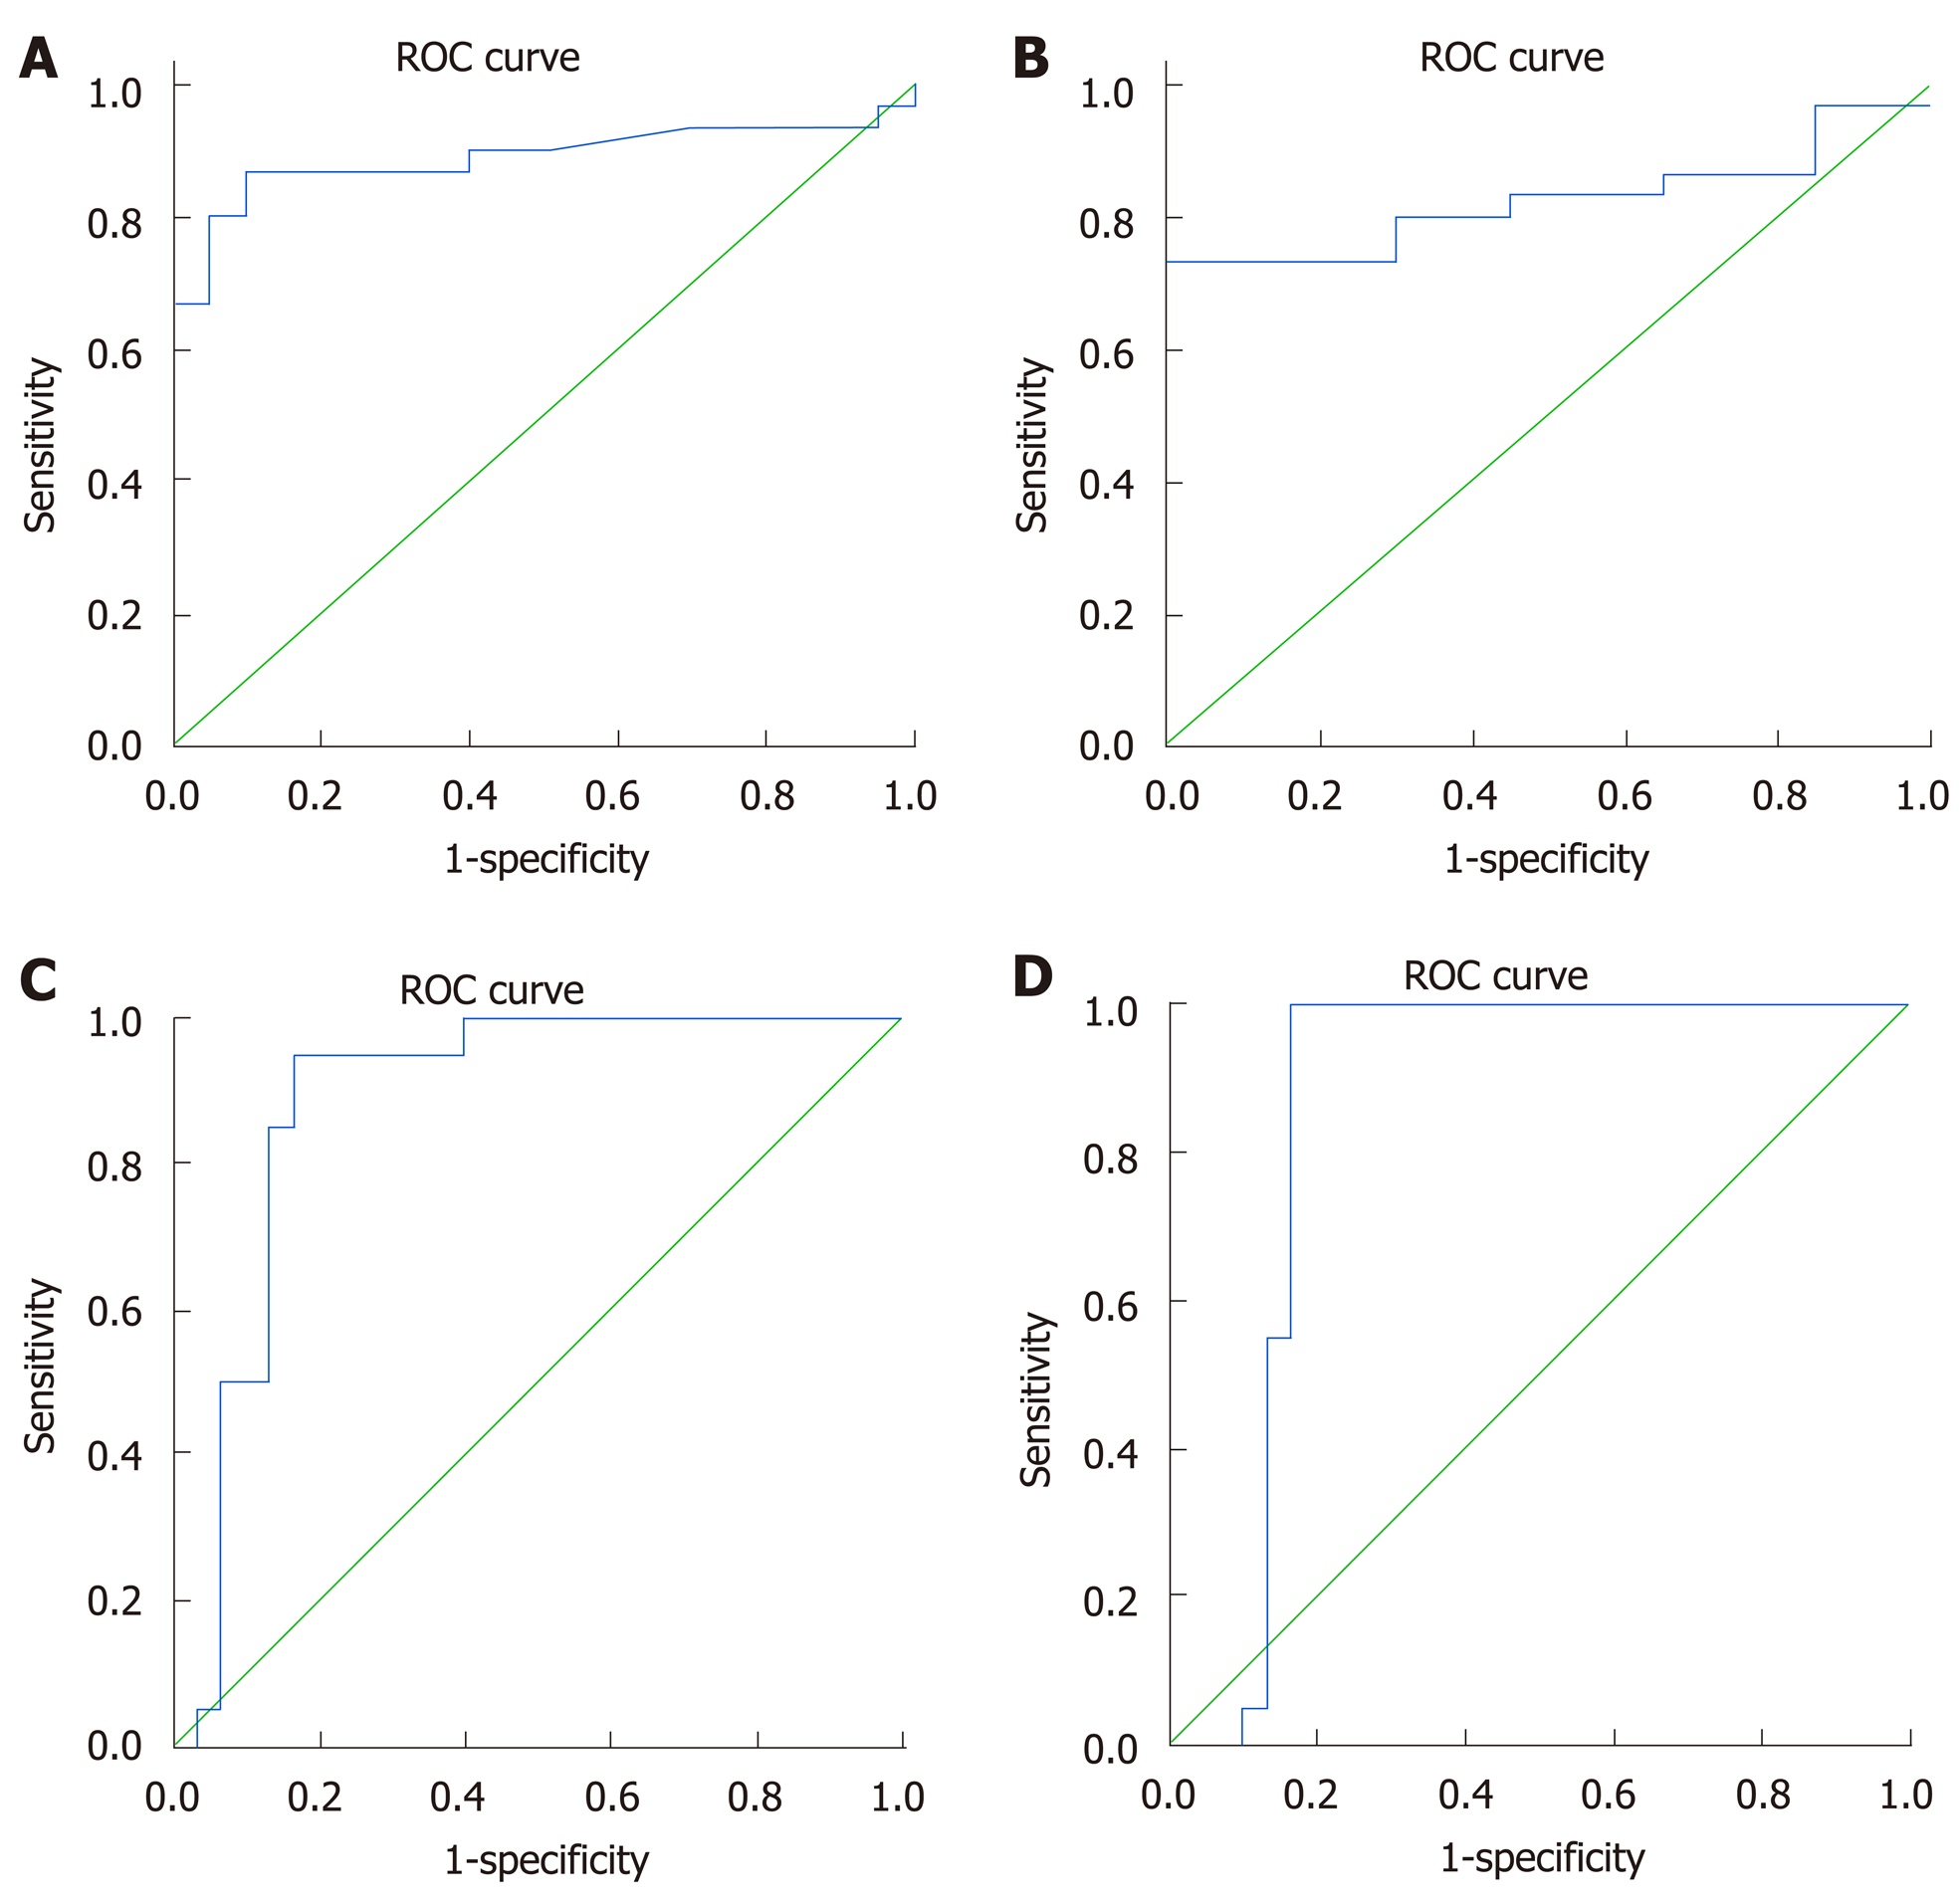
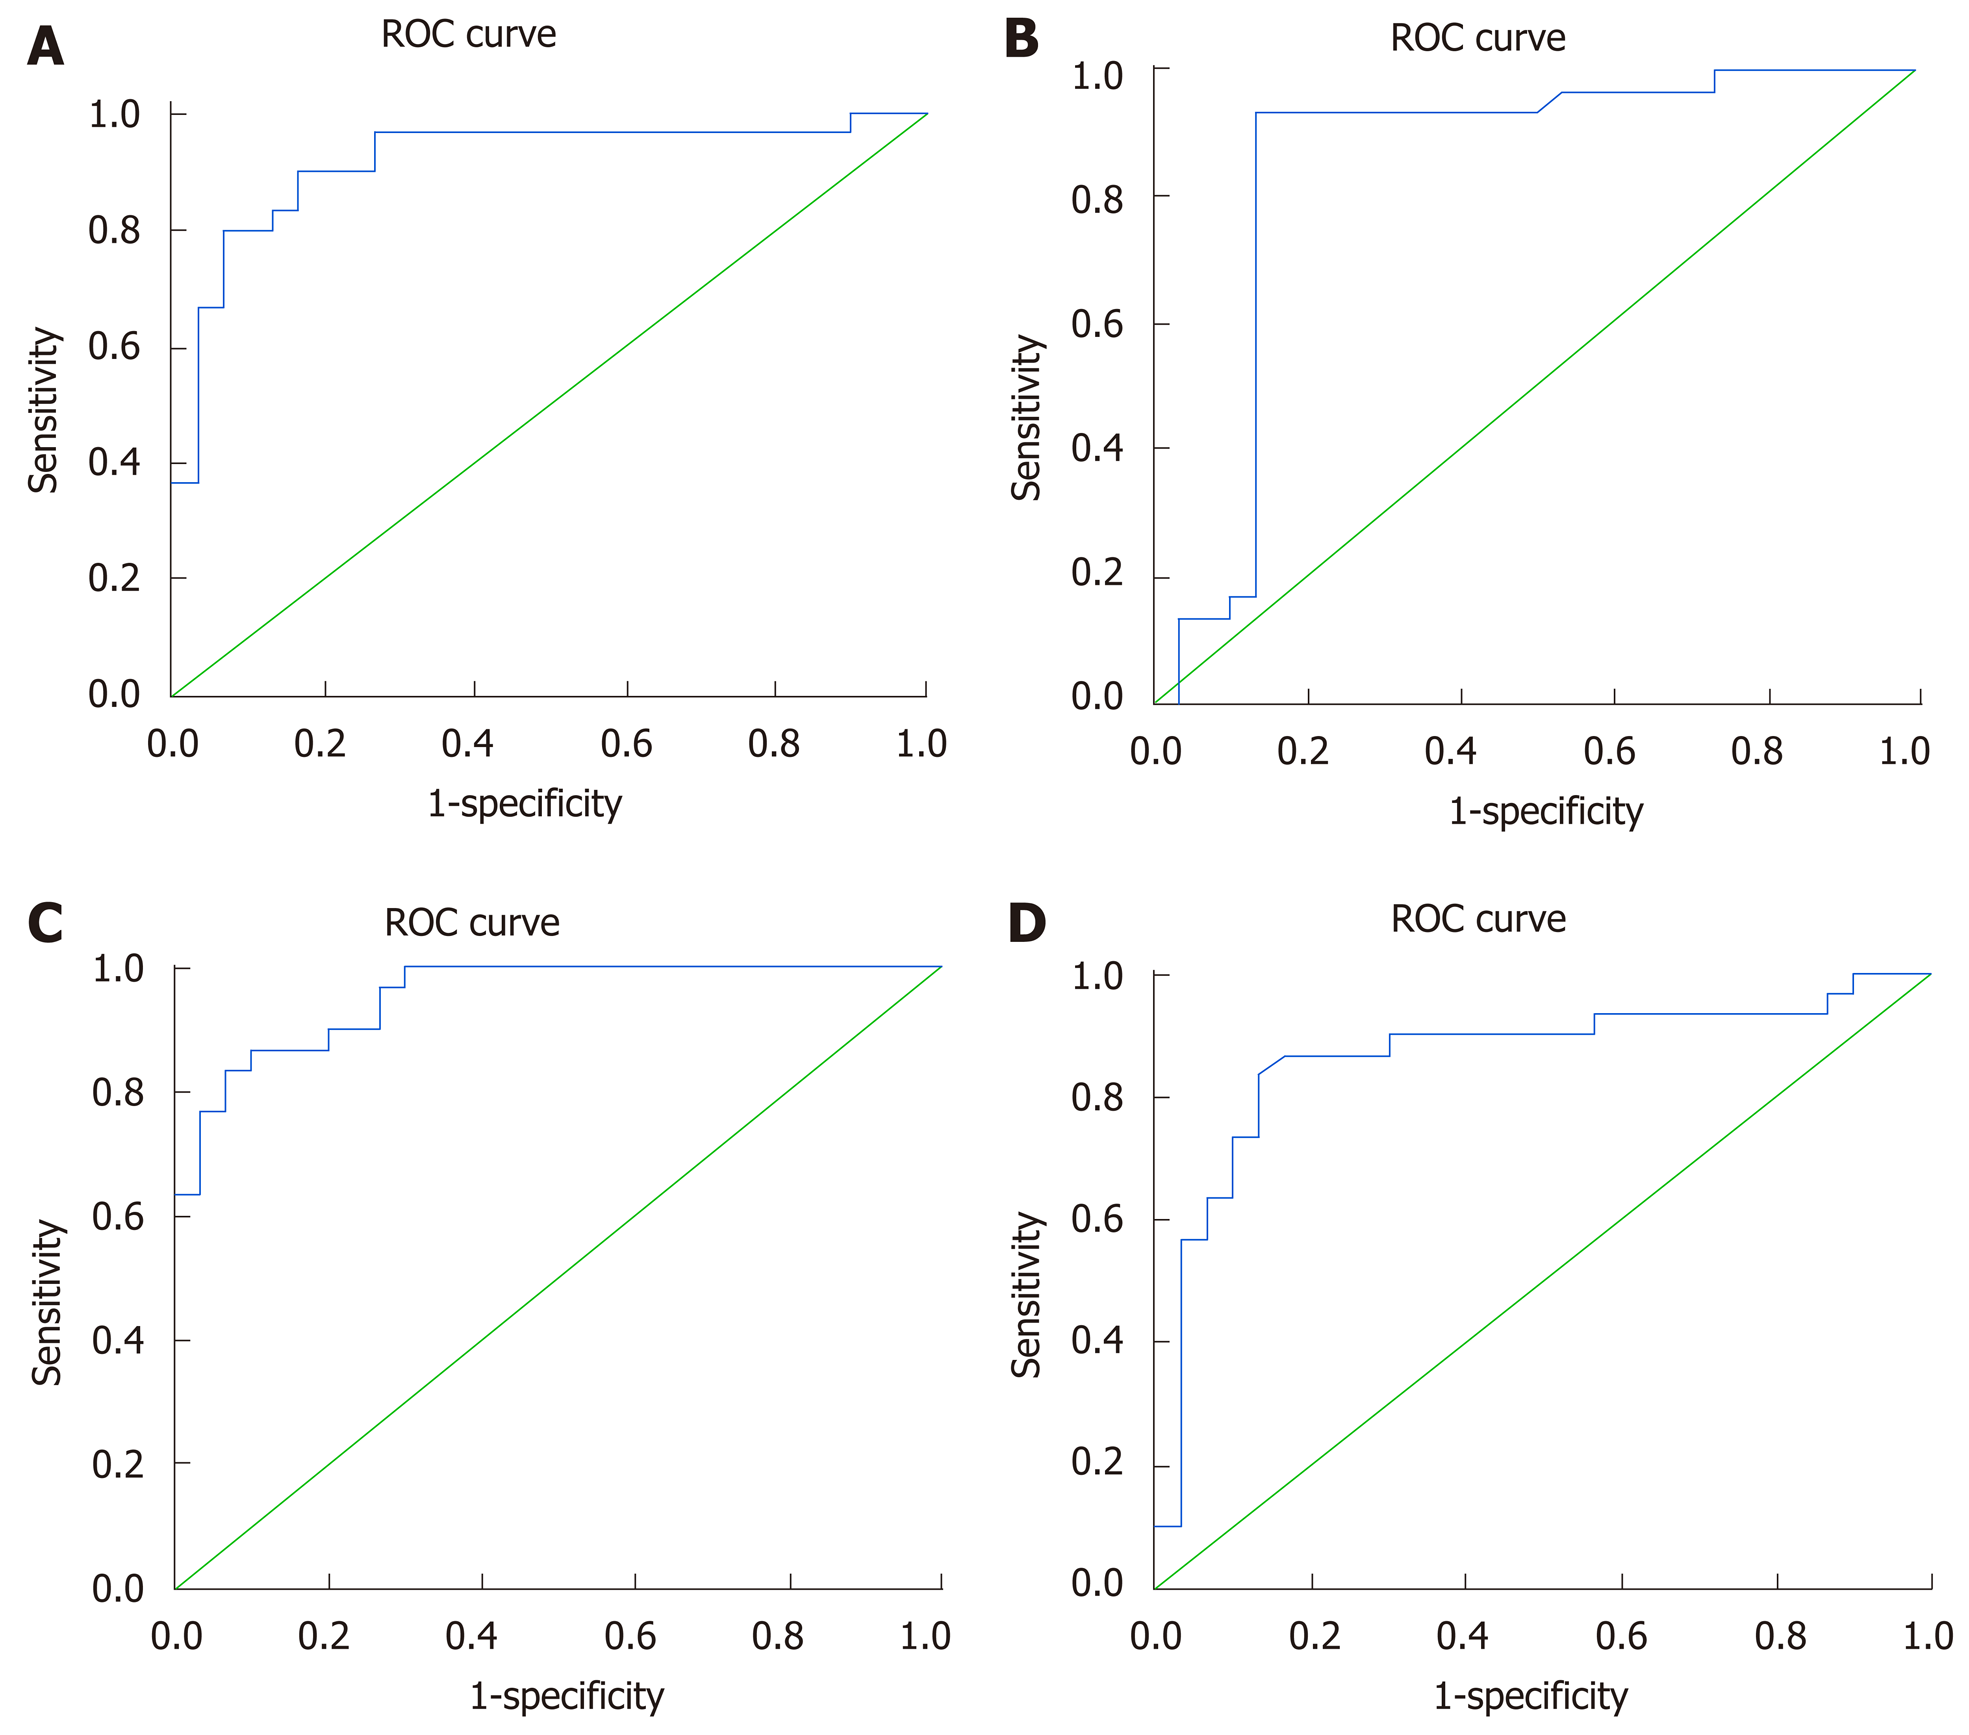
Figure 2 Serum LncRNAs and mRNA as diagnostic biomarker for naïve patients.
ROC curve analysis for lncRNA Gas 5 (AUC = 0.88) (A), BISPR (AUC = 0.82) (B), HEIH (AUC = 0.88) (C) and mRNA BST2 (AUC = 0.85) (D) as diagnostic biomarkers discriminating naïve patients from healthy controls.
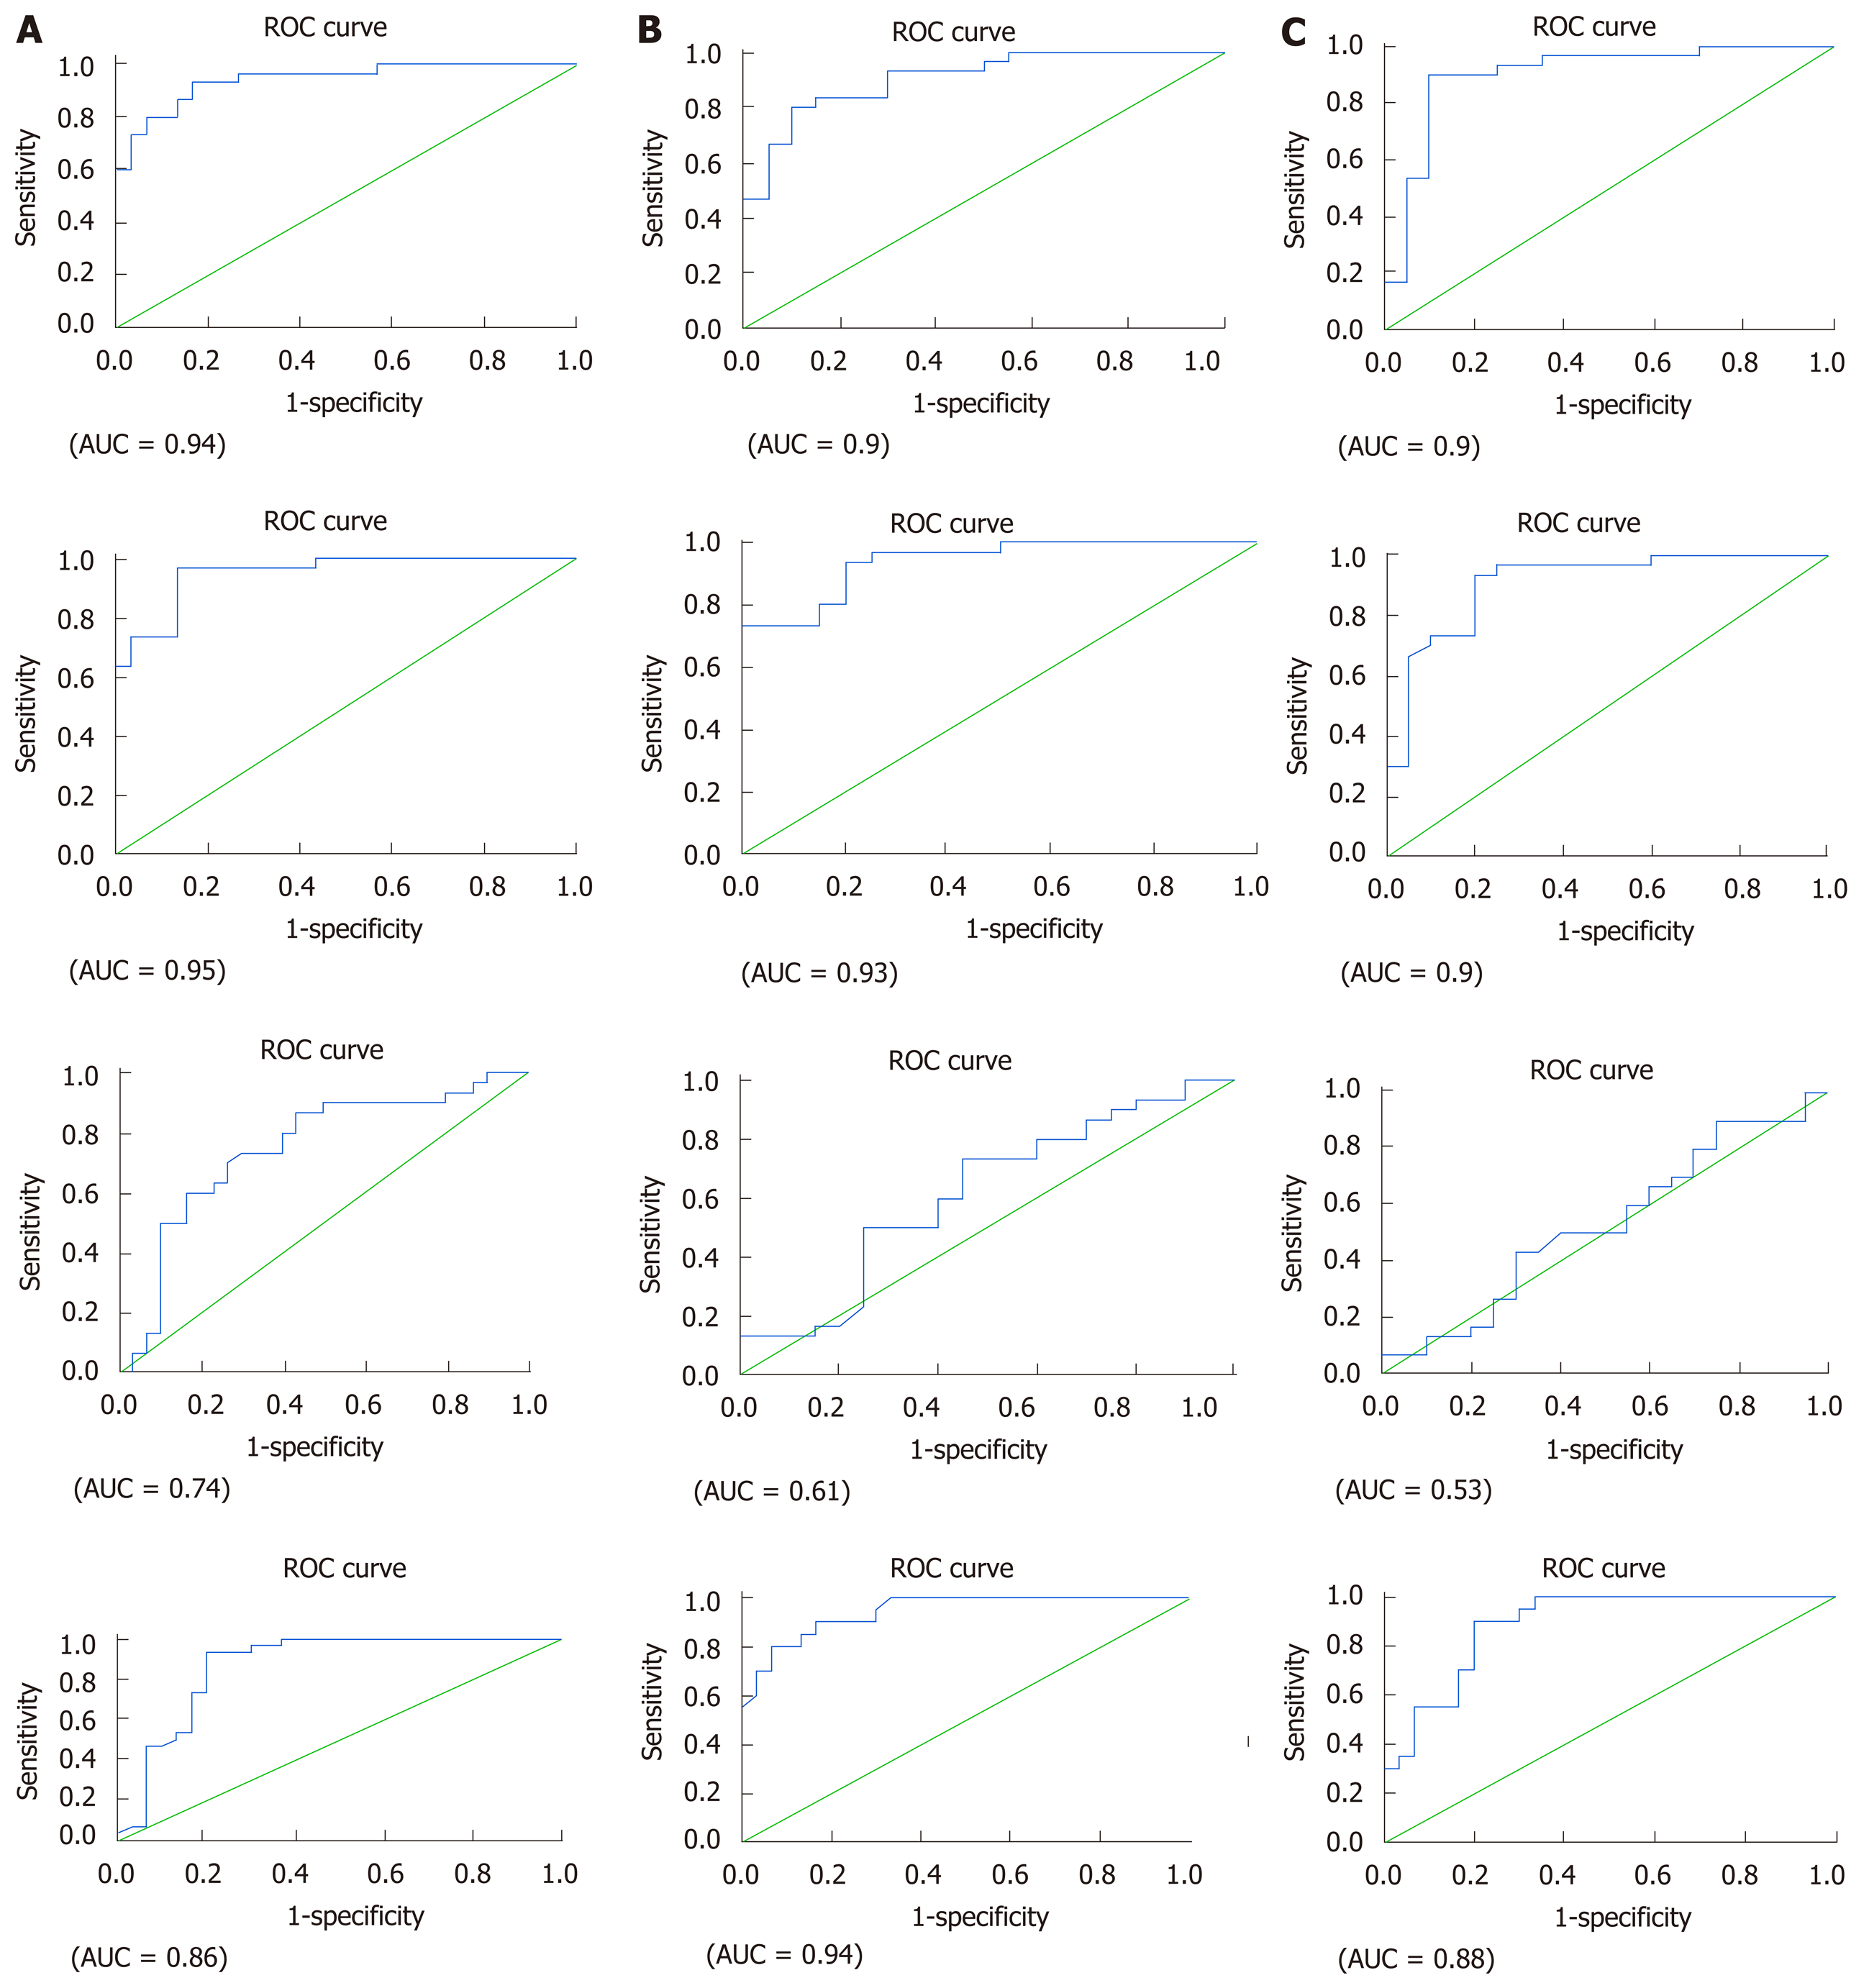
Figure 3 Serum LncRNAs and mRNA as prognostic biomarker for hepatitis C virus treated patients with different treatment reginens.
ROC curve analysis for SOF + SIM (A), SOF + DAC (B), and SOF + DAC + RBV (C) as prognostic biomarkers discriminate treated from naïve patients. 1st LncRNA gas 5; 2nd LncRNA BISPR; 3rd LncRNA HEIH; 4th mRNA BST2.
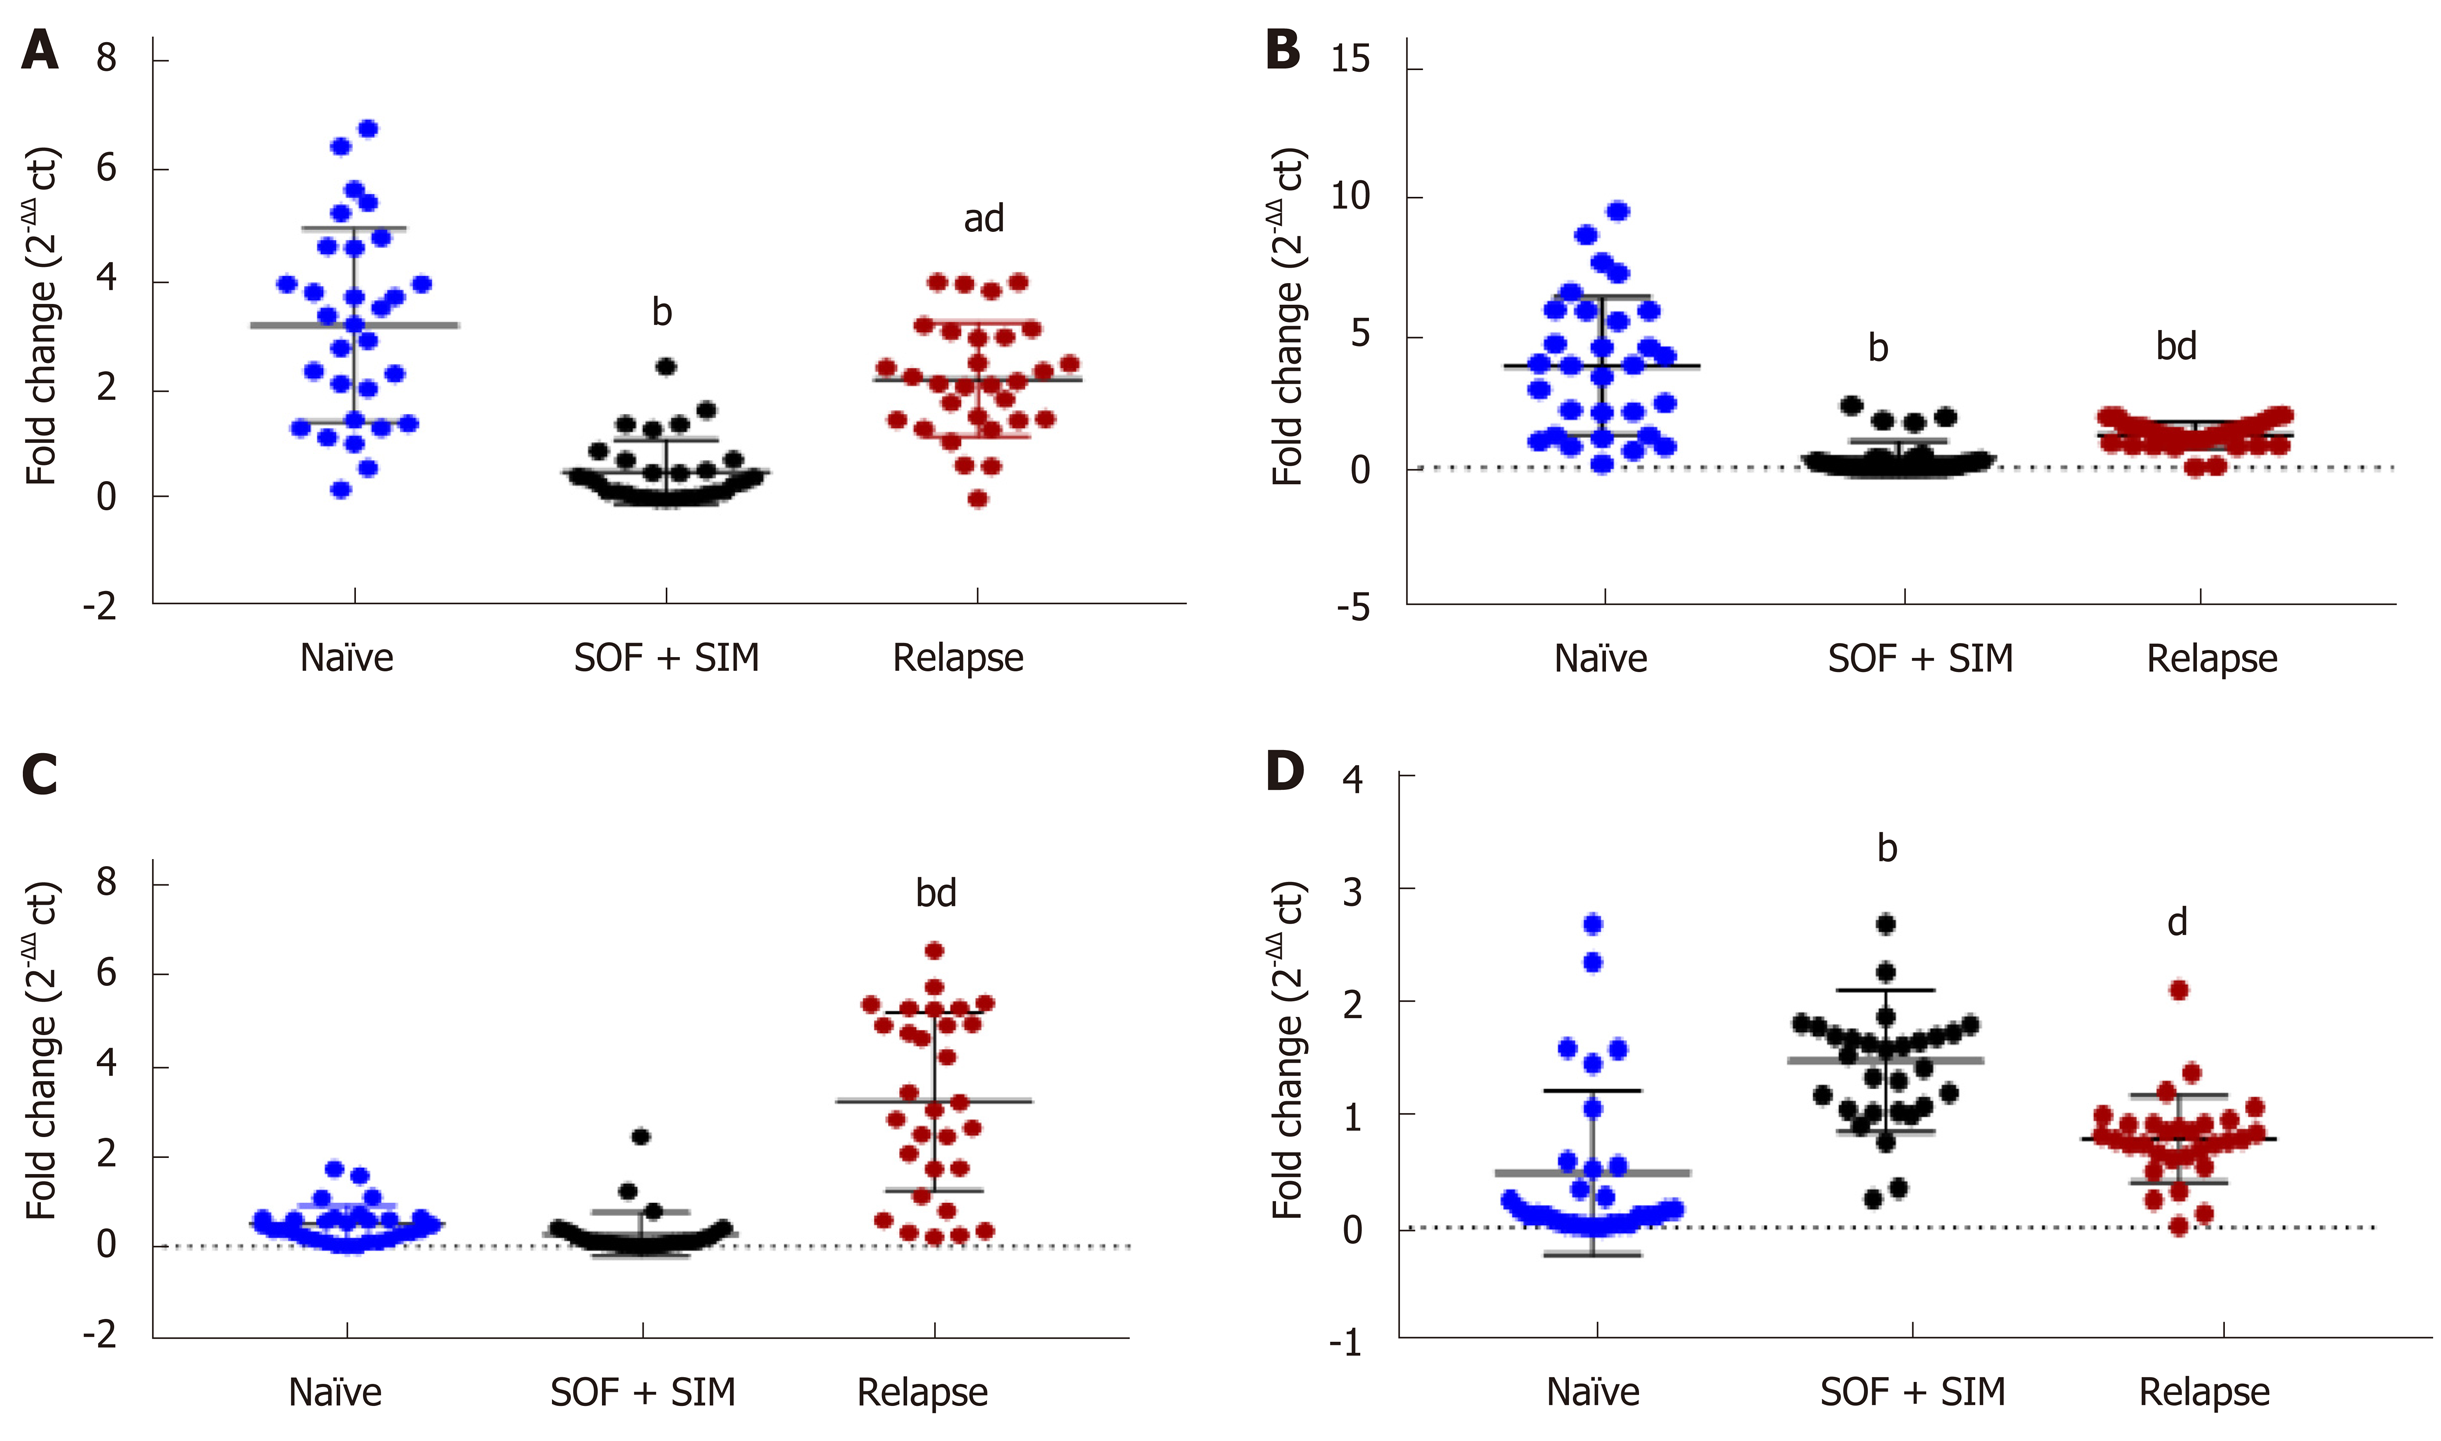
Figure 4 Differential expression of serum lncRNAs and mRNA levels in hepatitis C virus relapsed, naïve and SOF + SIM treated hepatitis C virus patients.
aP < 0.05, bP < 0.01, vs naïve group; dP < 0.01, vs SOF + SIM group.
Figure 5 Serum LncRNAs and mRNA as prognostic biomarker for relapsed patients.
ROC curve analysis for lncRNA Gas 5 (AUC = 0.91) (A), BISPR (AUC = 0.84) (B), HEIH (AUC = 0.95) (C) and mRNA BST2 (AUC = 0.86) (D) as prognostic biomarkers discriminating relapsed from treated from SOF + SIM patients.
- Citation: El Samaloty NM, Shabayek MI, Ghait RS, El-Maraghy SA, Rizk SM, El-Sawalhi MM. Assessment of lncRNA GAS5, lncRNA HEIH, lncRNA BISPR and its mRNA BST2 as serum innovative non-invasive biomarkers: Recent insights into Egyptian patients with hepatitis C virus type 4. World J Gastroenterol 2020; 26(2): 168-183
- URL: https://www.wjgnet.com/1007-9327/full/v26/i2/168.htm
- DOI: https://dx.doi.org/10.3748/wjg.v26.i2.168


