Copyright
©The Author(s) 2019.
World J Gastroenterol. Feb 28, 2019; 25(8): 955-966
Published online Feb 28, 2019. doi: 10.3748/wjg.v25.i8.955
Published online Feb 28, 2019. doi: 10.3748/wjg.v25.i8.955
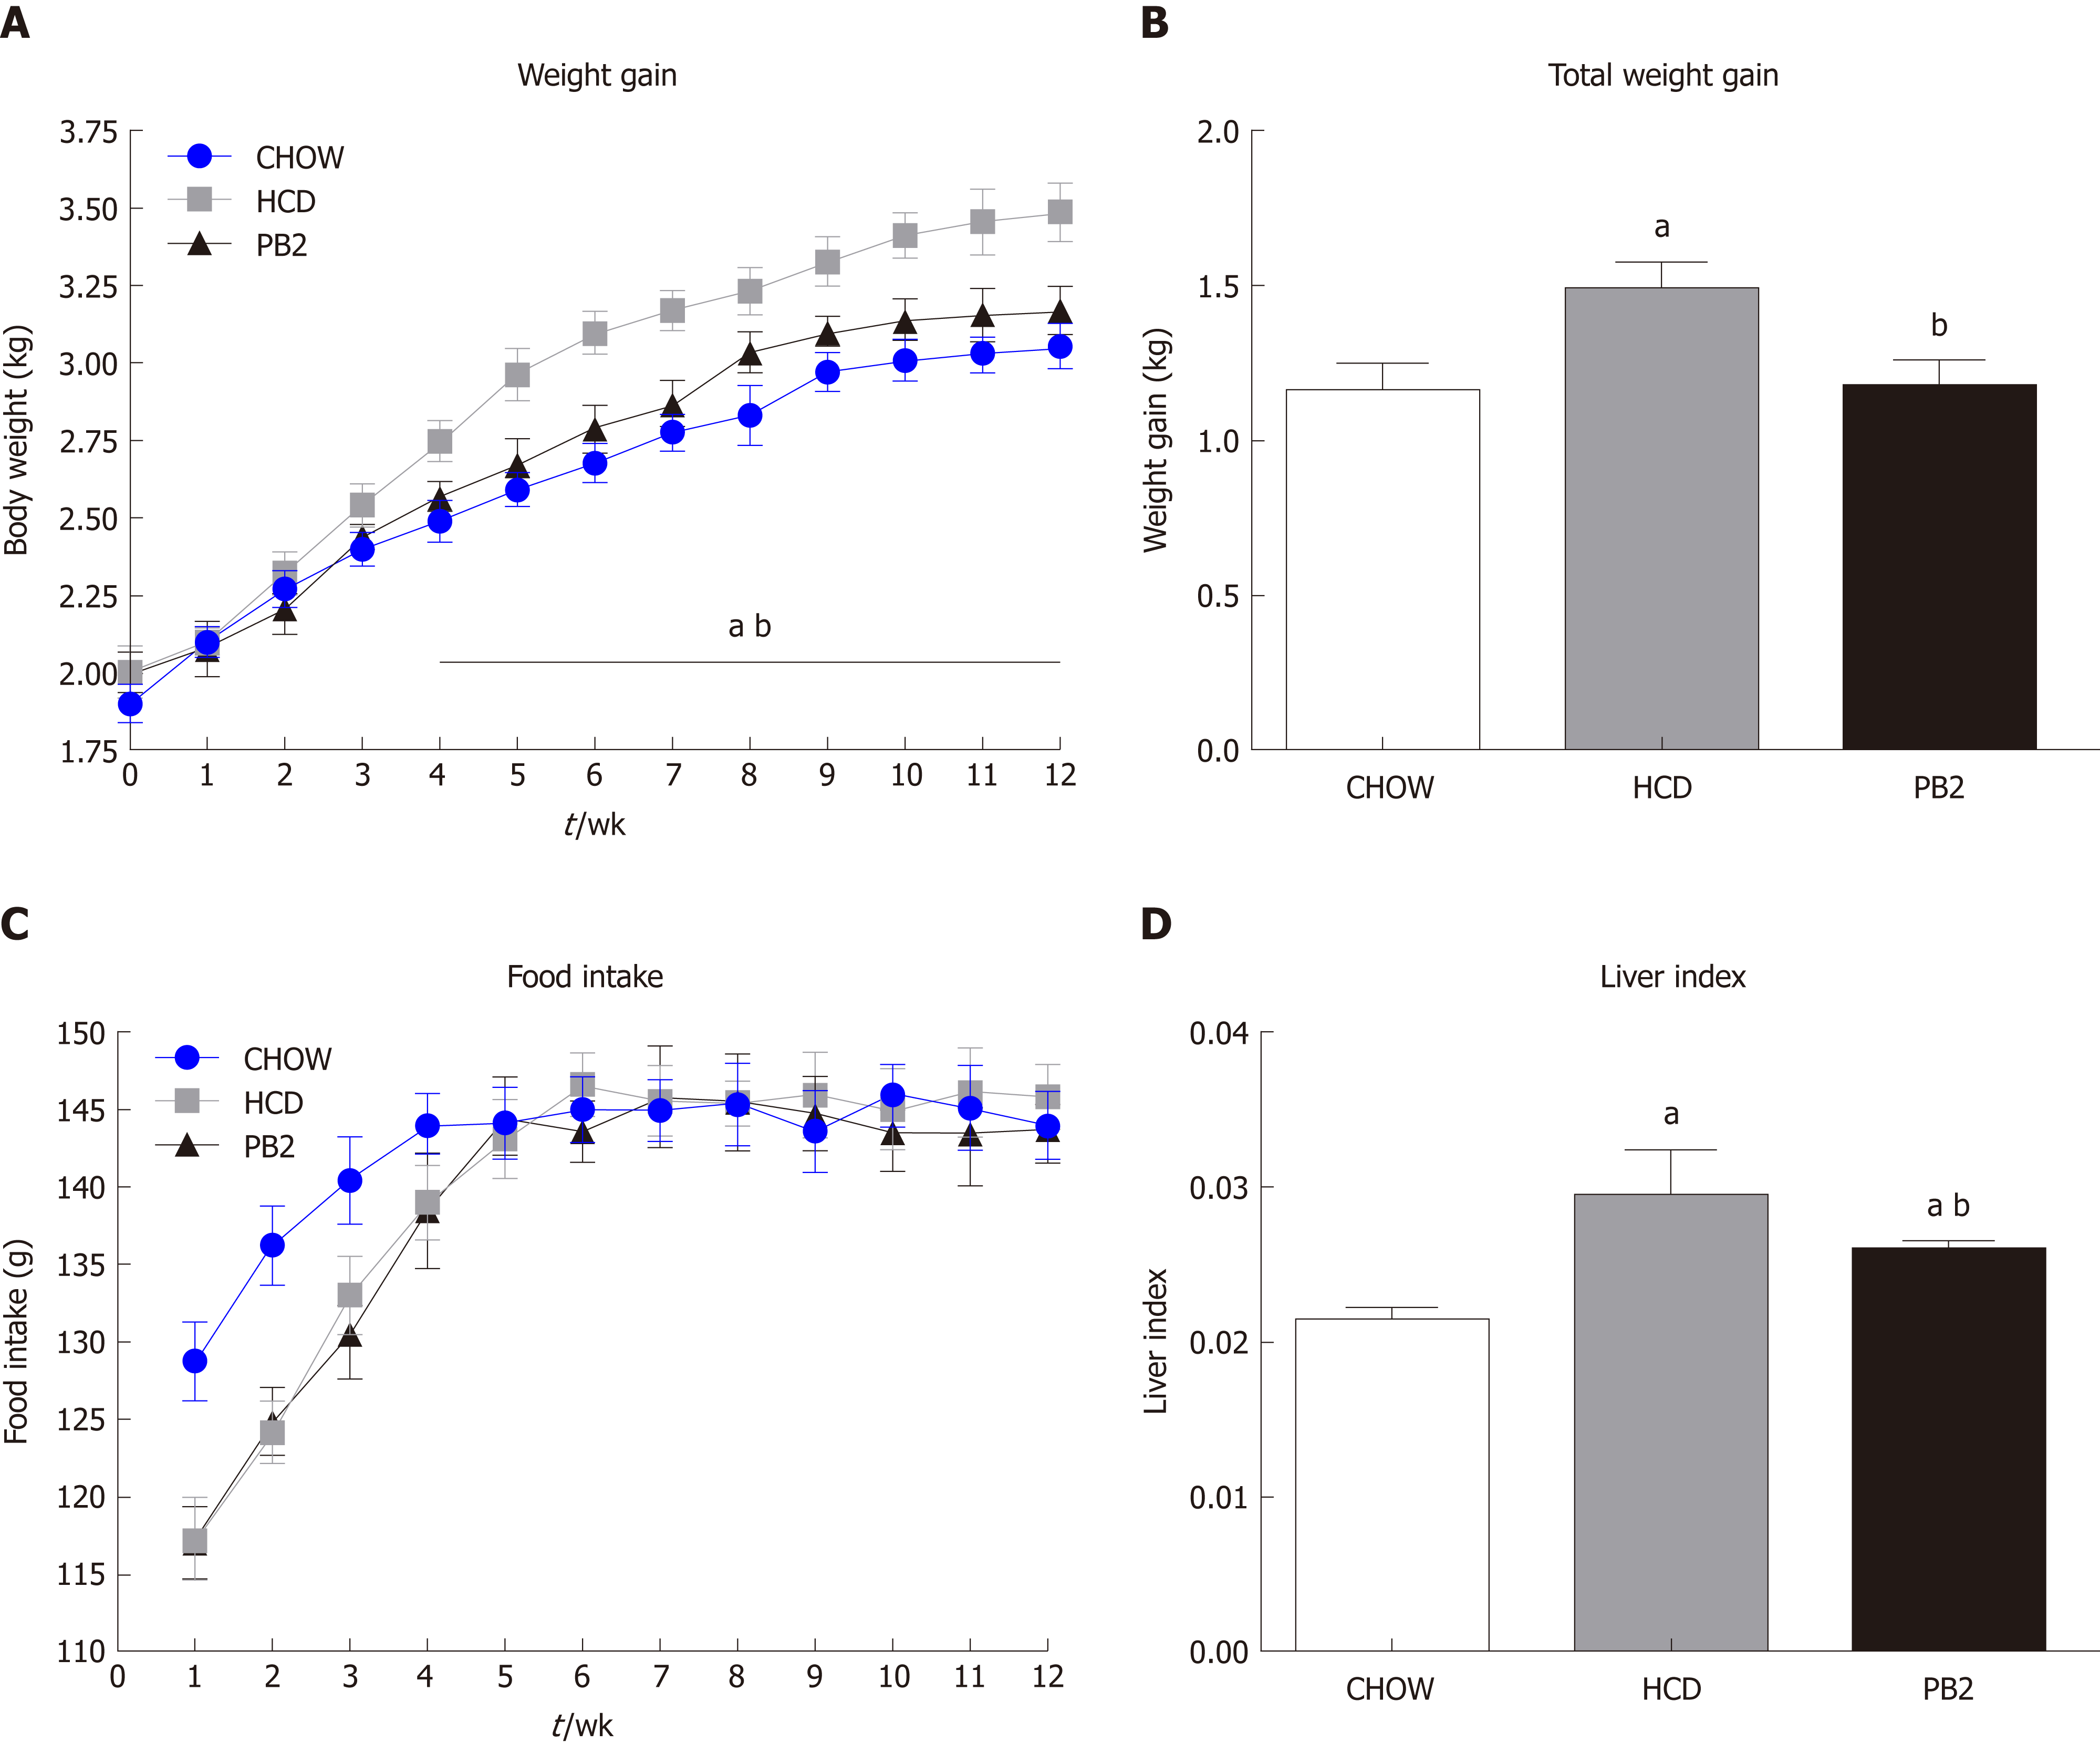
Figure 1 Effects of procyanidin B2 on body composition.
A: Weight gain curves; B: Total weight gain; C: Food intake curves; D: Liver index. The data are expressed as means ± SD. aP < 0.05 vs CHOW group; bP < 0.05 vs high-fat-cholesterol diet group. HCD: High-fat-cholesterol diet; PB2: Procyanidin B2; SD: Standard deviation.
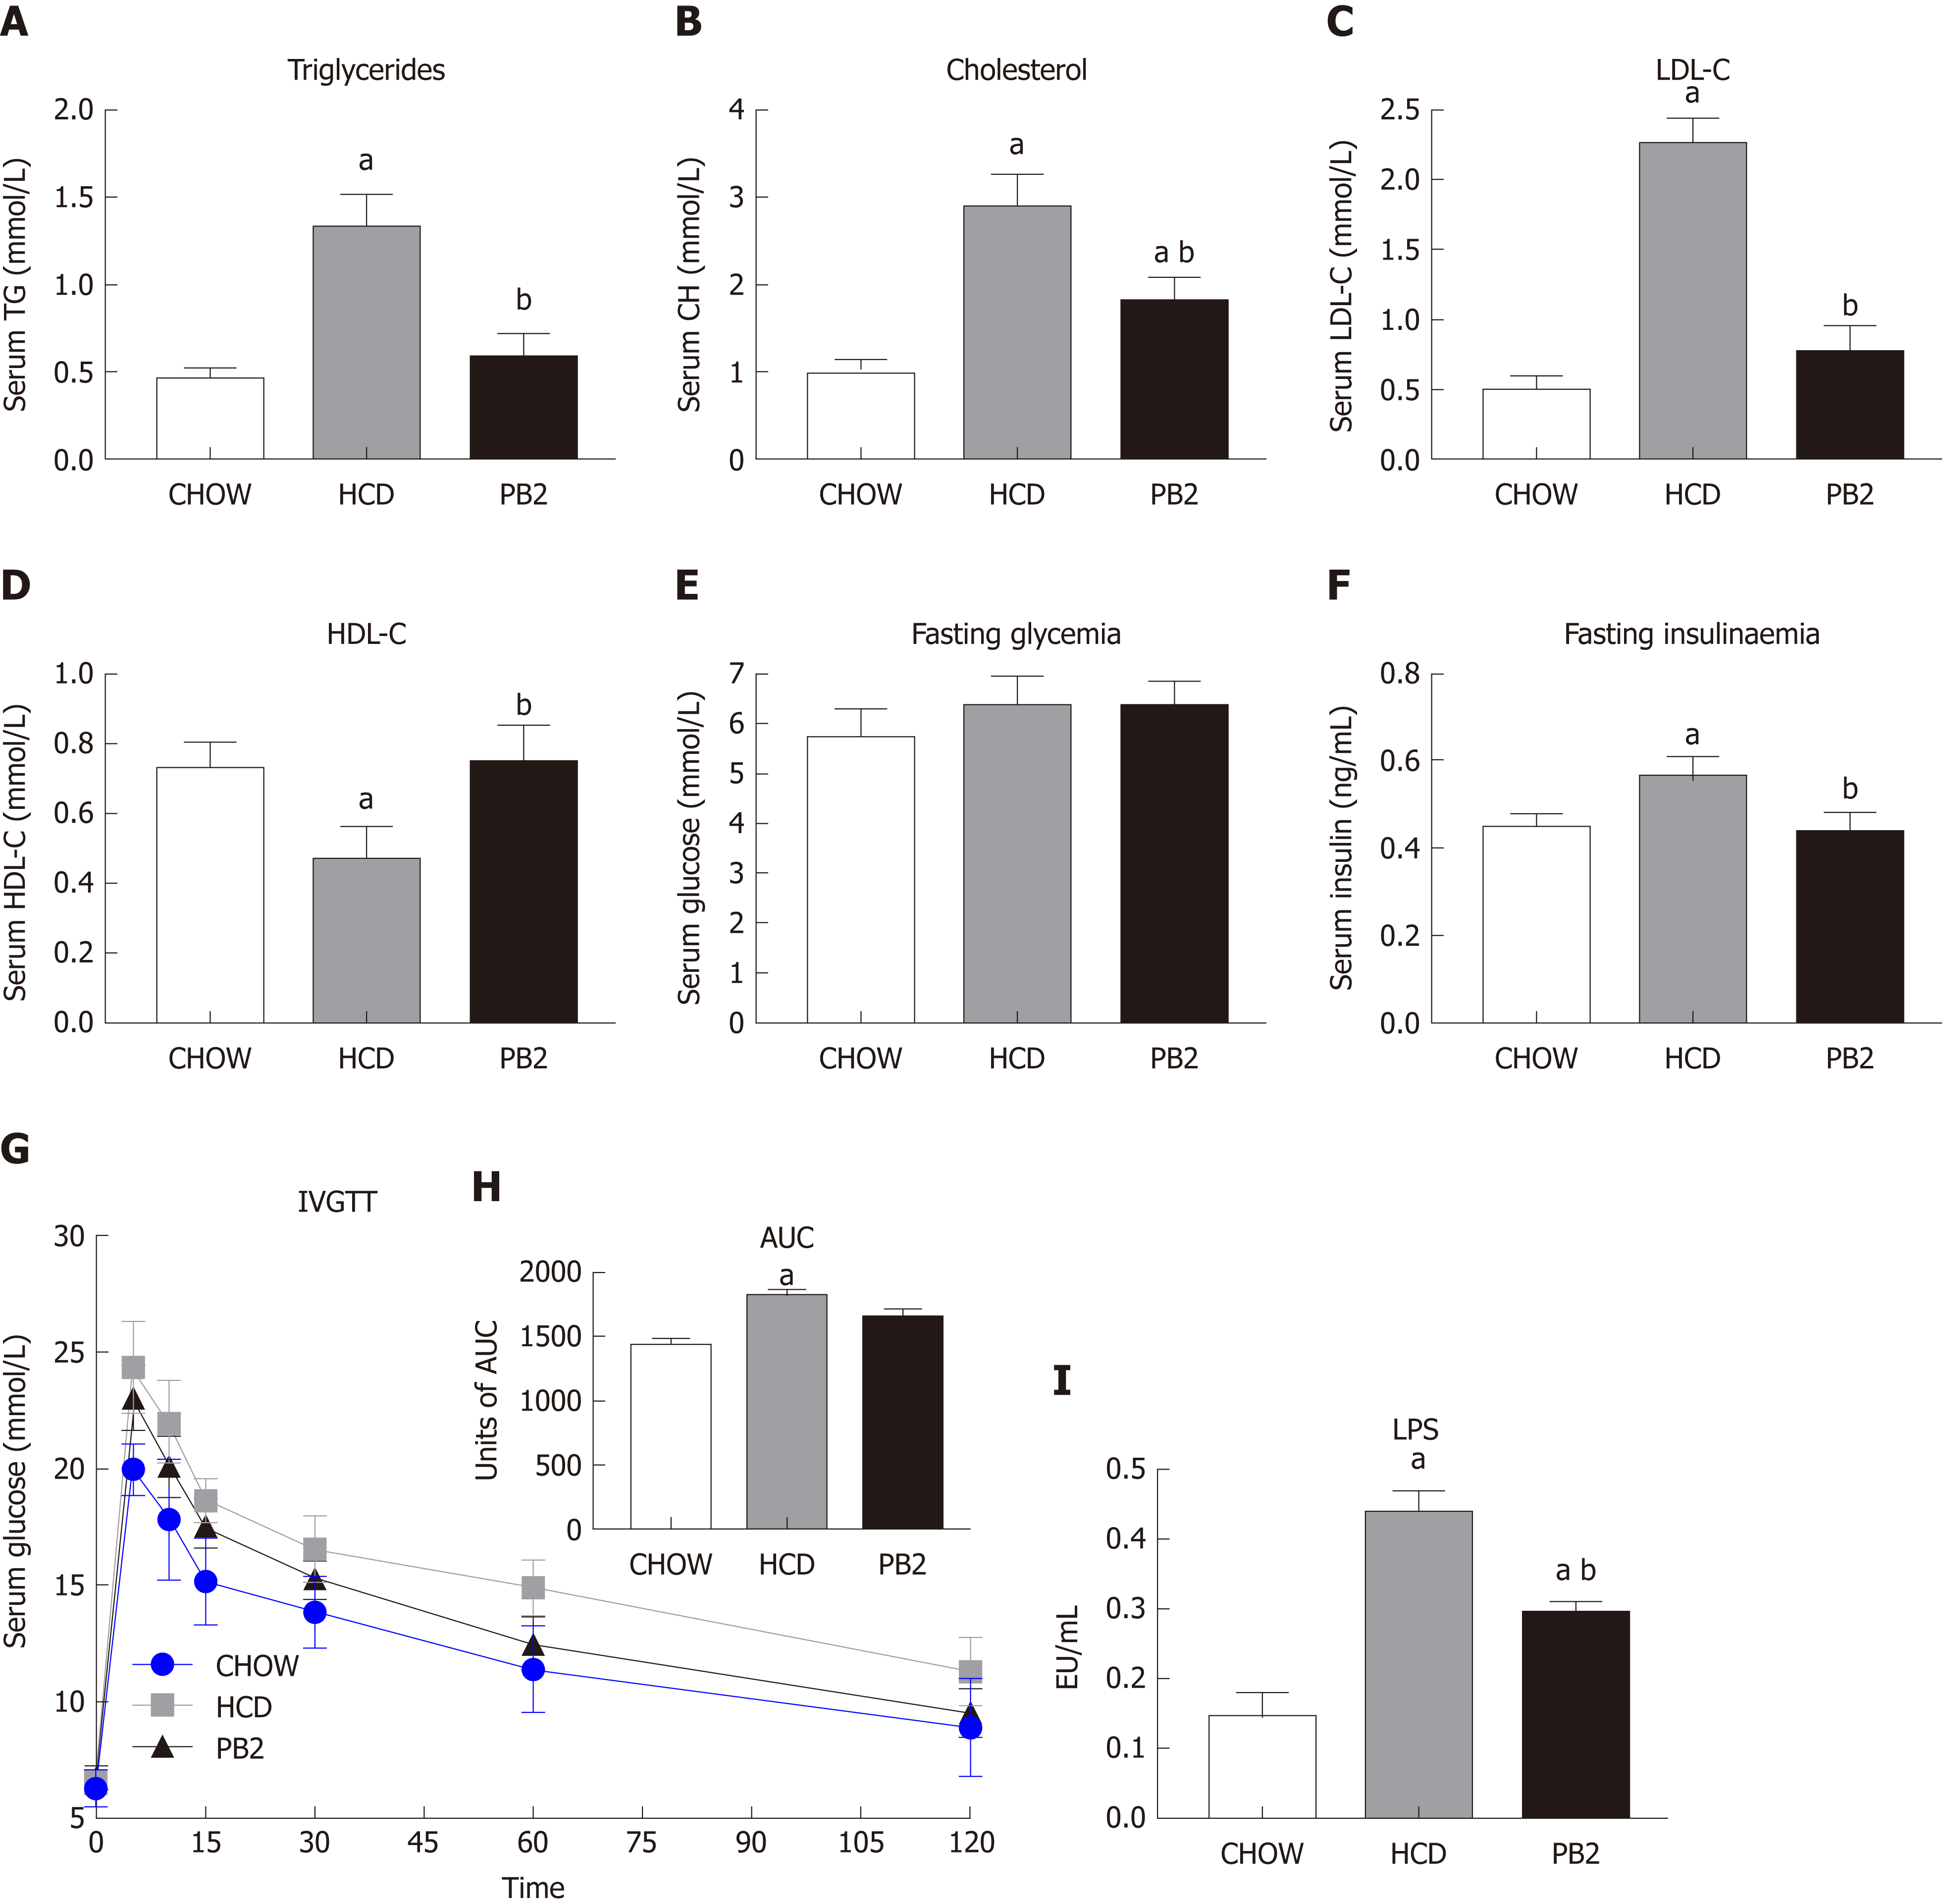
Figure 2 Effects of procyanidin B2 on serum lipid profile, insulin resistance, and endotoxemia.
Serum triglycerides (A), total cholesterol (B), low-density lipoprotein cholesterol (C), high-density lipoprotein cholesterol (D) and fasting glucose (E), fasting insulin (F) and the intravenous glucose tolerance test (G), units of area under the curve (H) and lipopolysaccharides (I). The data are expressed as means ± SD. aP < 0.05 vs CHOW group; bP < 0.05 vs high-fat-cholesterol diet group. HCD: High-fat-cholesterol diet; PB2: Procyanidin B2; LDL-C: Low-density lipoprotein cholesterol; HDL-C: High-density lipoprotein cholesterol; IVGTT: Intravenous glucose tolerance test; AUC: Area under the curve; LPS: Lipopolysaccharides; SD: Standard deviation.
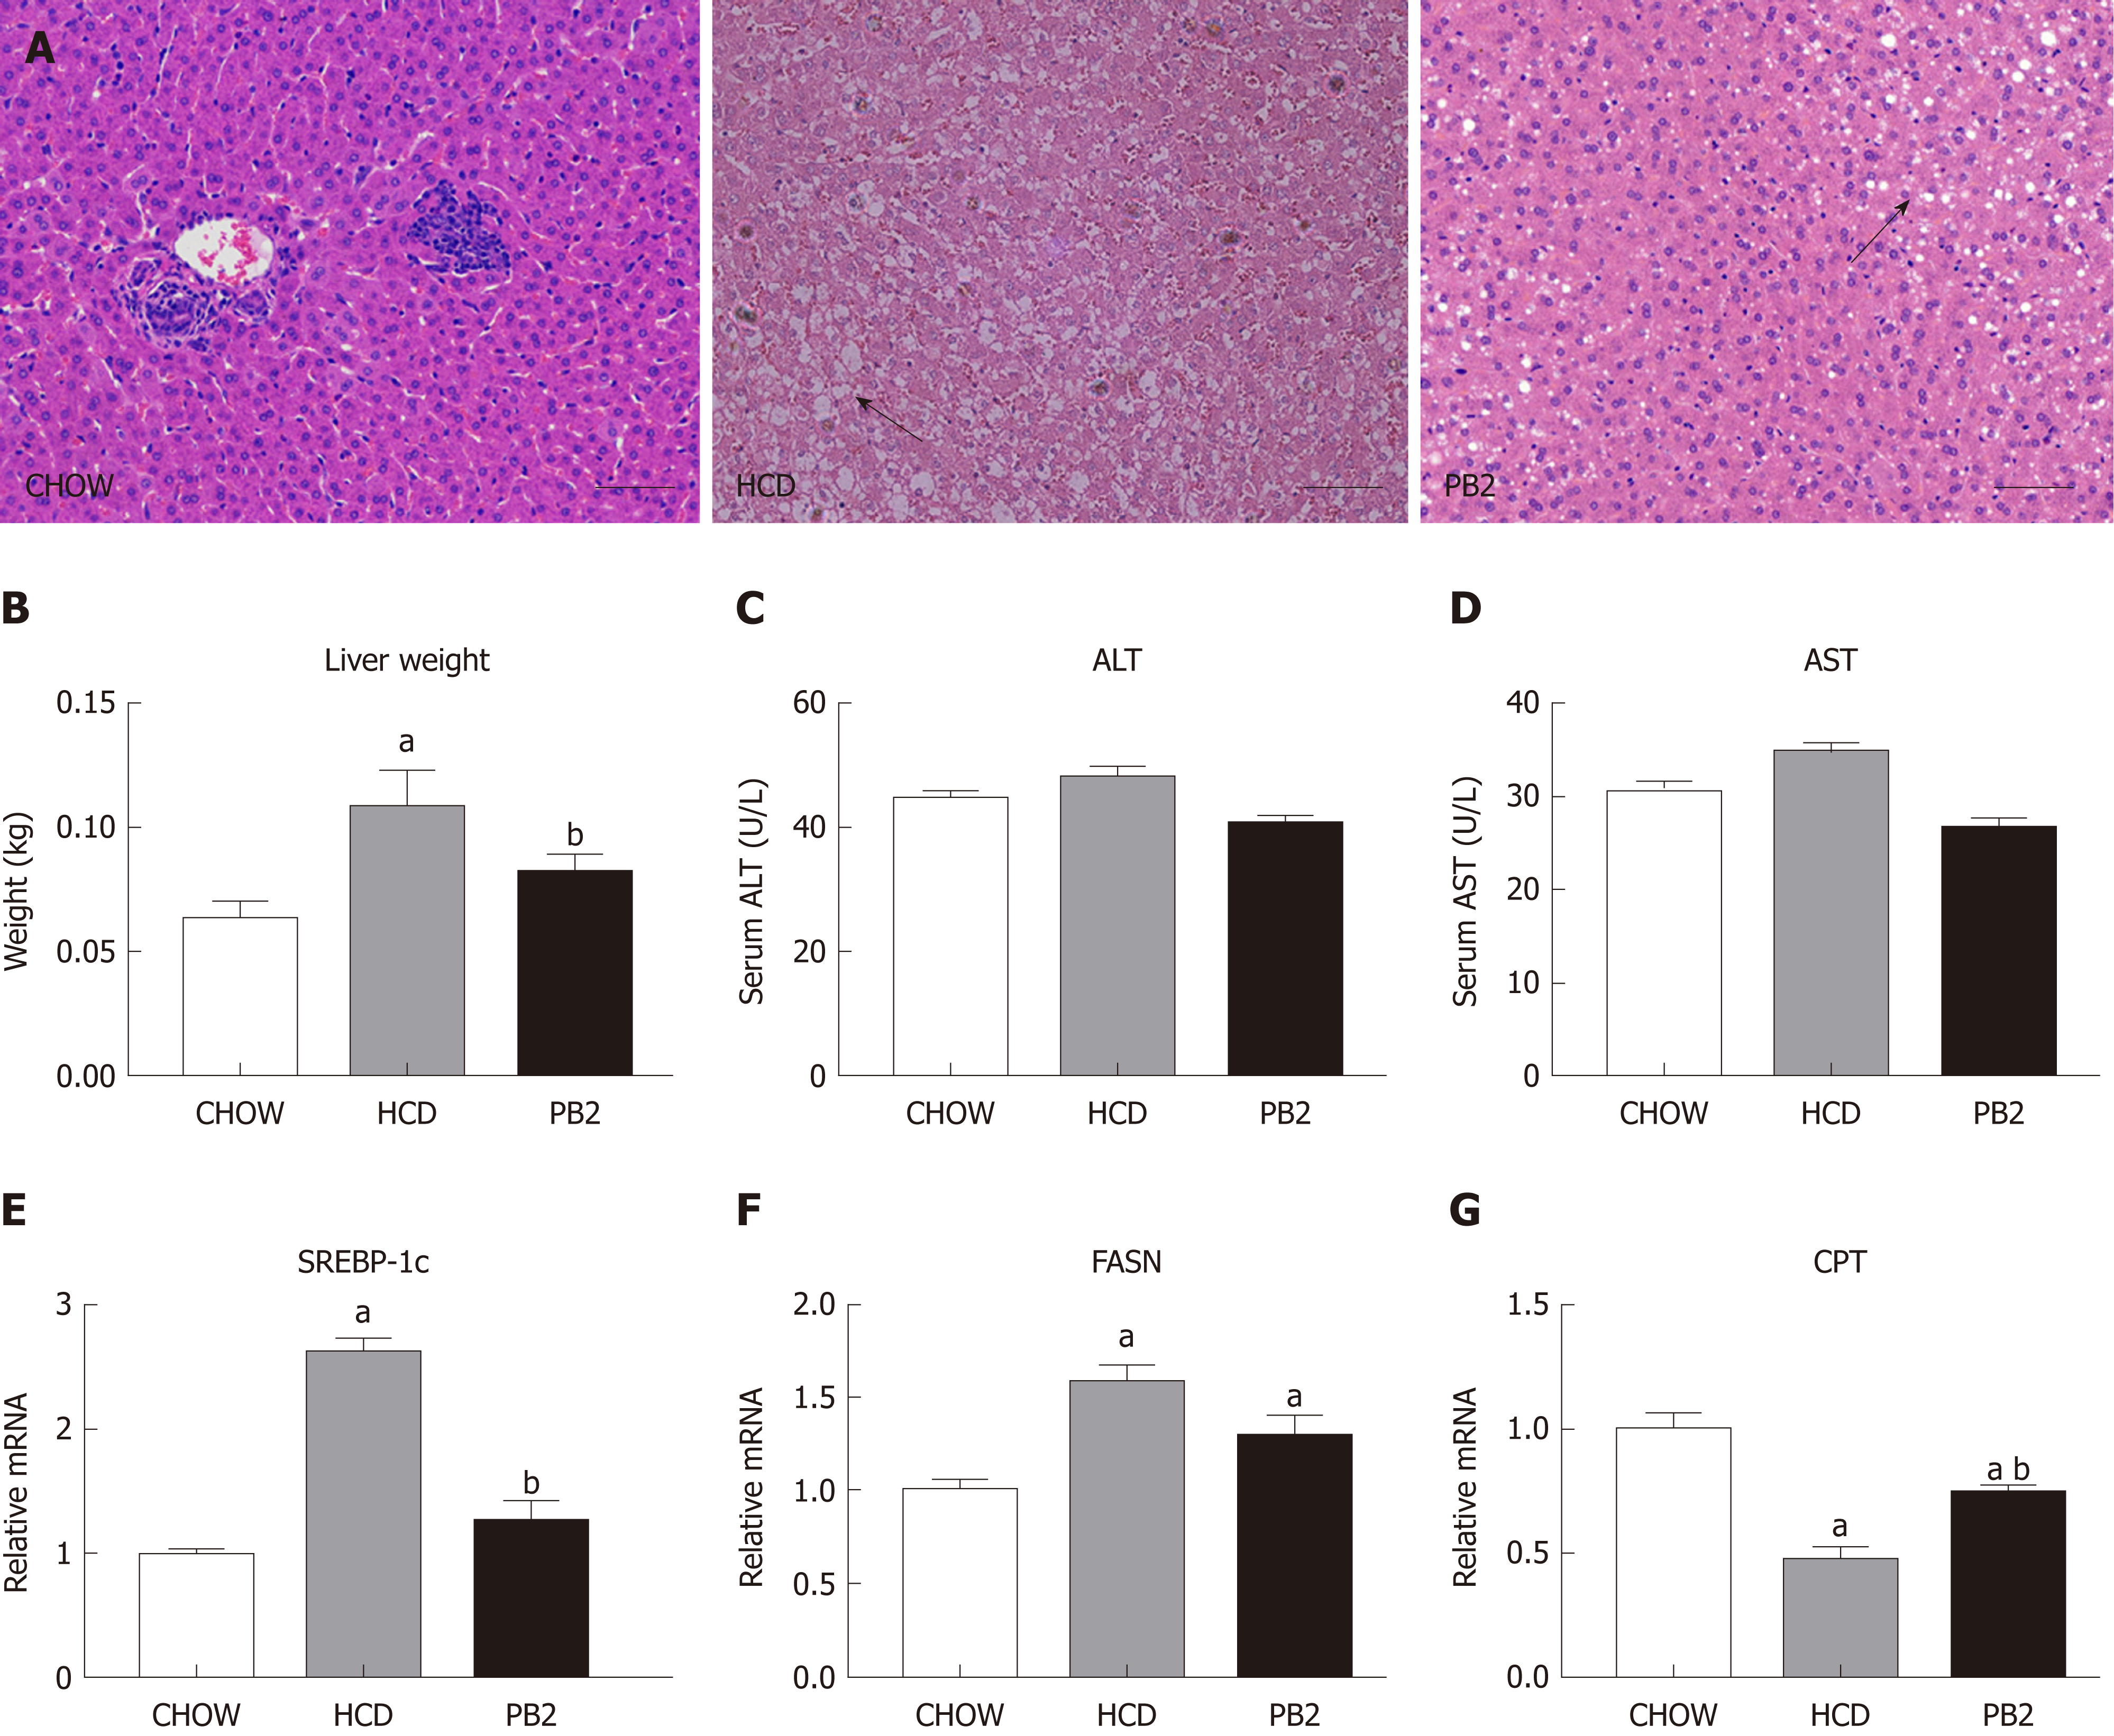
Figure 3 Effects of procyanidin B2 on hepatic steatosis.
A: Hematoxylin and eosin staining of liver in CHOW group, HCD group and procyanidin B2 group; B: Liver weight; C: Alanine transaminase; D: Aspartate transaminase; E: Relative expression levels of steroid response element binding protein 1c; F: Relative expression levels of fatty acid synthase; G: Relative expression levels of carnitine palmitoyltransferase. The data are expressed as means ± SD. aP < 0.05 vs CHOW group; bP < 0.05 vs HCD group. HCD: High-fat-cholesterol diet; PB2: Procyanidin B2; ALT: Alanine transaminase; AST: Aspartate transaminase; SREBP-1c: Steroid response element binding protein 1c; FASN: Fatty acid synthase; CPT: Carnitine palmitoyltransferase; SD: Standard deviation.
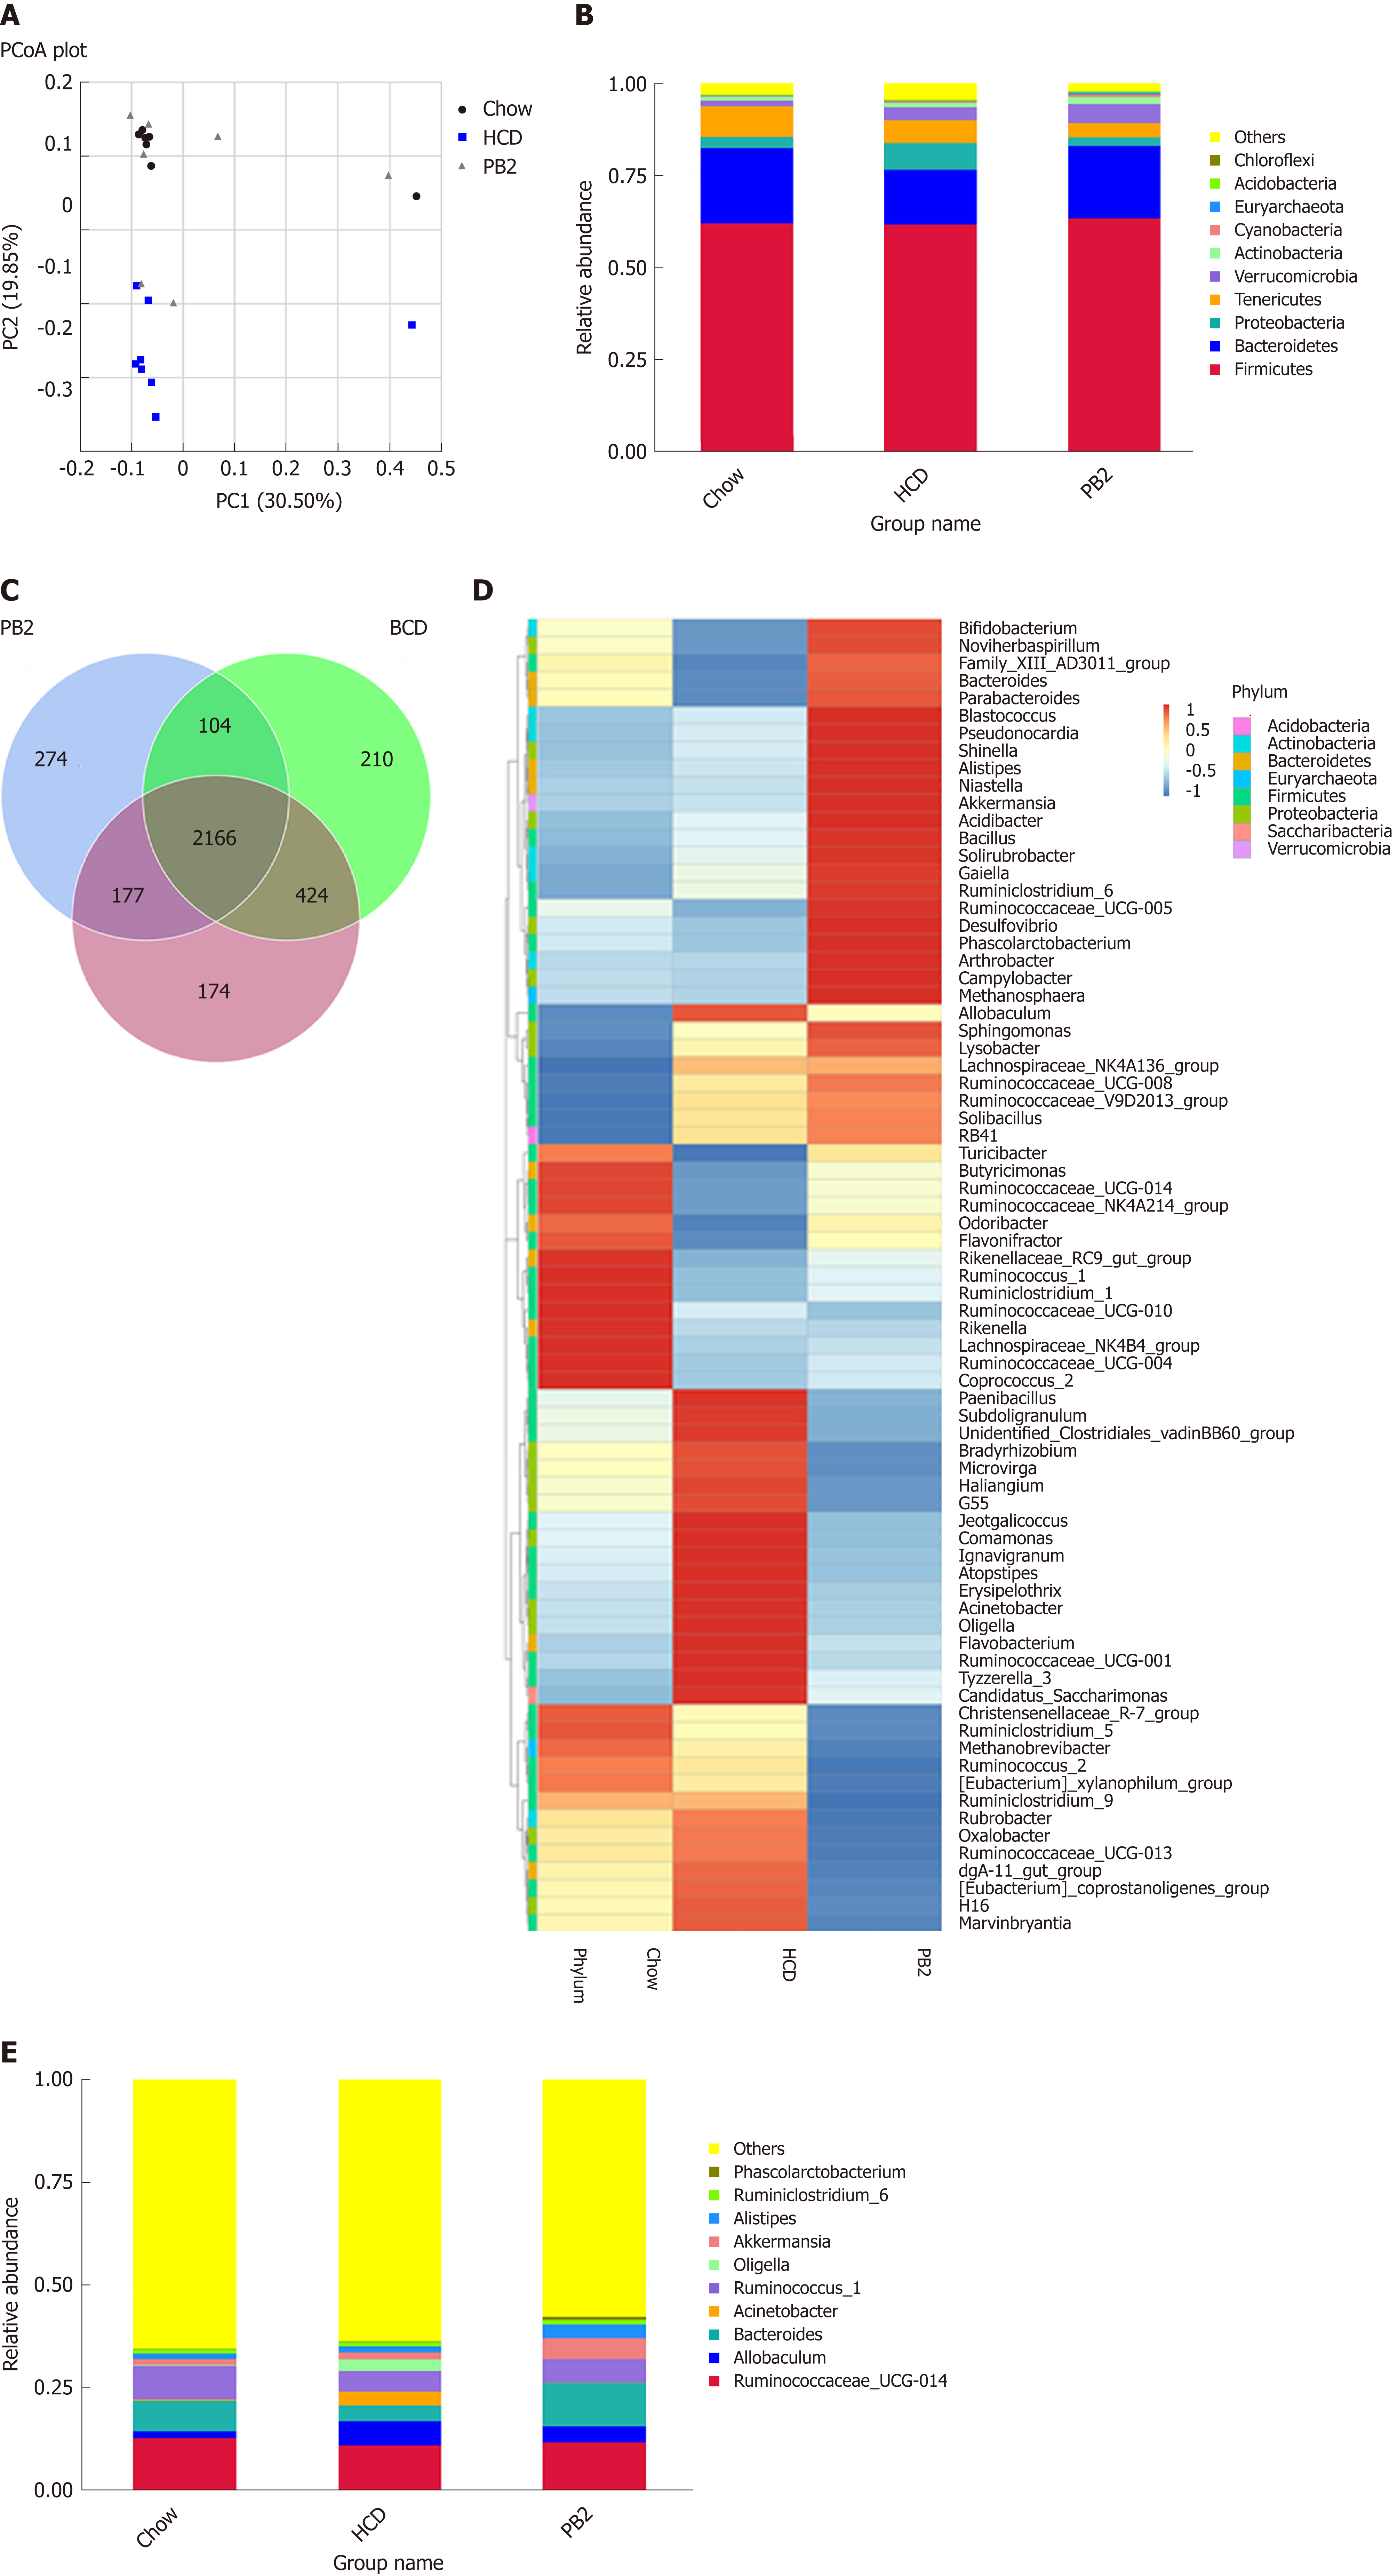
Figure 4 Effects of procyanidin B2 on gut microbiota.
A: Principal coordinate analysis of the gut microbiota based on unweighted UniFrac distances between groups; B: Relative abundance of gut microbiota in phylum; C: Venn diagrams described the number of operational taxonomic units that are distinct and shared across the groups; D: Heatmap: Community hierarchical clustering analysis of major taxonomic groups at genus level, the red represents high relative abundance and the blue represent low relative abundance; E: Relative abundance of gut microbiota in genus. HCD: High-fat-cholesterol diet; PB2: Procyanidin B2; PCoA: Principal coordinate analysis; OTUs: Operational taxonomic units.
- Citation: Xing YW, Lei GT, Wu QH, Jiang Y, Huang MX. Procyanidin B2 protects against diet-induced obesity and non-alcoholic fatty liver disease via the modulation of the gut microbiota in rabbits. World J Gastroenterol 2019; 25(8): 955-966
- URL: https://www.wjgnet.com/1007-9327/full/v25/i8/955.htm
- DOI: https://dx.doi.org/10.3748/wjg.v25.i8.955


