Copyright
©The Author(s) 2019.
World J Gastroenterol. Aug 21, 2019; 25(31): 4468-4480
Published online Aug 21, 2019. doi: 10.3748/wjg.v25.i31.4468
Published online Aug 21, 2019. doi: 10.3748/wjg.v25.i31.4468
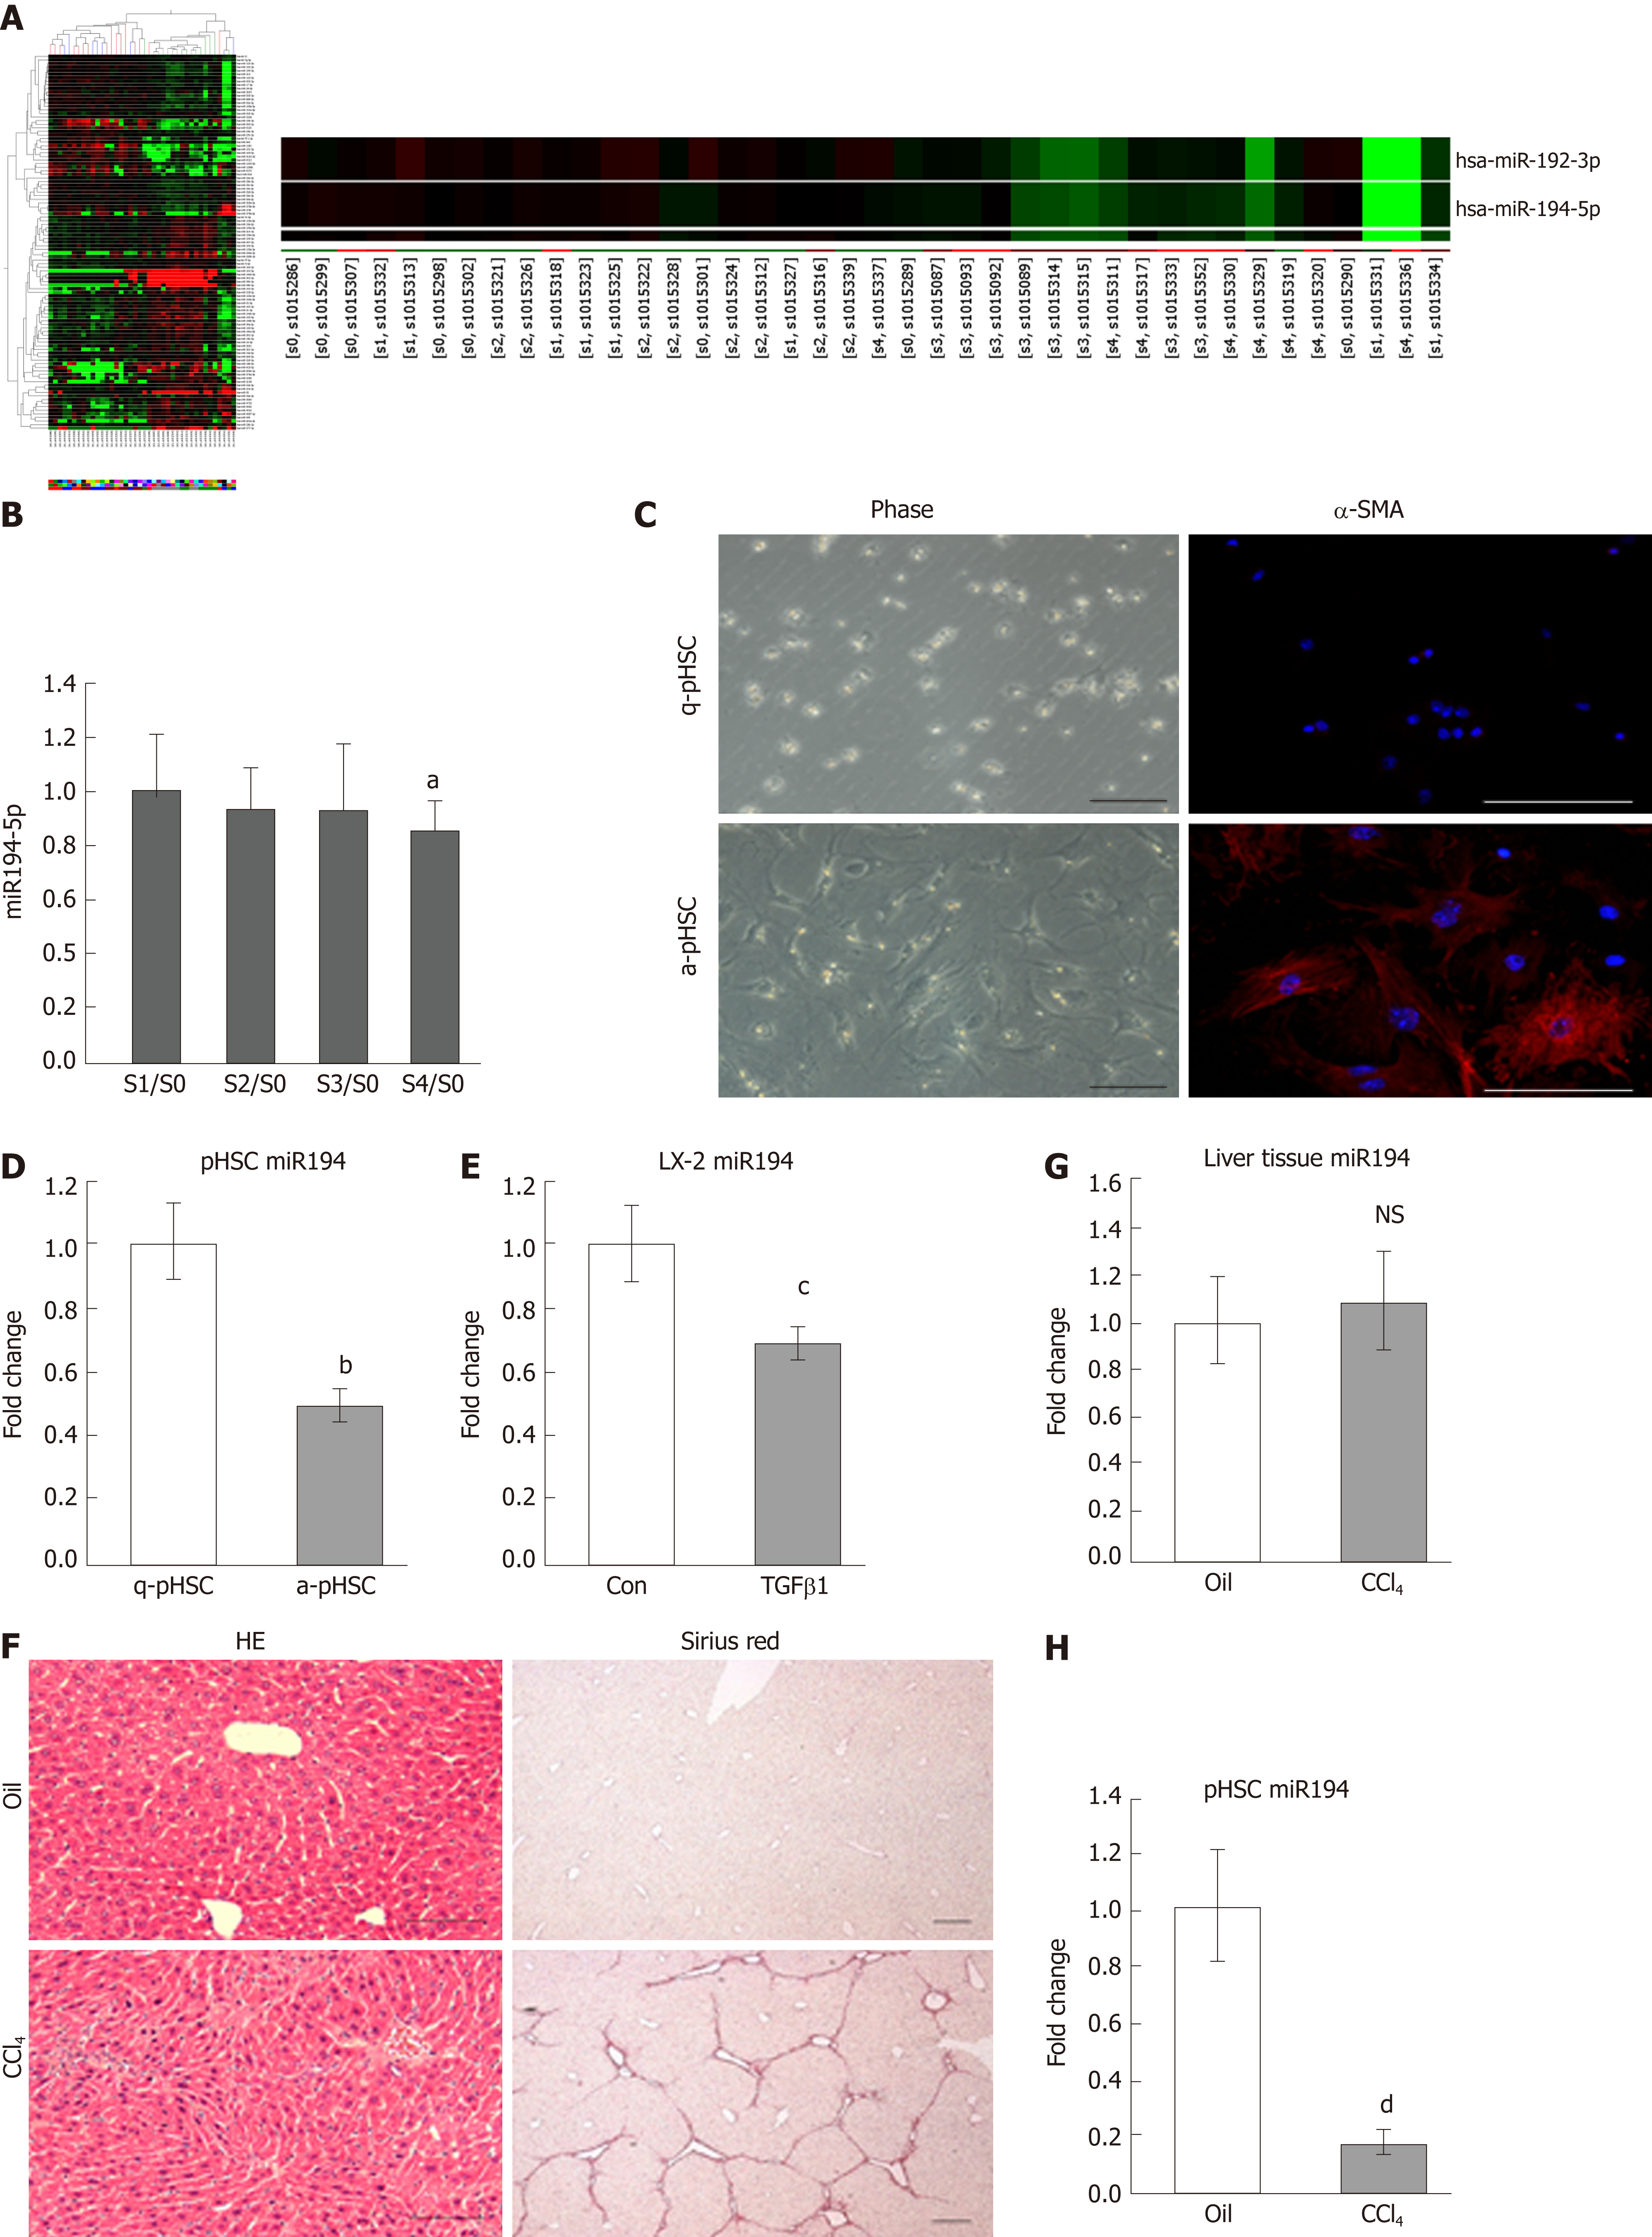
Figure 1 MiR-194 is downregulated in activated hepatic stellate cells from humans and mice.
A: Heatmaps of the microRNA microarray analysis results in the liver of CHB patients; B: The expression of miR-194 measured by qPCR in the liver of CHB patients; C: Morphological and IF images of q-pHSC/a-pHSC. Bar = 100 μm; D: The expression of miR-194 determined by qPCR in pHSCs; E: The expression of miR-194 determined by qPCR in LX2 cells; F: H&E and Sirius Red staining images used to evaluate liver inflammation and fibrosis in CCl4-treated mice. Bar = 100 μm; G: The expression of miR-194 measured by qPCR in liver tissue; H: The expression of miR-194 measured by qPCR in pHSCs isolated from oil- and CCl4-treated mice. aP < 0.05 vs the S0 group; bP < 0.05 vs the q-HSC group; cP < 0.05 vs the con group; dP < 0.05 vs the Oil group. CHB: Chronic hepatitis B; pHSCs: Primary hepatic stellate cells; H&E: Hematoxylin and eosin; CCl4: Carbon tetrachloride.
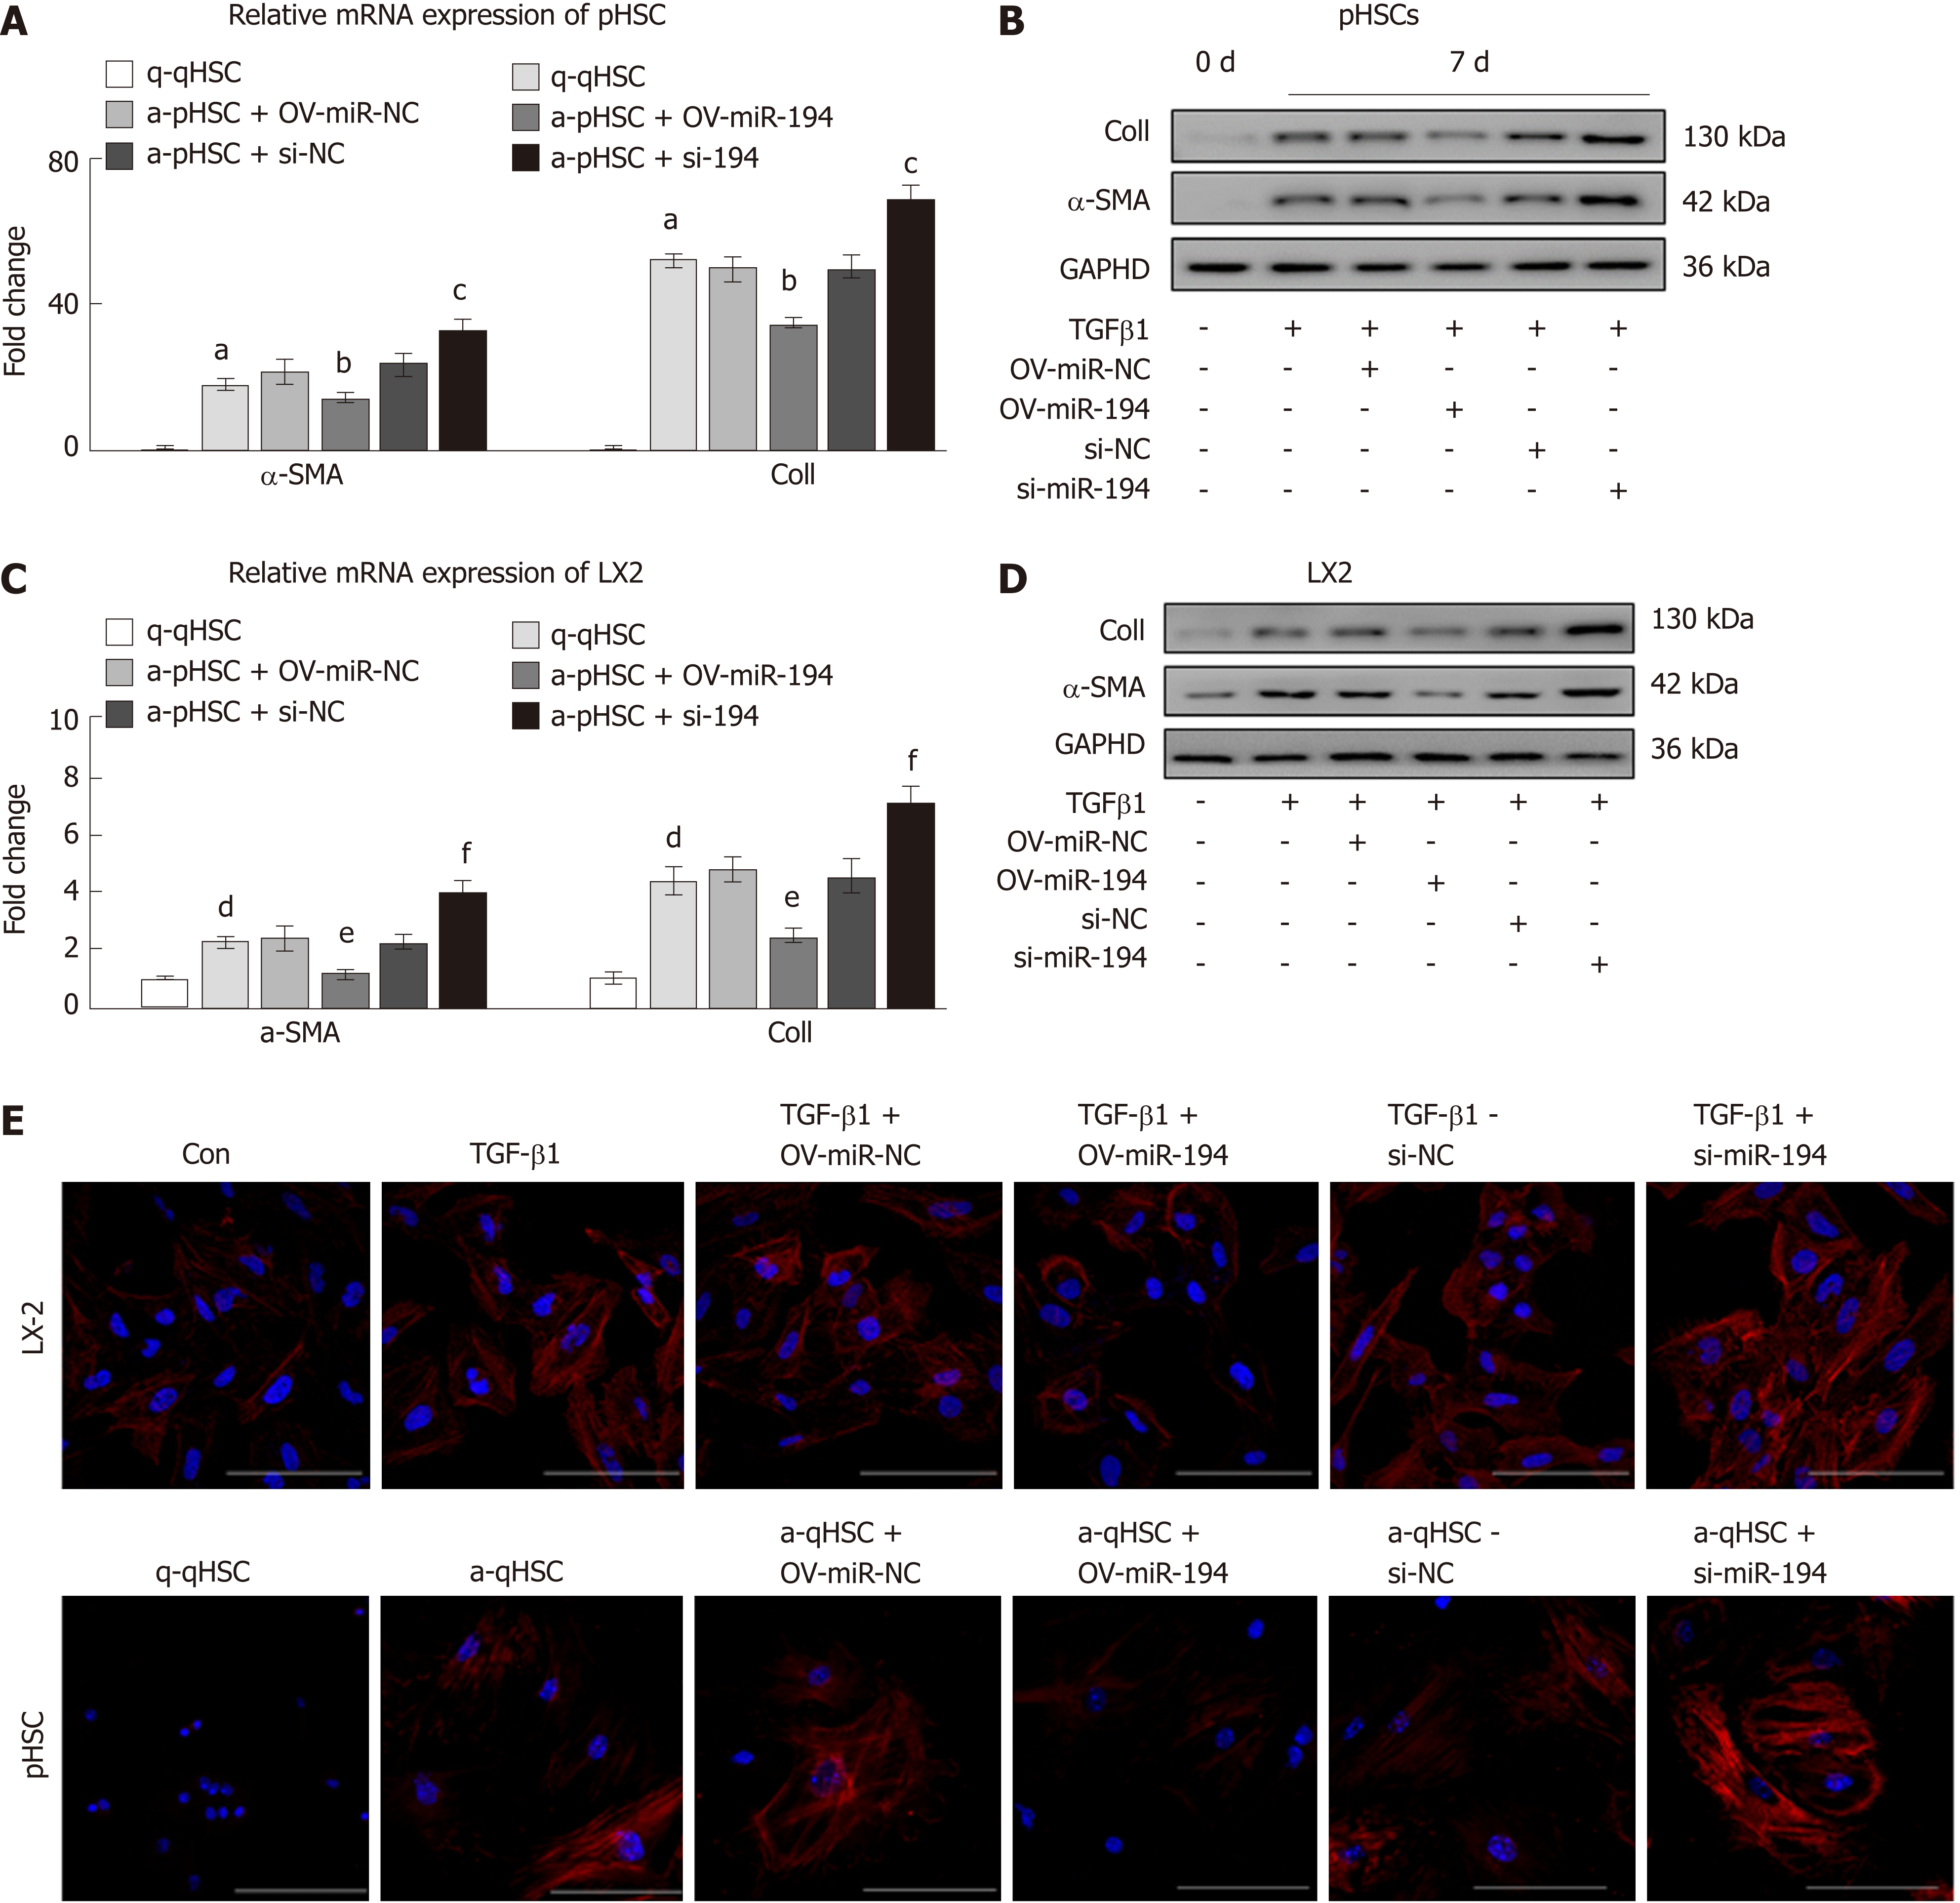
Figure 2 MiR-194 inactivates hepatic stellate cells.
A: PHSCs were transfected with a miR-194 mimic (OV-miR-194) or miR-194 inhibitor (si-miR-194). The mRNA levels of Col I and α-SMA were measured by qPCR; B: The protein levels of Col I and α-SMA measured by Western blot in pHSCs; C: LX2 cells were transfected with a miR-194 mimic (OV-miR-194) or miR-194 inhibitor (si-miR-194). The mRNA levels of Col I and α-SMA were measured by qPCR; D: The protein levels of Col I and α-SMA measured by Western blot in LX2 cells, E: IF of α-SMA was further evaluated in both pHSCs and LX2 cells. Bar = 100 μm. aP < 0.05 vs the q-pHSC group; bP < 0.05 vs the a-pHSC + OV-miR-NC group; cP < 0.05 vs the a-pHSC + si-NC group; dP < 0.05 vs the con group; eP < 0.05 vs the TGF-β1 + OV-miR-NC group; fP < 0.05 vs the TGF-β1 + si-NC group. pHSCs: Primary hepatic stellate cells; α-SMA: α-smooth muscle actin; Col I: Type I collagen.
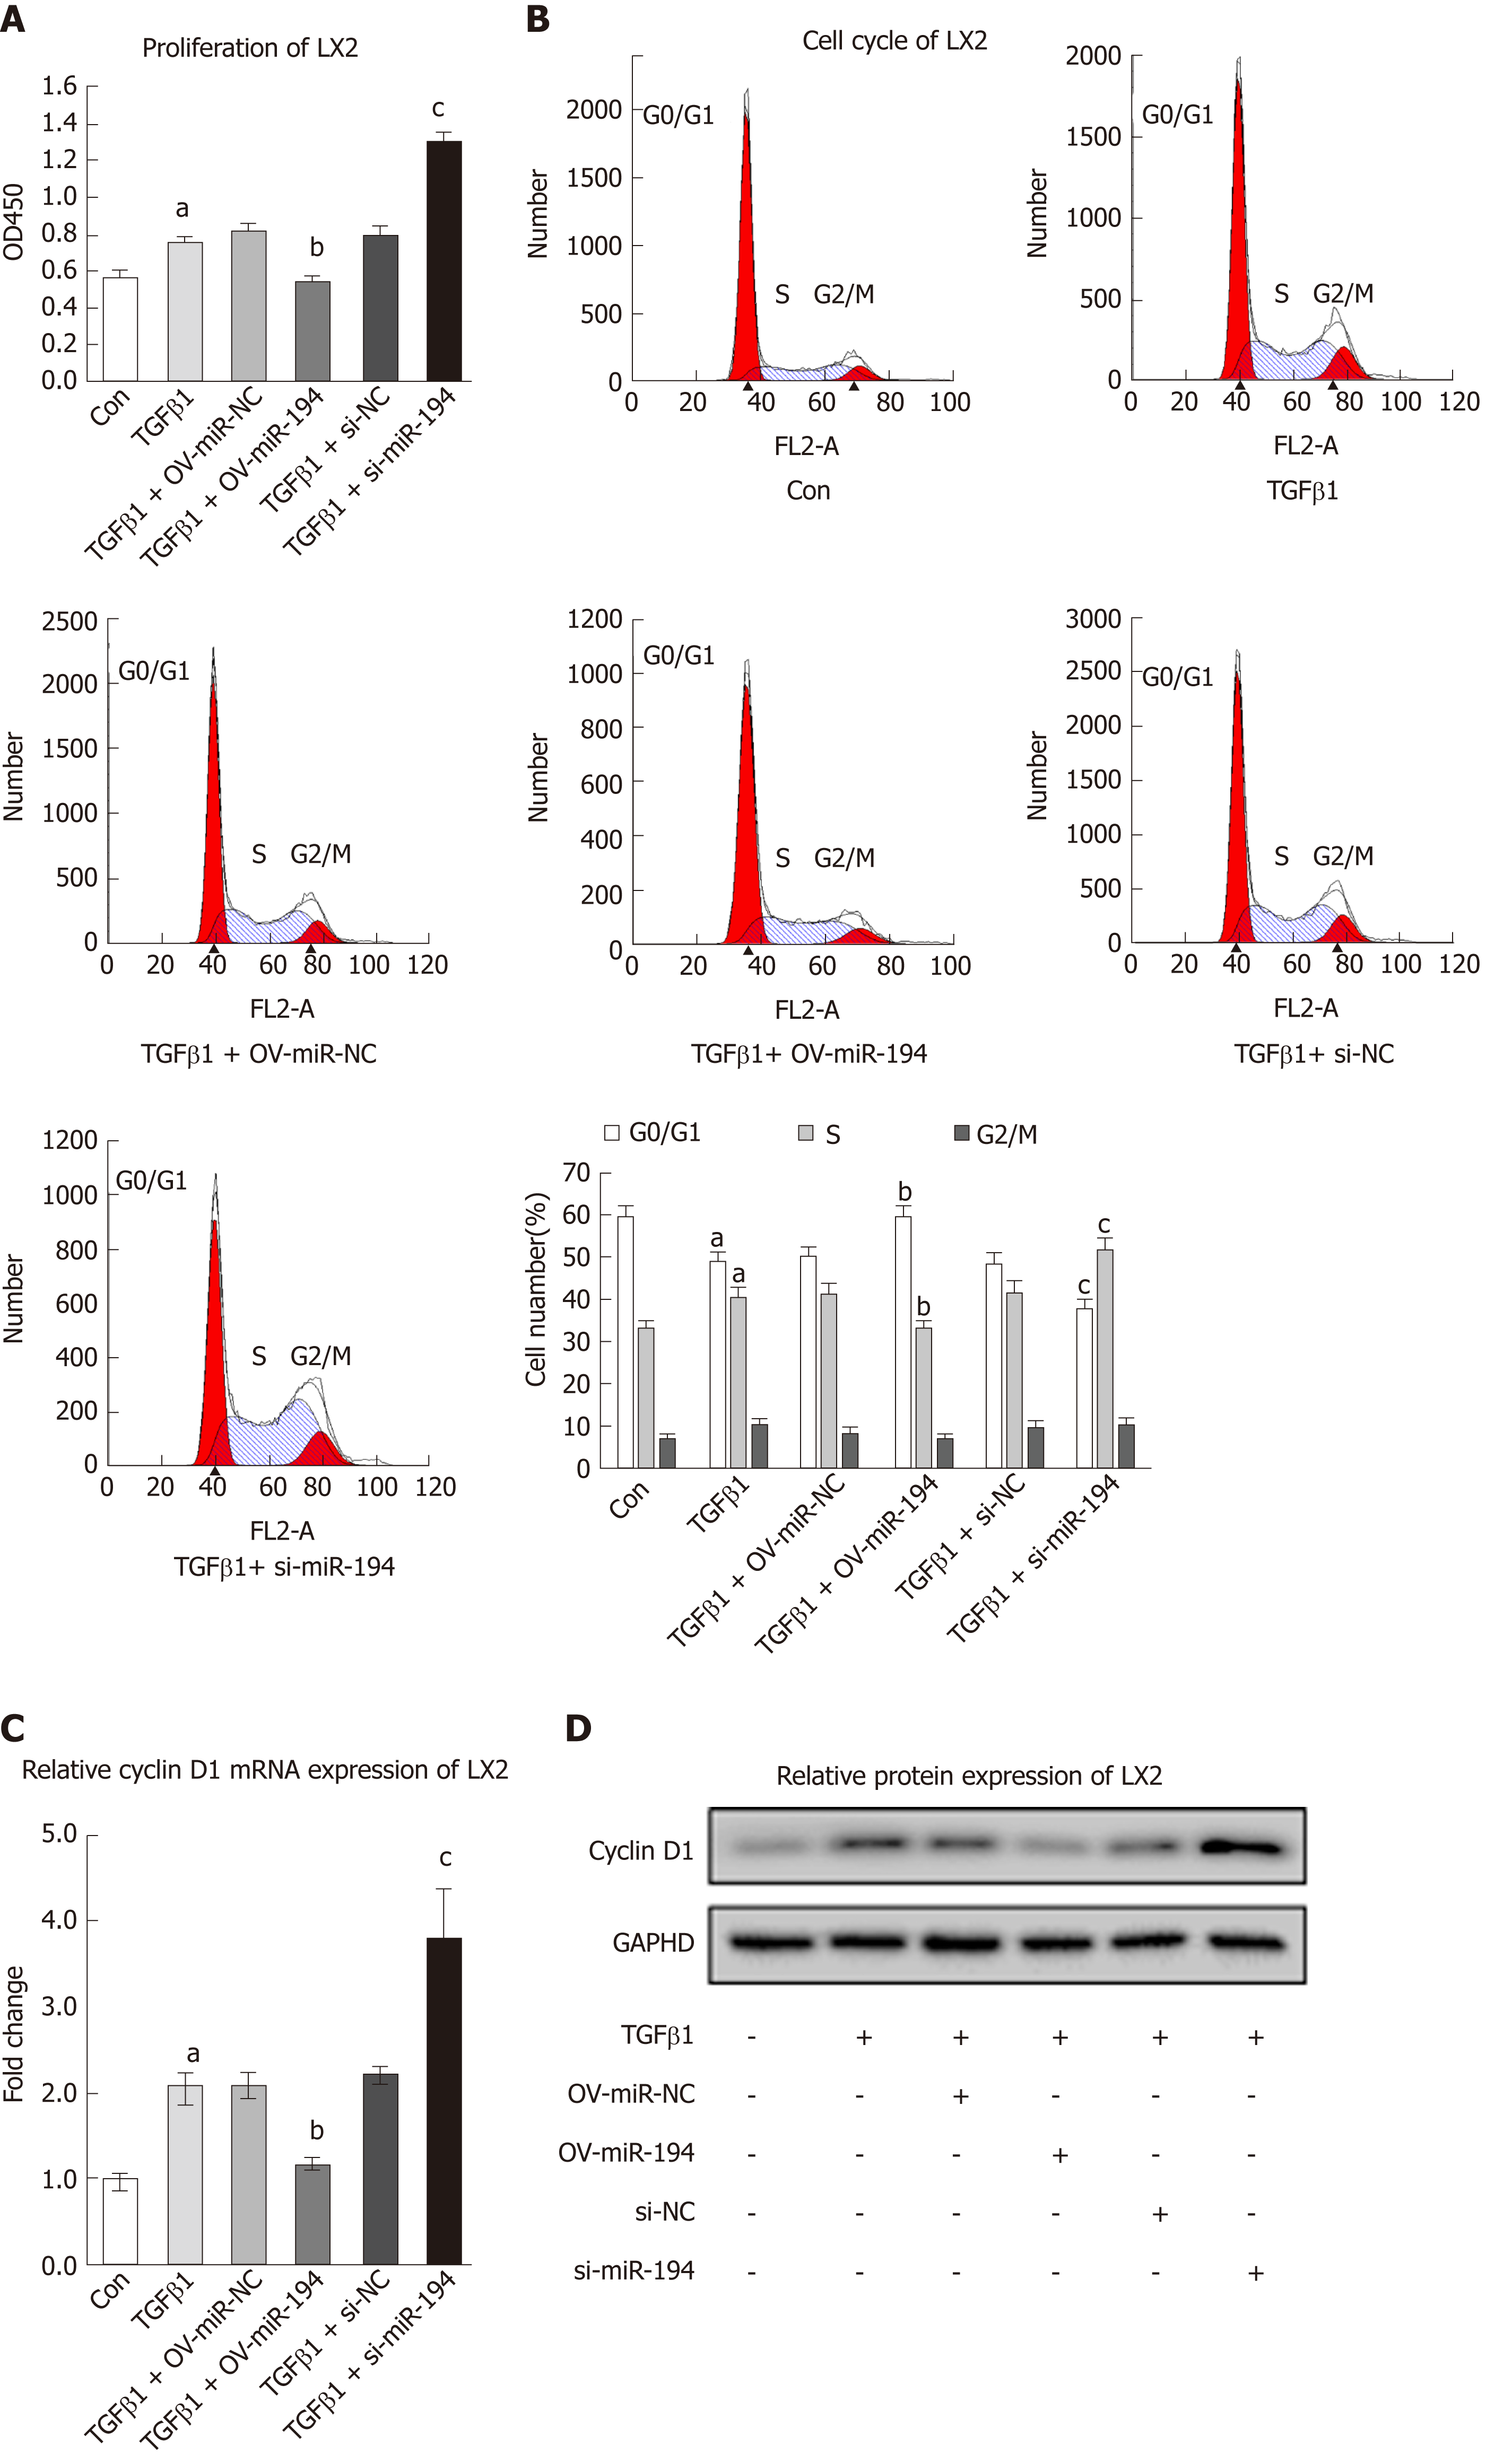
Figure 3 MiR-194 inhibits the proliferation of hepatic stellate cells.
A: LX2 cells were treated with OV-miR-194/si-miR-194±TGF-β1. The CCK8 assay showed the proliferation of LX2 cells; B: The cell cycle was analyzed by flow cytometry; C: The mRNA expression of cyclin D1 analyzed by qPCR; D: The protein expression of cyclin D1 analyzed by Western blot. aP < 0.05 vs the con group; bP < 0.05 vs the TGF-β1 + OV-miR-NC group; cP < 0.05 vs the TGF-β1 + si-NC group.
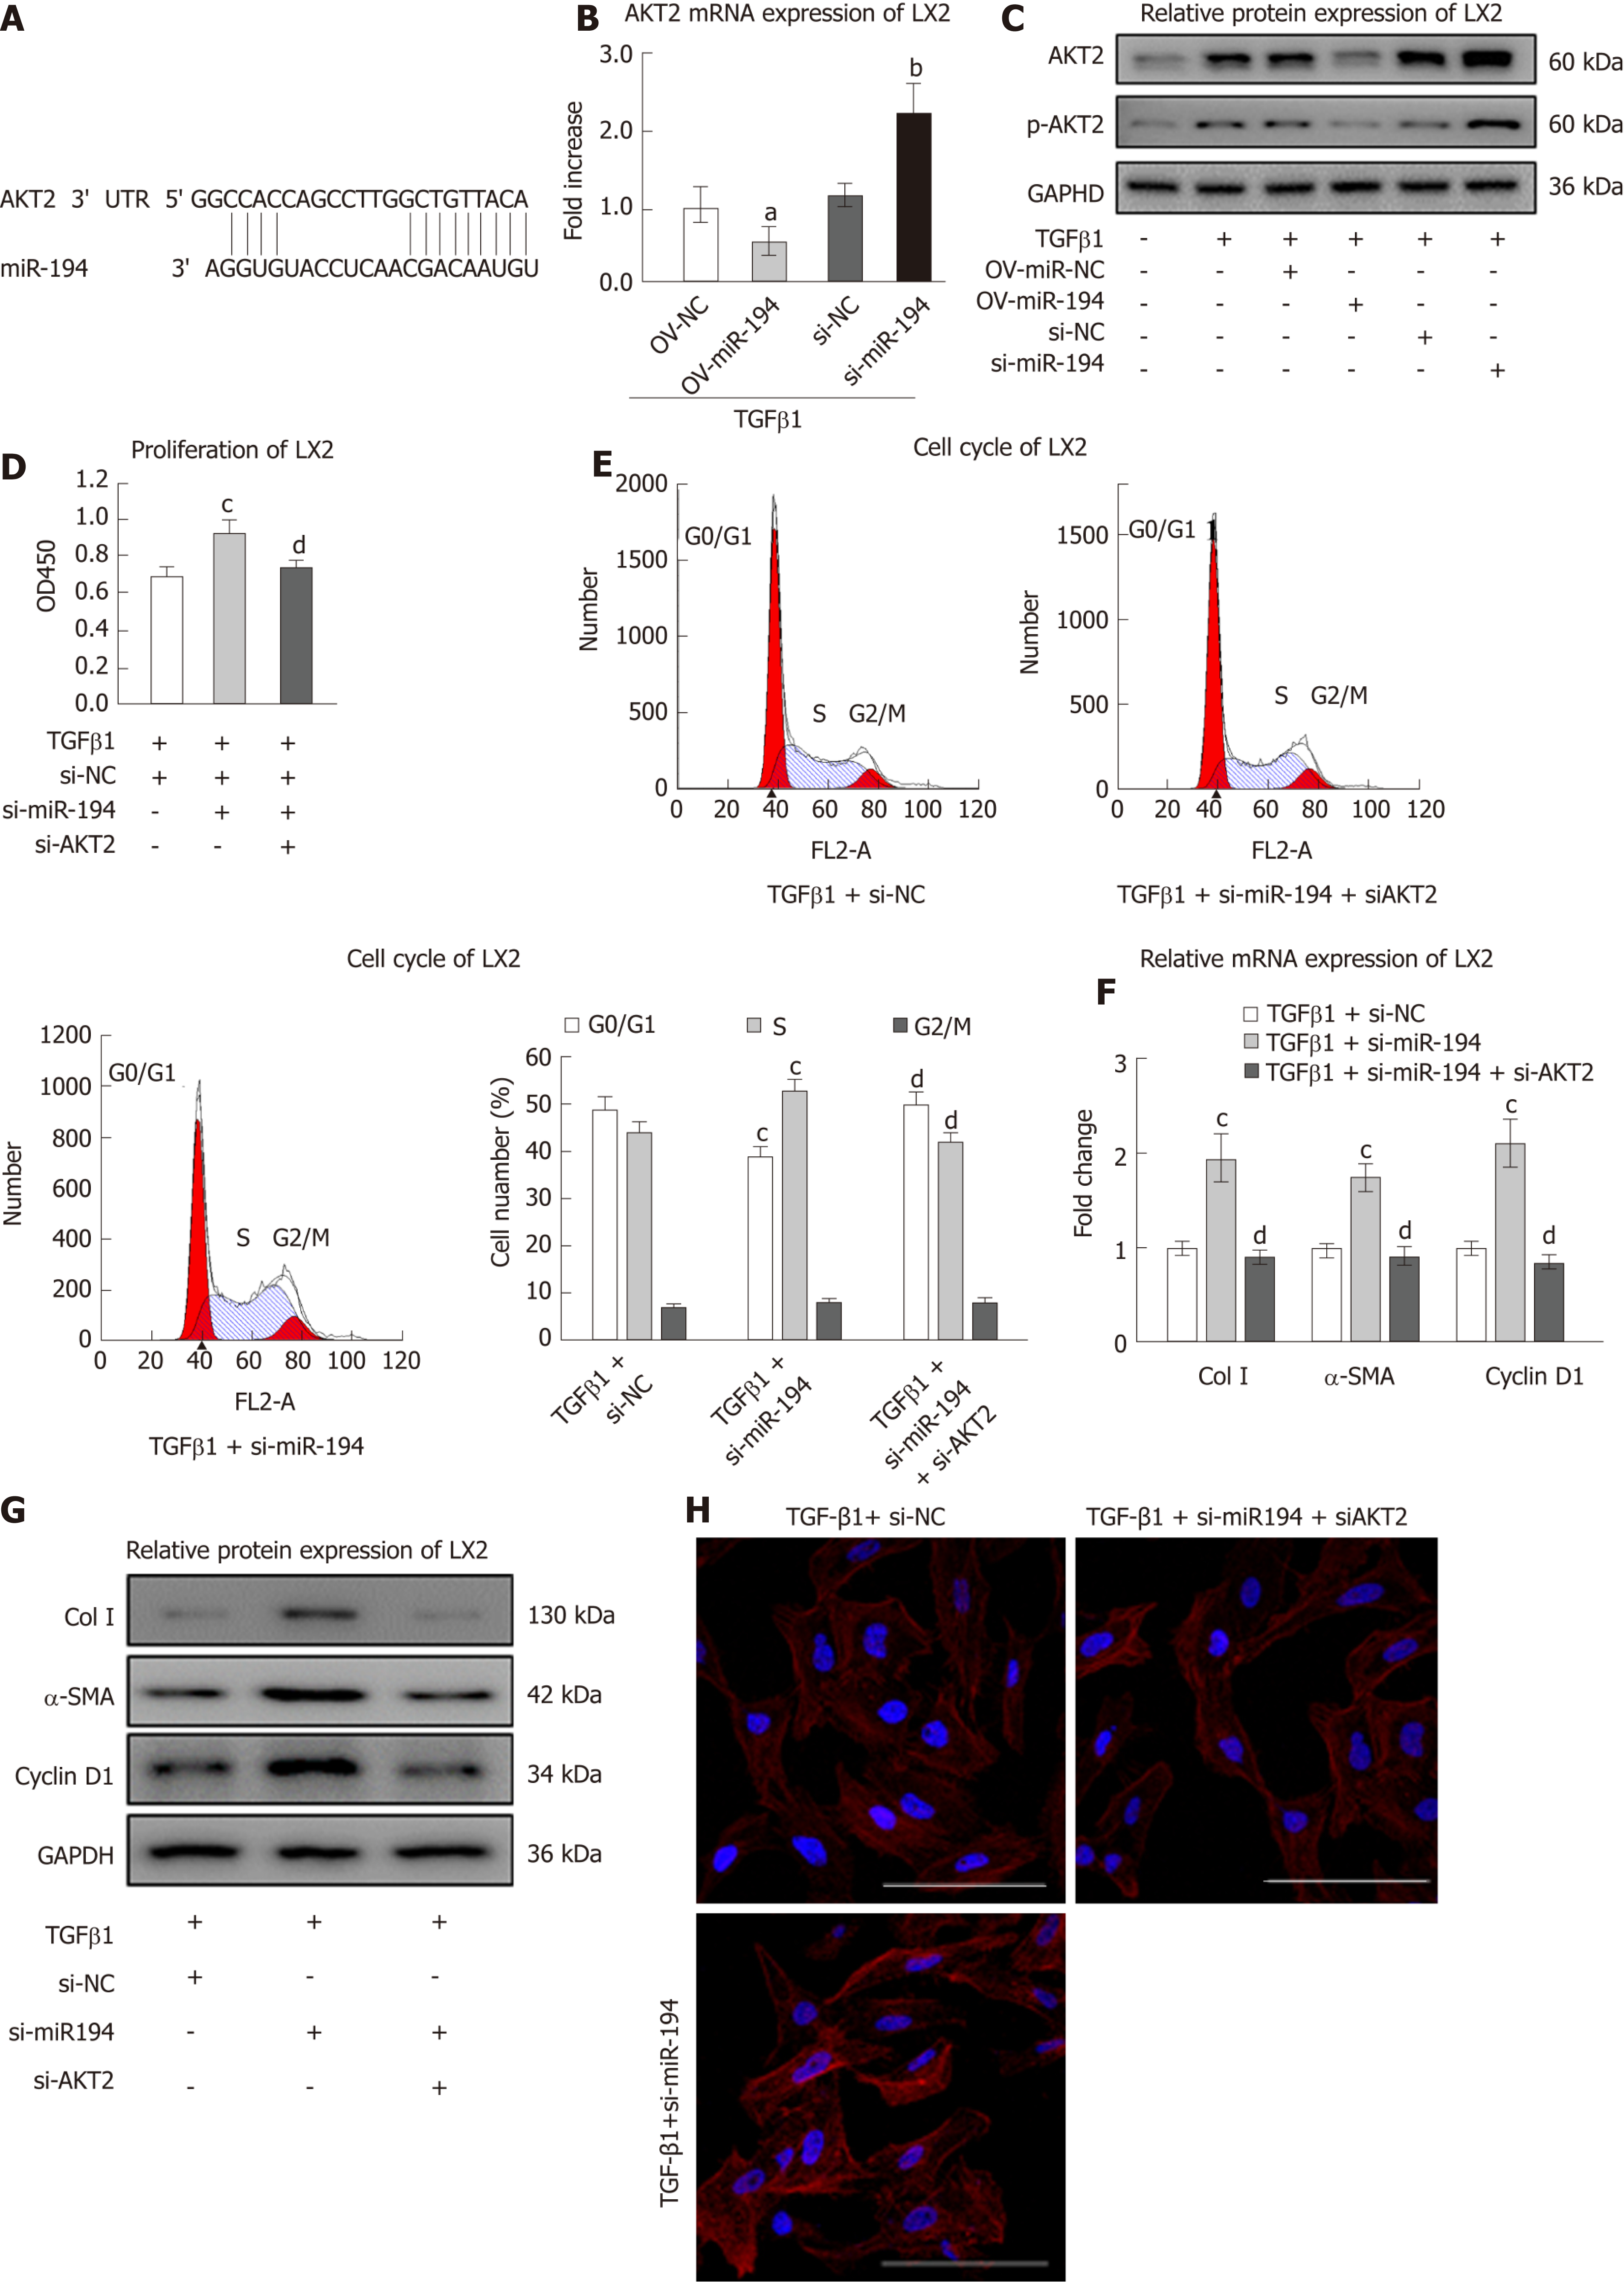
Figure 4 iR-194 performs multiple functions by inhibiting AKT2 in hepatic stellate cells.
A: Binding sites of miR-194 to AKT2 predicted with TargetScan software; B: LX2 cells were treated with OV-miR-194/si-miR-194±TGF-β1. The expression of AKT2 mRNA was measured by qPCR; C: The AKT2/p-AKT2 protein levels measured by Western blot; D: LX2 cells were then transfected with si-miR-194 or si-AKT2. The CCK8 assay showed the proliferation of LX2 cells; E: The cell cycle analyzed by flow cytometry; F: The mRNA expression of Col I, α-SMA, and cyclin D1 measured by qPCR; G: The protein expression of Col I, α-SMA, and cyclin D1 measured by Western blot; H: IF was used to analyze the α-SMA protein levels in LX2 cells. Bar = 100 μm. aP < 0.05 vs the TGF-β1 + OV-miR-NC; bP < 0.05 vs the TGF-β1 + si-NC group group, cP < 0.05 vs the TGF-β1 + si-NC group; dP < 0.05 vs the TGF-β1 + si-miR-194 group. α-SMA: α-smooth muscle actin; Col I: Type I collagen.
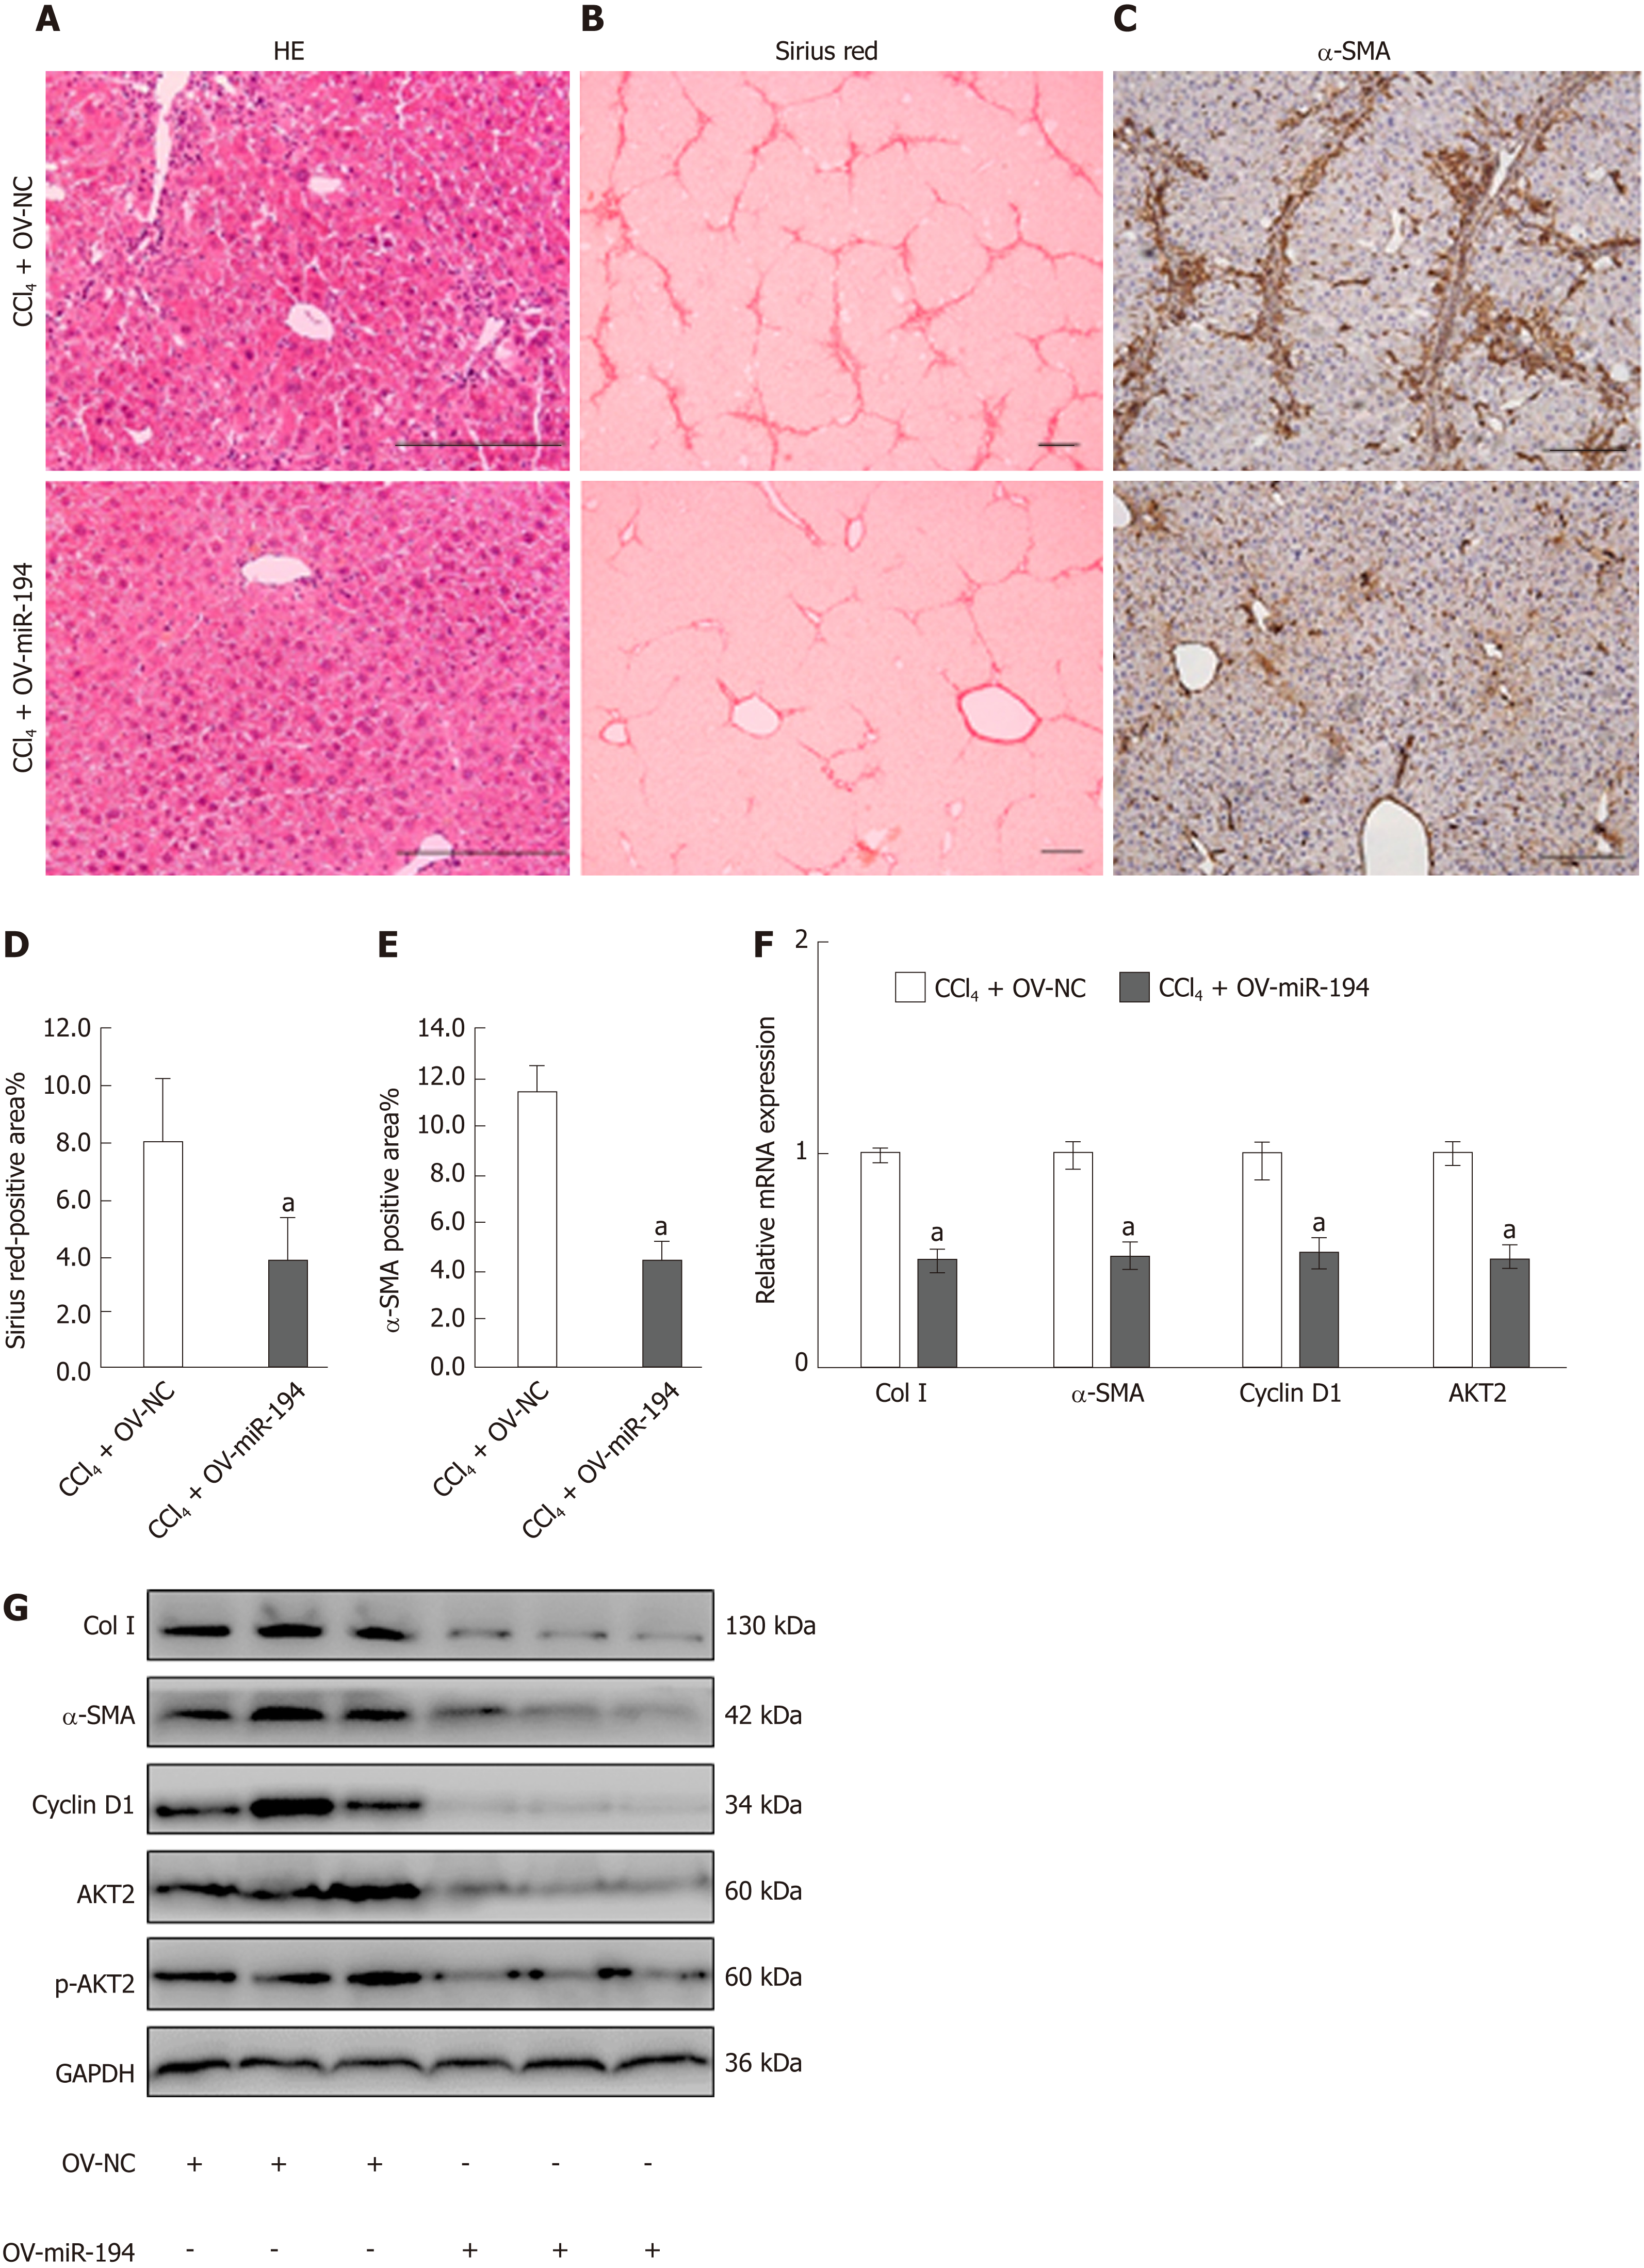
Figure 5 iR-194 alleviates liver fibrosis in carbon tetrachloride treated mice.
A: Liver inflammation evaluated by H&E staining; B/D: Liver fibrosis evaluated by Sirius Red staining; C/E: IHC of α-SMA was further evaluated in the liver of CCl4 ± OV-miR194 mice; F: The mRNA levels of Col I, α-SMA, cyclin D1, and AKT2 measured by qPCR; G: The protein levels of Col I, α-SMA, cyclin D1, and AKT2/p-AKT2 measured by Western blot. Bar = 100 μm. aP < 0.05 vs the CCl4 + OV-NC group. H&E: Hematoxylin and eosin; α-SMA: α-smooth muscle actin; Col I: Type I collagen; IHC: Immunohistochemistry.
- Citation: Wu JC, Chen R, Luo X, Li ZH, Luo SZ, Xu MY. MicroRNA-194 inactivates hepatic stellate cells and alleviates liver fibrosis by inhibiting AKT2. World J Gastroenterol 2019; 25(31): 4468-4480
- URL: https://www.wjgnet.com/1007-9327/full/v25/i31/4468.htm
- DOI: https://dx.doi.org/10.3748/wjg.v25.i31.4468


