Copyright
©The Author(s) 2019.
World J Gastroenterol. Jun 28, 2019; 25(24): 3044-3055
Published online Jun 28, 2019. doi: 10.3748/wjg.v25.i24.3044
Published online Jun 28, 2019. doi: 10.3748/wjg.v25.i24.3044
Figure 1 Masson staining for assessment of liver tissue in each group (×200).
A: Liver tissue from normal mice (normal group); B: Mice with liver fibrosis (fibrosis group); C: Reversal of liver fibrosis in mice (recovery group).
Figure 2 Immunohistochemical staining for α-SMA in liver tissue in each group (×200).
A: Liver tissue from normal mice (normal group); B: Mice with liver fibrosis (fibrosis group); C: Reversal of liver fibrosis in mice (recovery group).
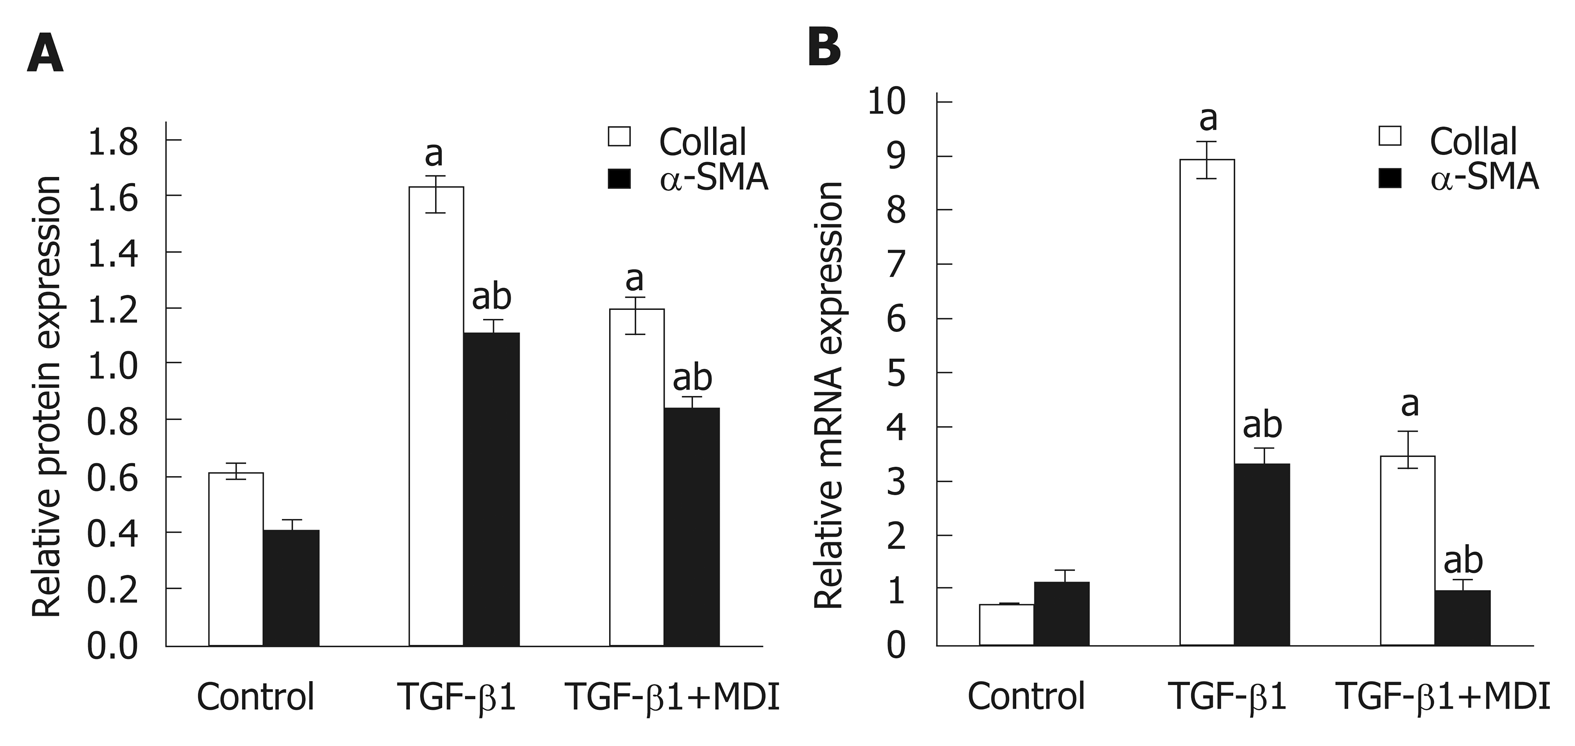
Figure 3 Expression of α-SMA and Col1α1 in LX-2 cells.
A: Relative mRNA expression; B: Quantification of Western blot. aP < 0.05 vs control; bP < 0.05 vs transforming growth factor-β1. TGF-β1: Transforming growth factor-β1.
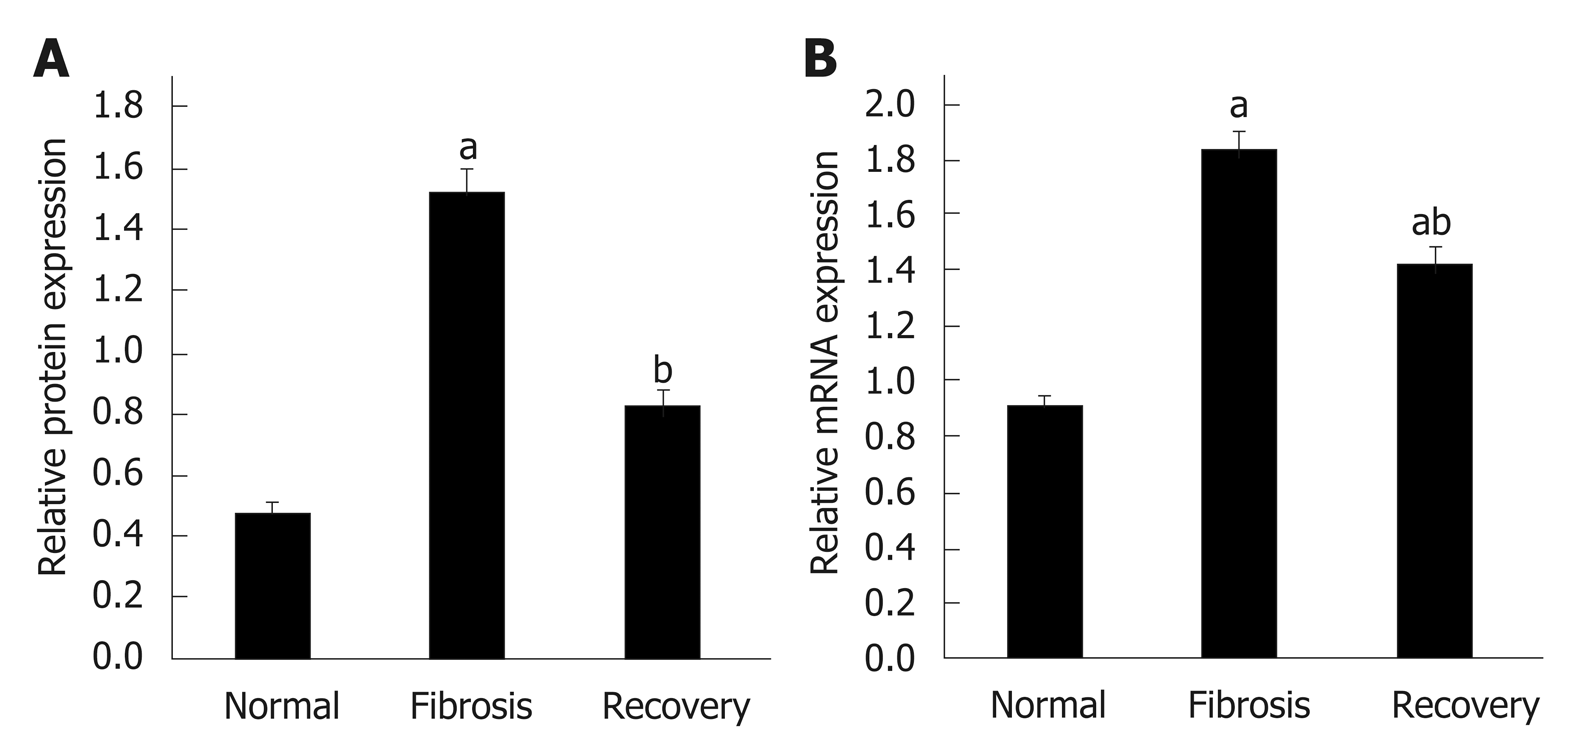
Figure 4 Expression level of NLRC5 in each group of mice.
A: Relative mRNA expression; B: Quantification of Western blot. aP < 0.05 vs normal; bP < 0.05 vs fibrosis.
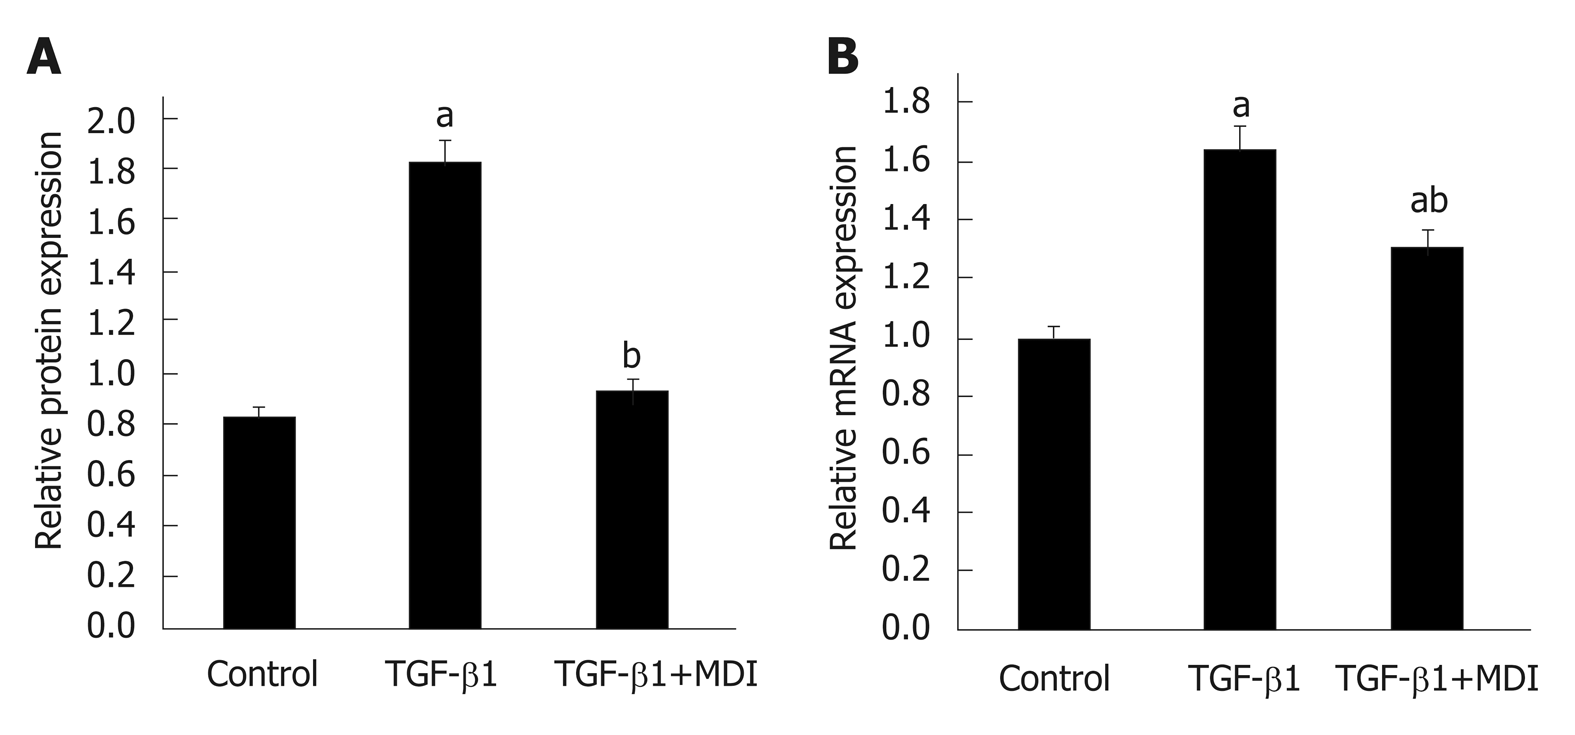
Figure 5 Expression level of NLRC5 in LX-2 cells.
A: Relative mRNA expression; B: Quantification of Western blot. aP < 0.05 vs control; bP < 0.05 vs transforming growth factor-β1. TGF-β1: Transforming growth factor-β1.
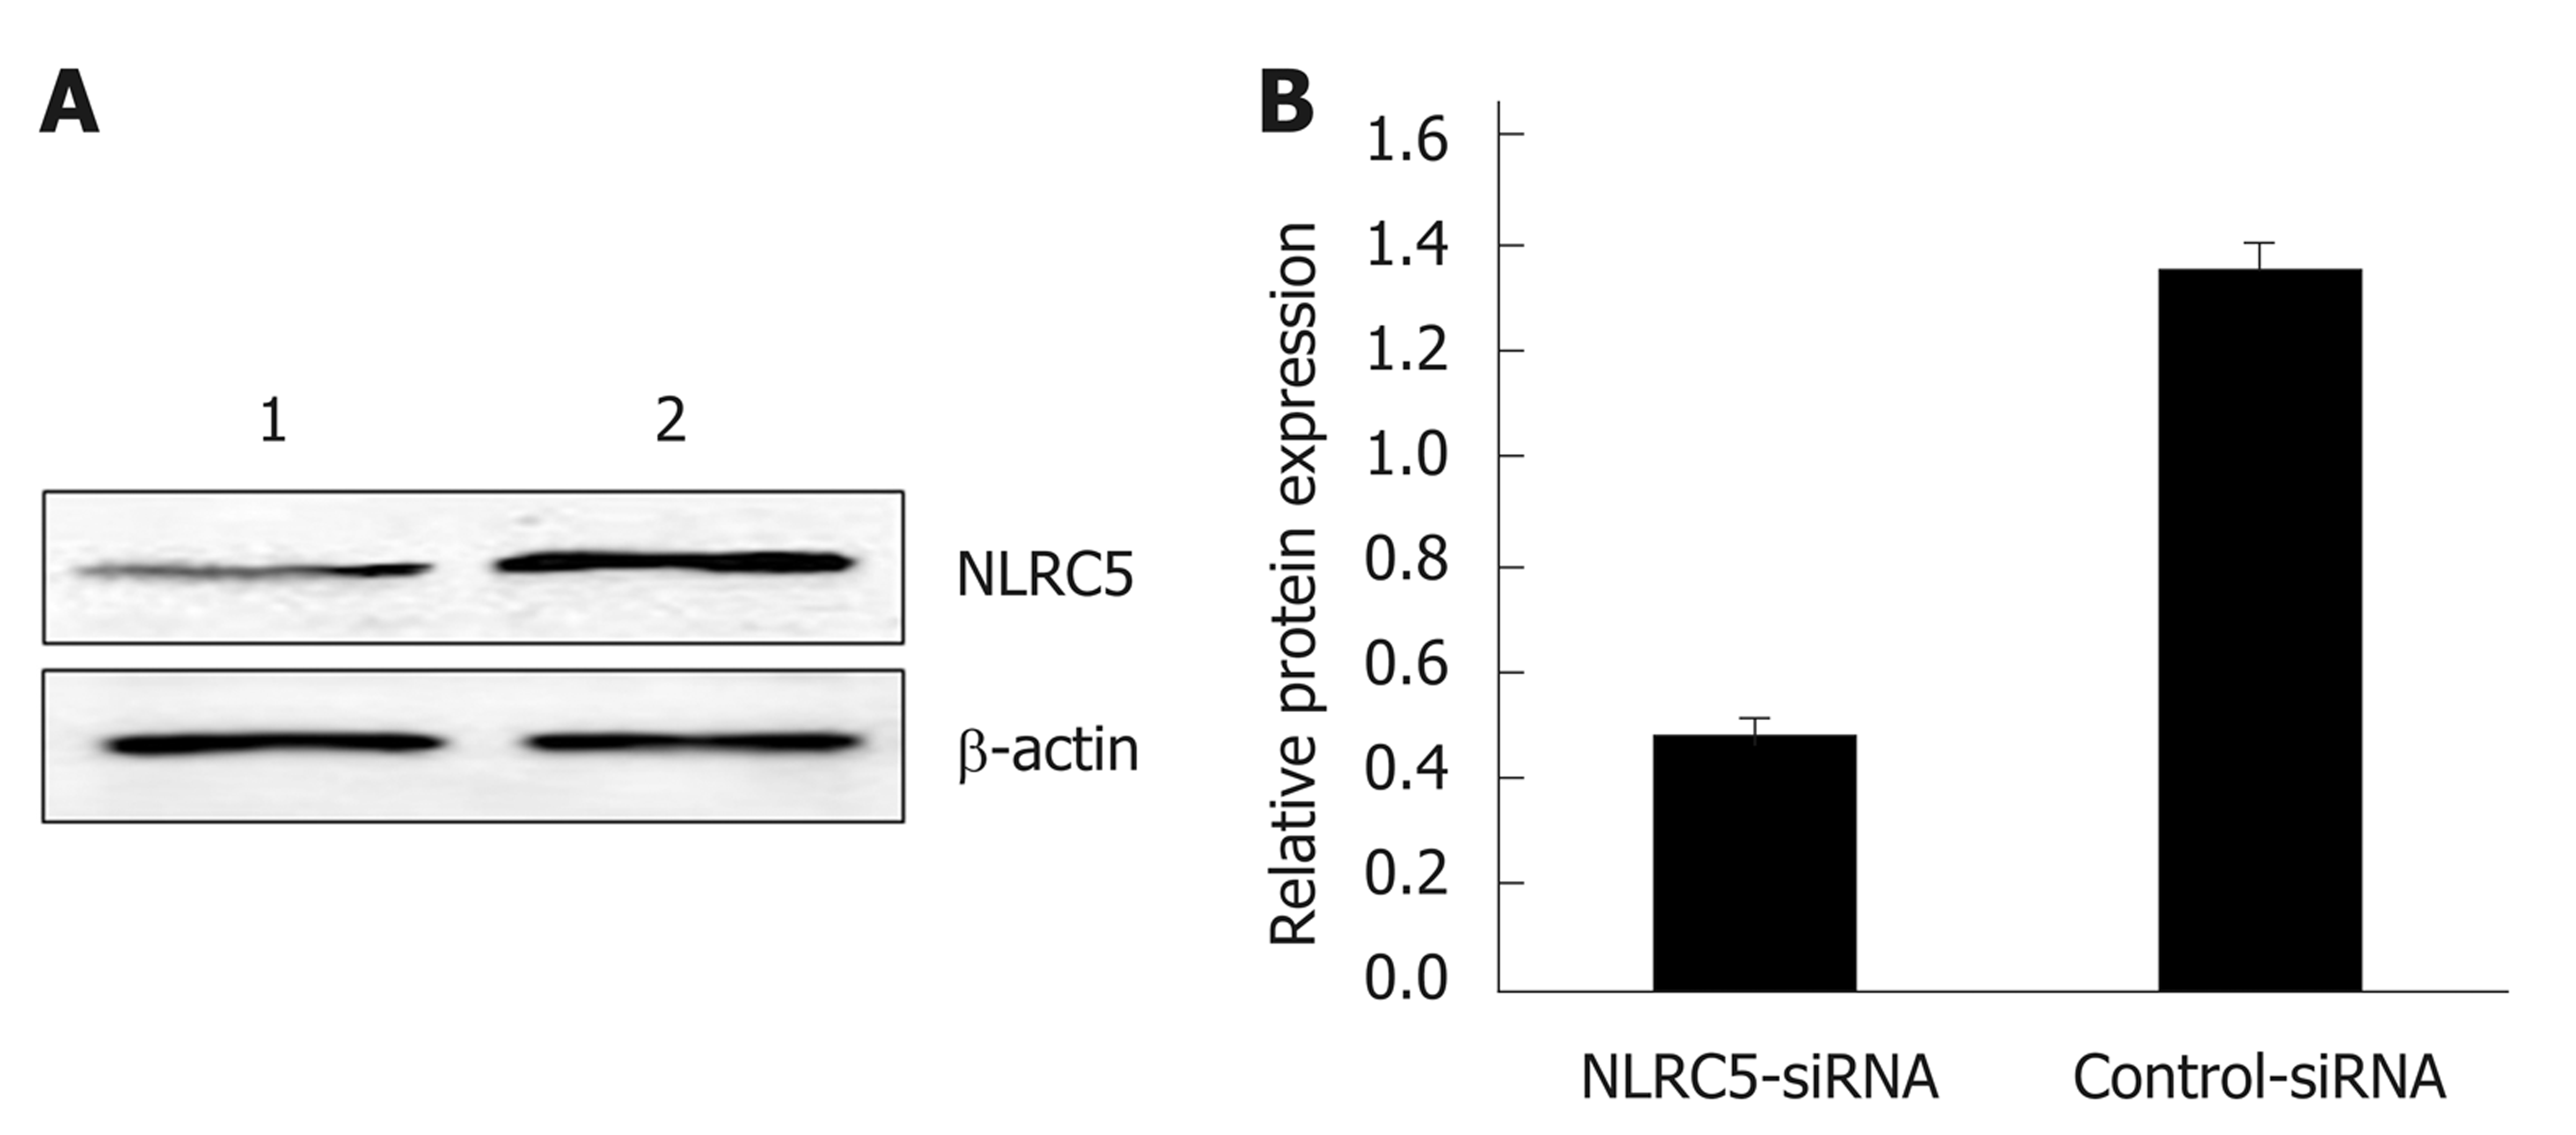
Figure 6 Effect of NLRC5 knockdown in LX-2 cells.
A: Western blot; B: Quantification of Western blot. Lane 1: LX-2 cells transfected with NLRC5-siRNA; Lane 2: LX-2 cells transfected with control-siRNA; aP < 0.05 vs control-siRNA.
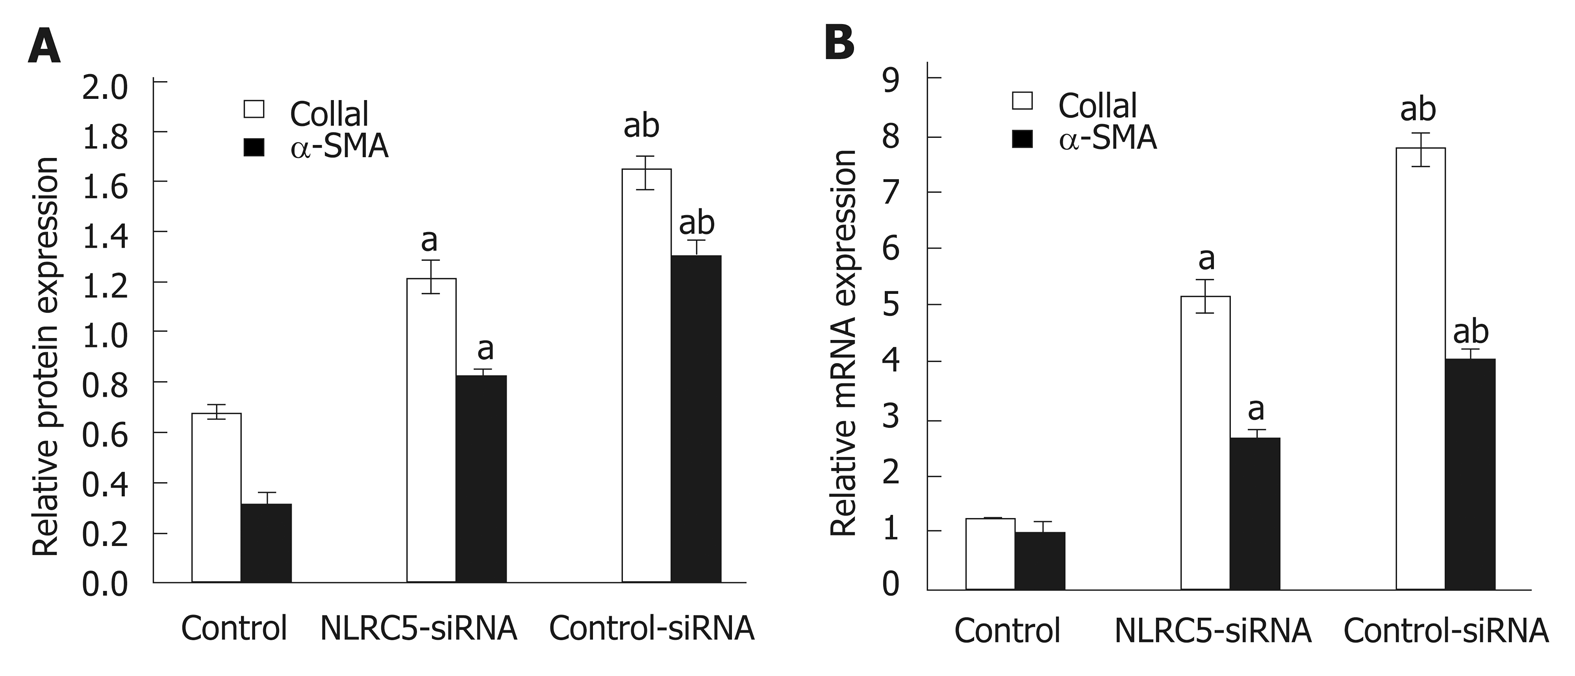
Figure 7 Effect of NLRC5 knockdown on α-SMA and Col1a1 expression in LX-2 cells.
A: Relative mRNA expression; B: Quantification of Western blot. aP < 0.05 vs control; bP < 0.05 vs NLRC5-siRNA.
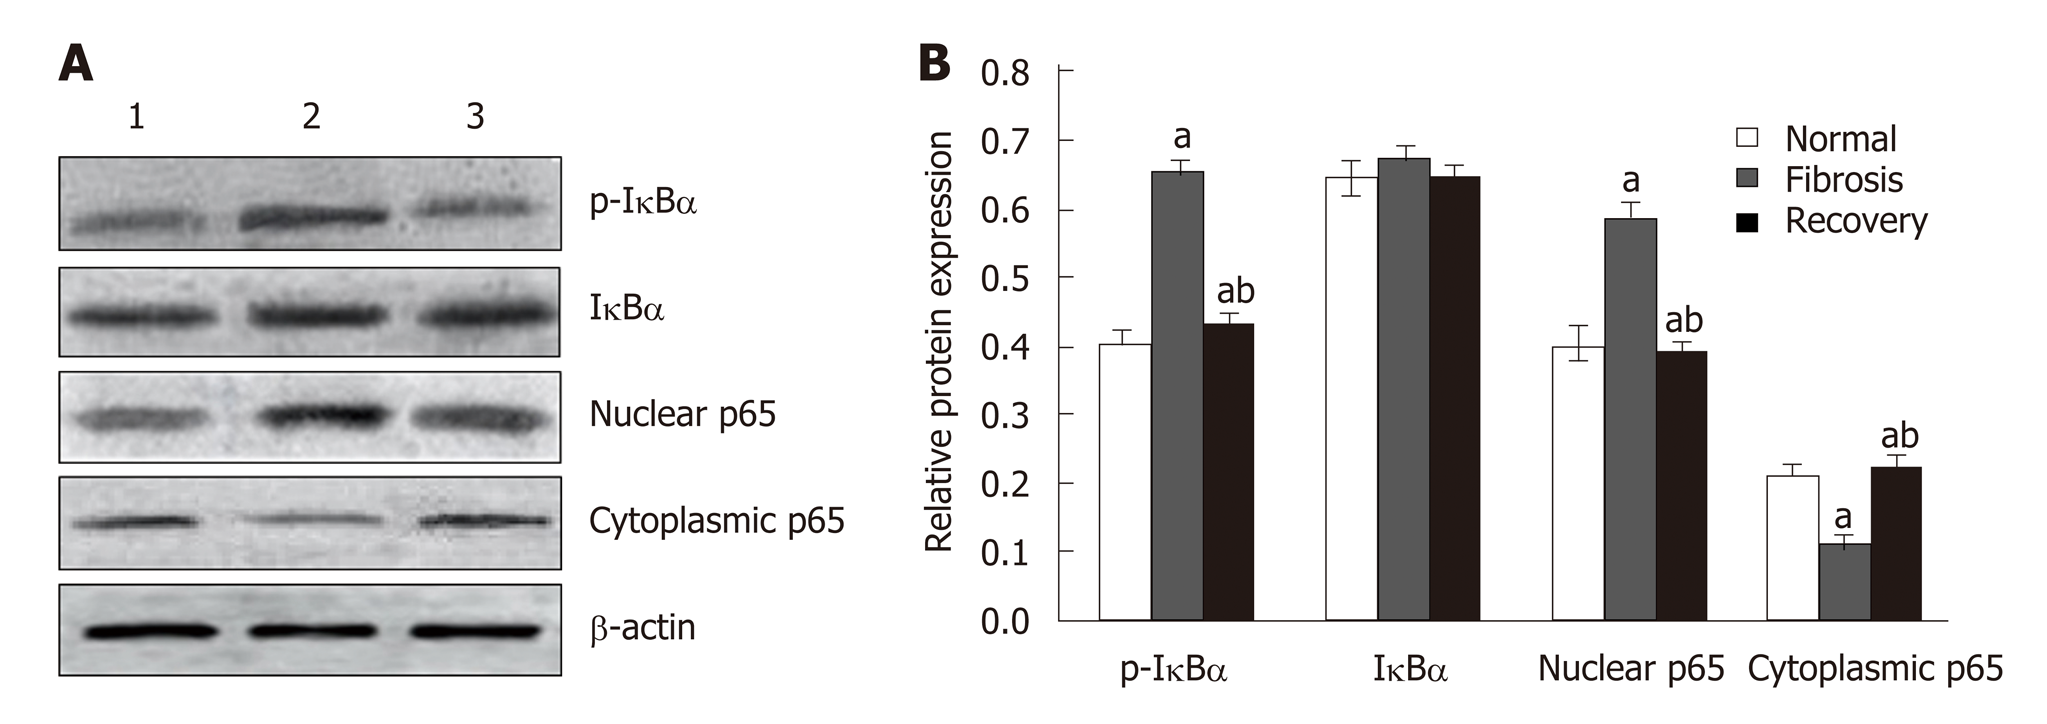
Figure 8 Effect of NLRC5 on nuclear factor-κB activity in mice hepatocytes.
A: Western blot; B: Quantification of Western blot. Lane 1: Normal mice (normal group); Lane 2: Mice with liver fibrosis (fibrosis group); Lane 3: Reversal of liver fibrosis in mice (recovery group); aP < 0.05 vs normal; bP < 0.05 vs fibrosis.
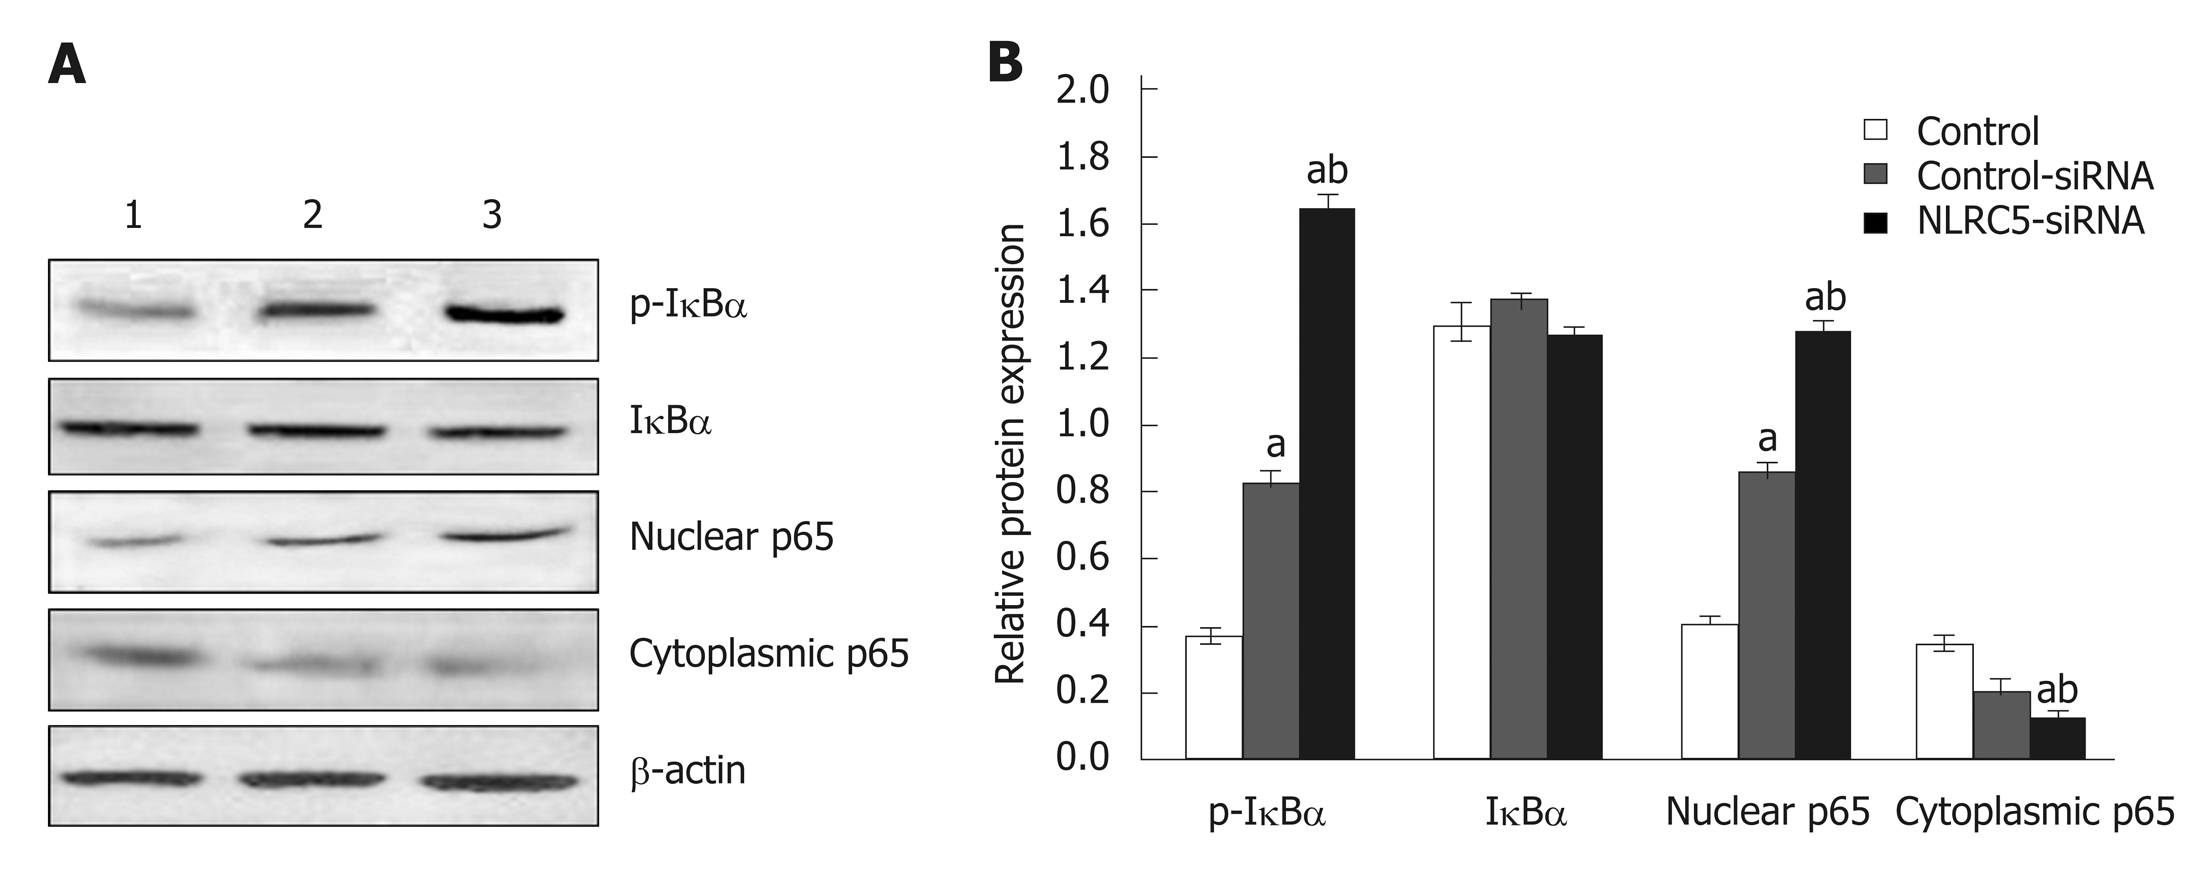
Figure 9 Effect of NLRC5 on nuclear factor-κB activity in LX-2 cells.
A: Western blot; B: Quantification of Western blot. Lane 1: Control; Lane 2: LX-2 cells transfected with NLRC5-siRNA; Lane 3: LX-2 cells transfected with control-siRNA; aP < 0.05 vs control; bP < 0.05 vs NLRC5-siRNA.
- Citation: Zhang YZ, Yao JN, Zhang LF, Wang CF, Zhang XX, Gao B. Effect of NLRC5 on activation and reversion of hepatic stellate cells by regulating the nuclear factor-κB signaling pathway. World J Gastroenterol 2019; 25(24): 3044-3055
- URL: https://www.wjgnet.com/1007-9327/full/v25/i24/3044.htm
- DOI: https://dx.doi.org/10.3748/wjg.v25.i24.3044


