Copyright
©The Author(s) 2019.
World J Gastroenterol. Apr 14, 2019; 25(14): 1697-1714
Published online Apr 14, 2019. doi: 10.3748/wjg.v25.i14.1697
Published online Apr 14, 2019. doi: 10.3748/wjg.v25.i14.1697
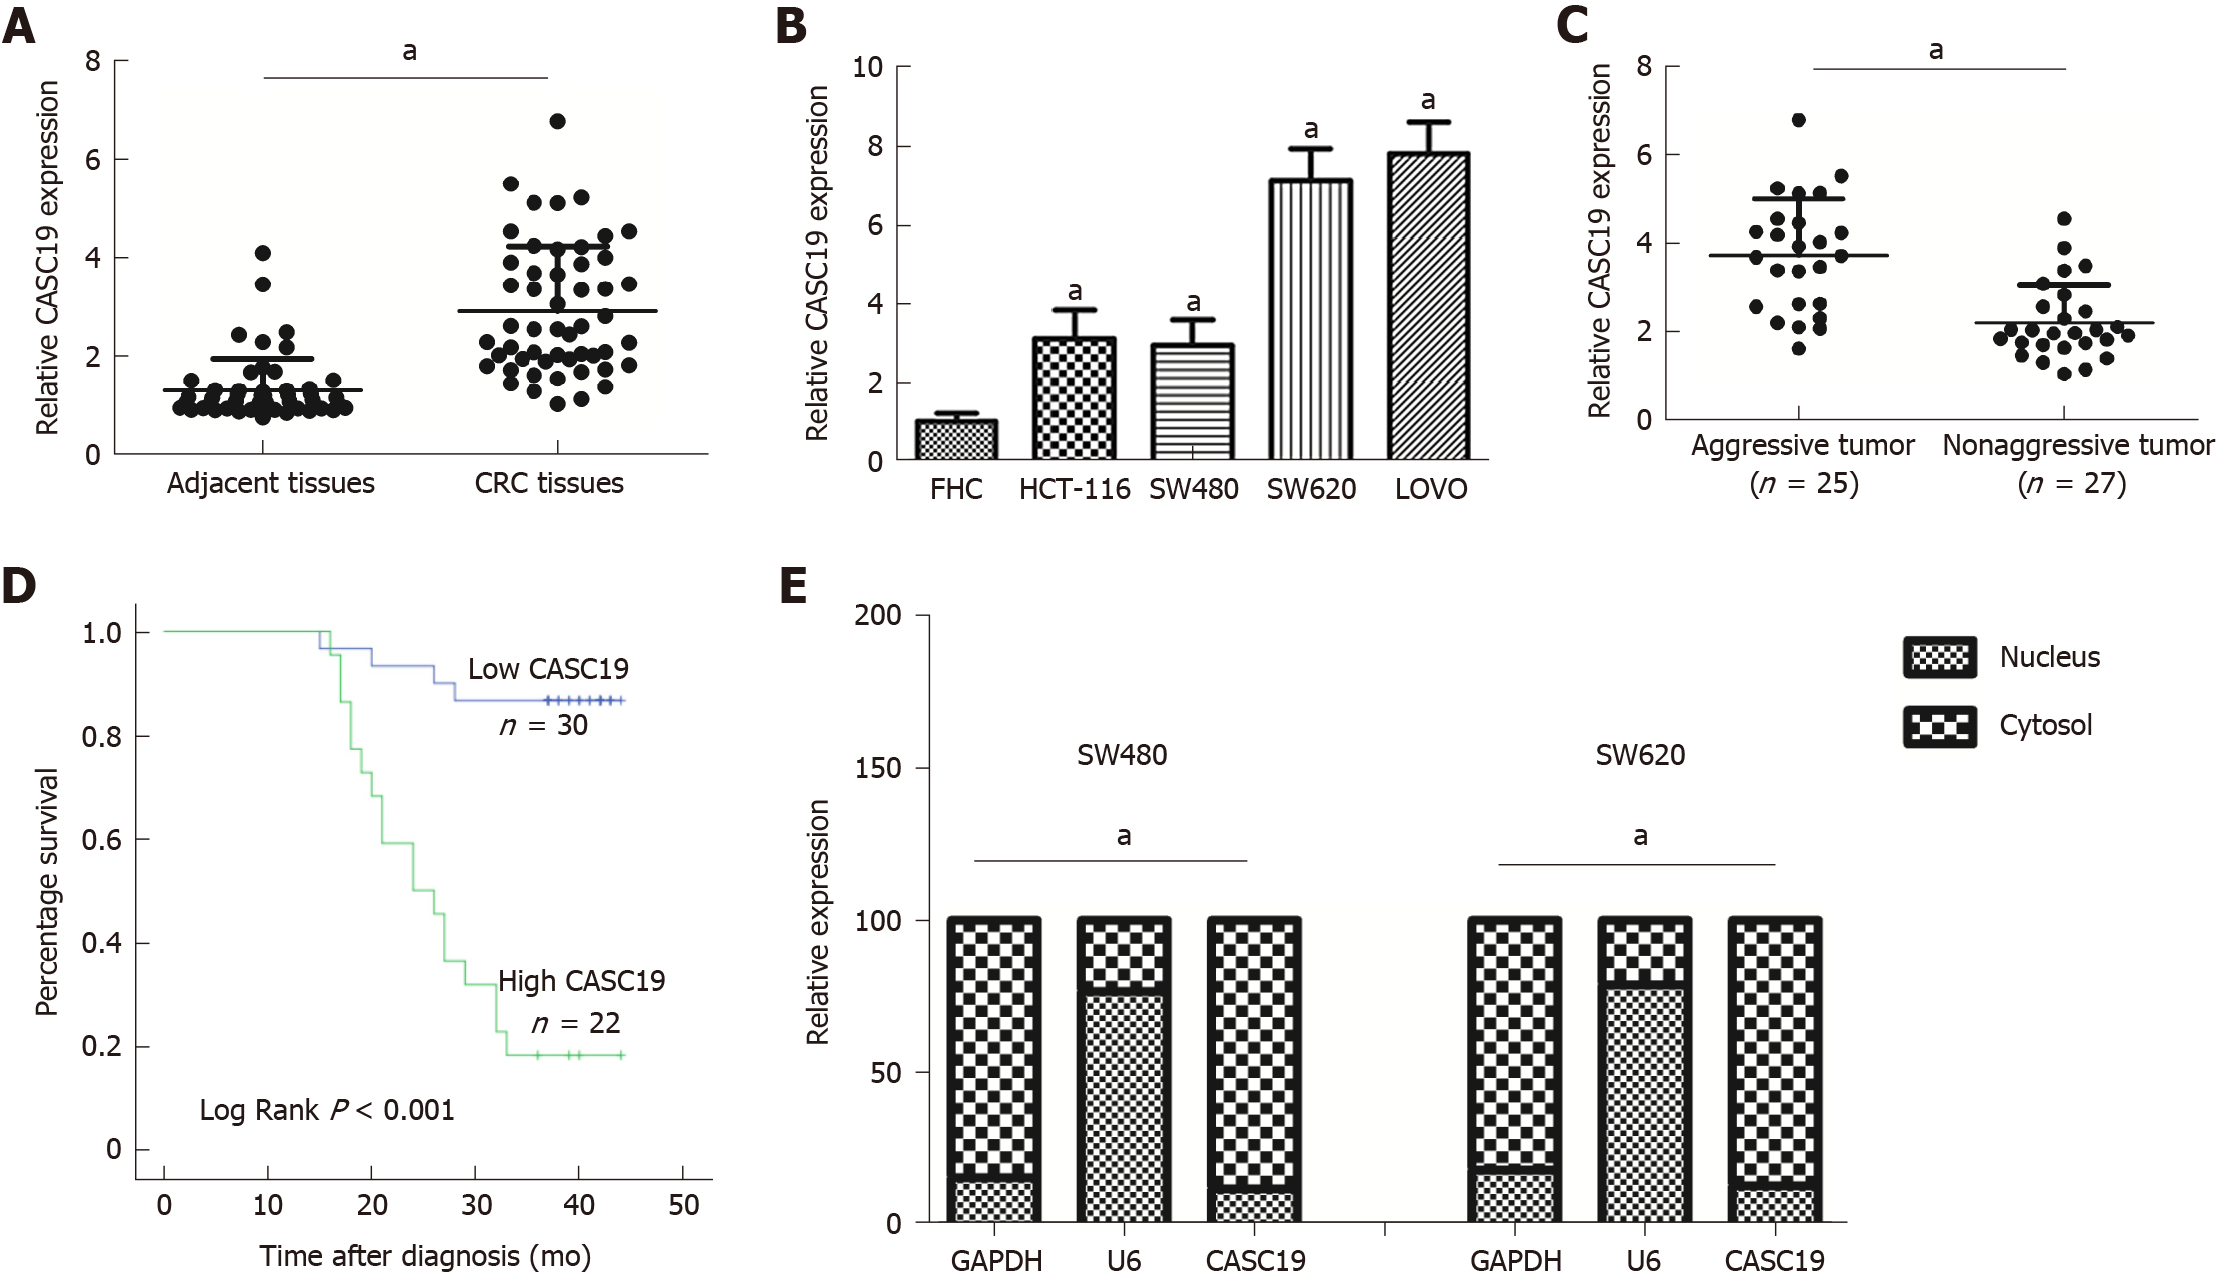
Figure 1 Differential expression of cancer susceptibility 19 in colorectal cancer tissues and cell lines.
A: Differential cancer susceptibility 19 (CASC19) expression in CRC tissues and adjacent normal colon mucosa tissues. B: Differential CASC19 expression in colorectal cancer (CRC) cell lines and FHC cells. C: Differential CASC19 expression in aggressive tumor tissue samples and nonaggressive tumor tissue samples. D: Kaplan-Meier analyses of the correlations between CASC19 and overall survival of 52 patients with CRC. E: Cellular localization of CASC19 in CRC cells. Data are reported as the mean ± SD. aP < 0.05. CASC19: Cancer susceptibility 19; CRC: Colorectal cancer.
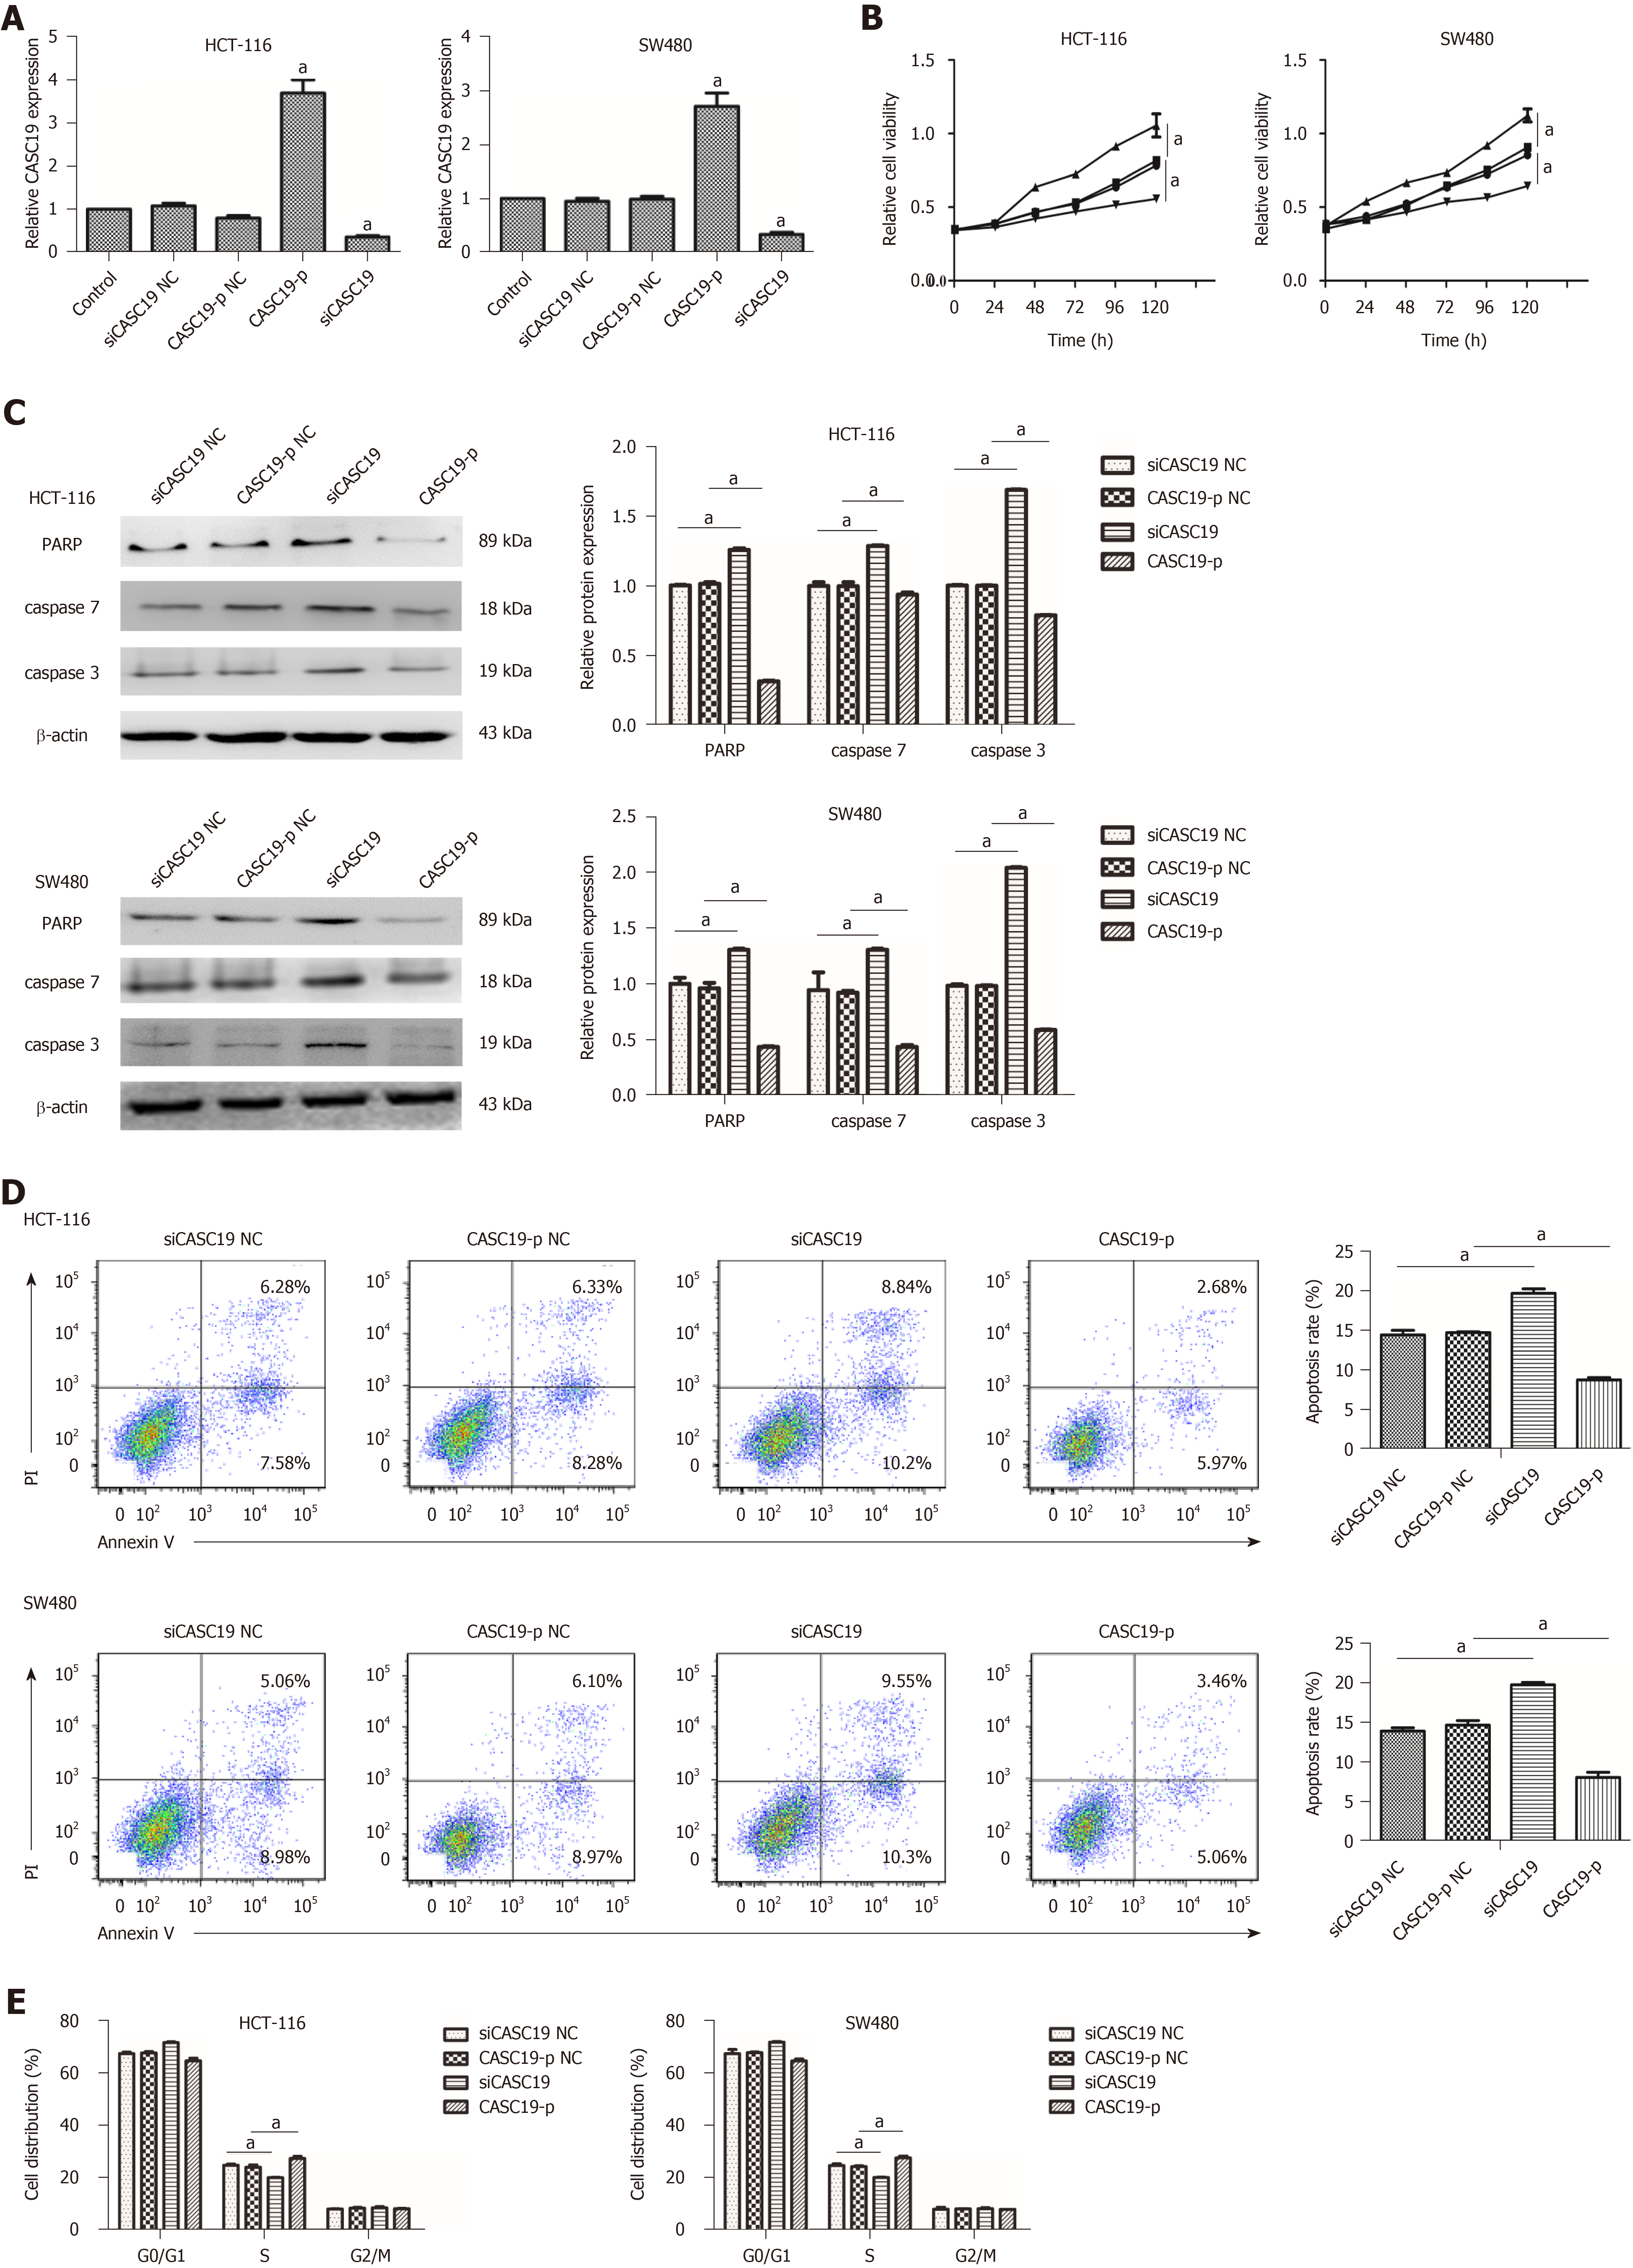
Figure 2 Role of cancer susceptibility 19 in the proliferation and migration of colorectal cancer cells.
A: Expression of cancer susceptibility 19 (CASC19) in colorectal cancer (CRC) cells transfected with siCASC19 or CASC19-p and their NCs was quantified by quantitative real-time PCR. B: Growth curves of HCT-116 and SW480 cell lines that were transfected with CASC19-p or siCASC19 were analyzed using the Cell Counting Kit-8 assay. C: Western blot was used to determine the expression of caspase 3, caspase 7, and PARP in HCT-116 and SW480 cells that were transfected with either CASC19-p or siCASC19. The grayscale value of proteins was measured with Image J. D: Cell apoptosis rate was detected by flow cytometry after transfection with CASC19-p or siCASC19. E: The proportion of cells in each cell cycle phase was detected using flow cytometry after cells were transfected with CASC19-p or siCASC19. Data are reported as the mean ± SD. aP < 0.05. CASC19: Cancer susceptibility 19; CRC: Colorectal cancer.
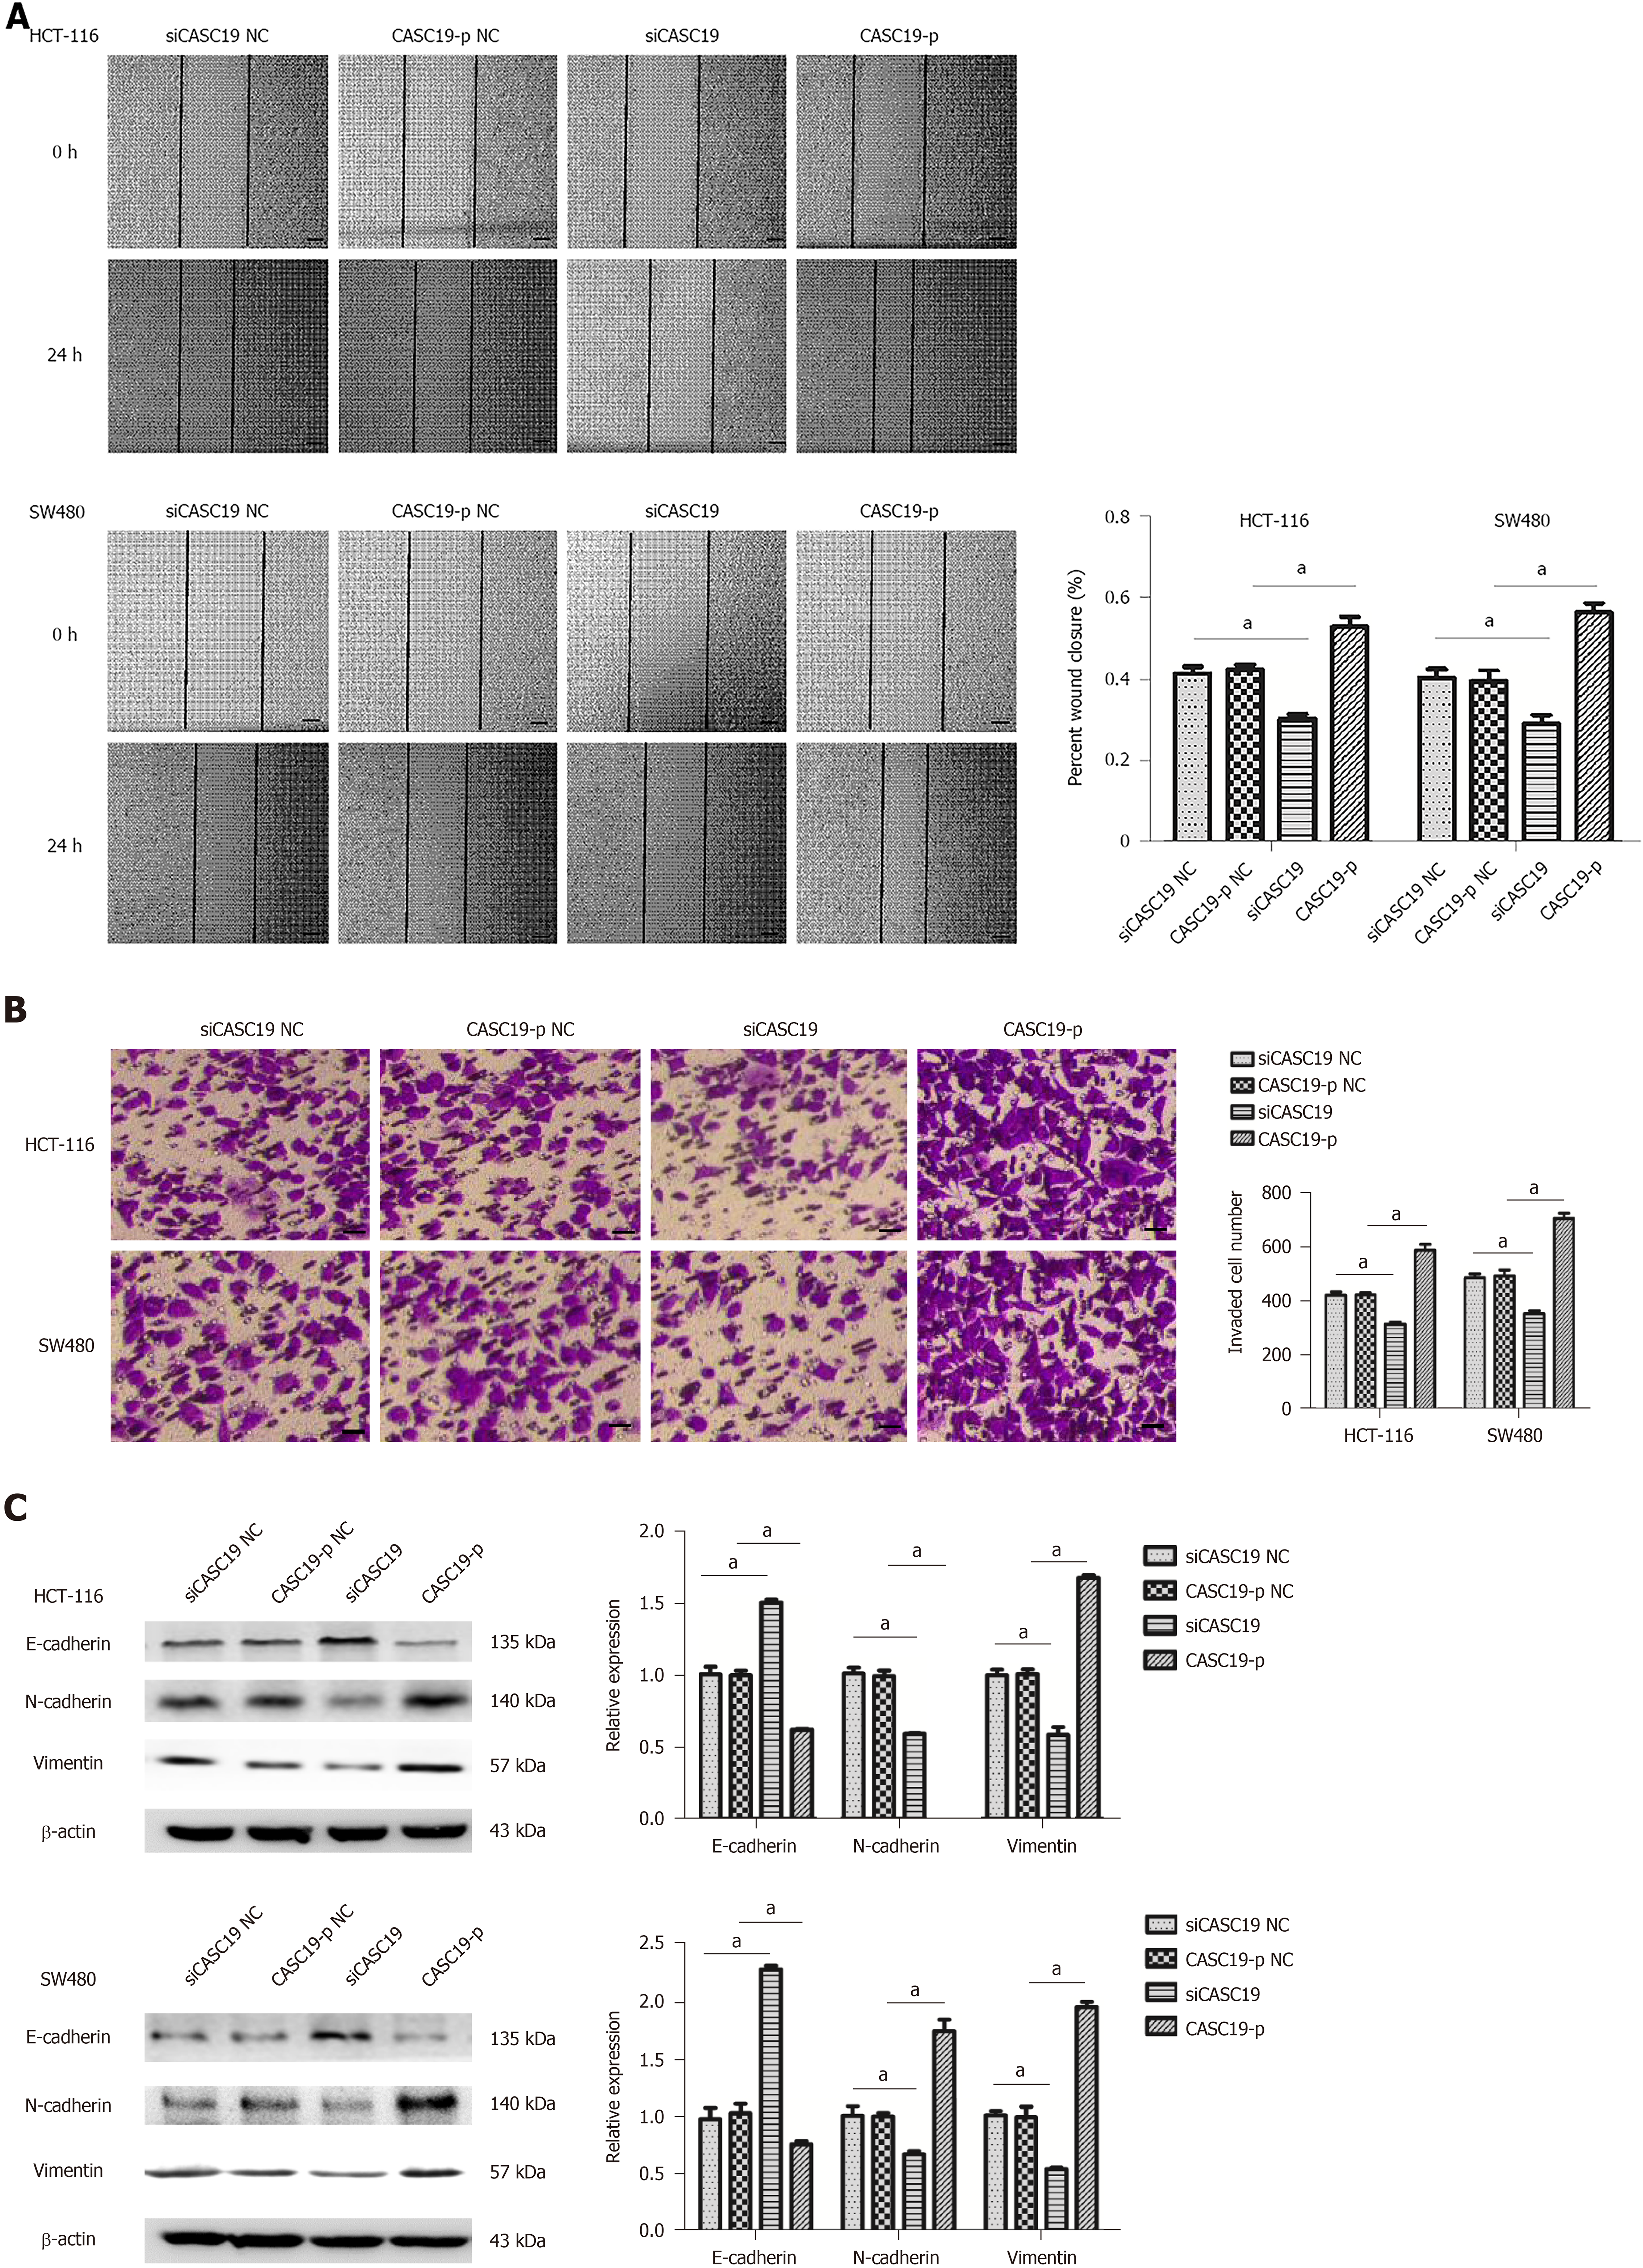
Figure 3 Role of cancer susceptibility 19 in the cell migration, invasion, and epithelial-mesenchymal transition in colorectal cancer cells.
A: The migration abilities of SW480 and HCT-116 cells were analyzed by wound-healing assay after the cells were transfected with CASC19-p or siCASC19. Scale bars = 100 μm. B: The invasion abilities of SW480 and HCT-116 were determined by transwell assay after the cells were transfected with CASC19-p or siCASC19. Scale bars = 20 μm. C: The expression of vimentin, N-cadherin, and E-cadherin in HCT-116 and SW480 cells was detected by Western blot after transfection with CASC19-p or siCASC19. The grayscale value of protein was measured with Image J. Data are reported as the mean ± SD. aP < 0.05. CASC19: Cancer susceptibility 19.
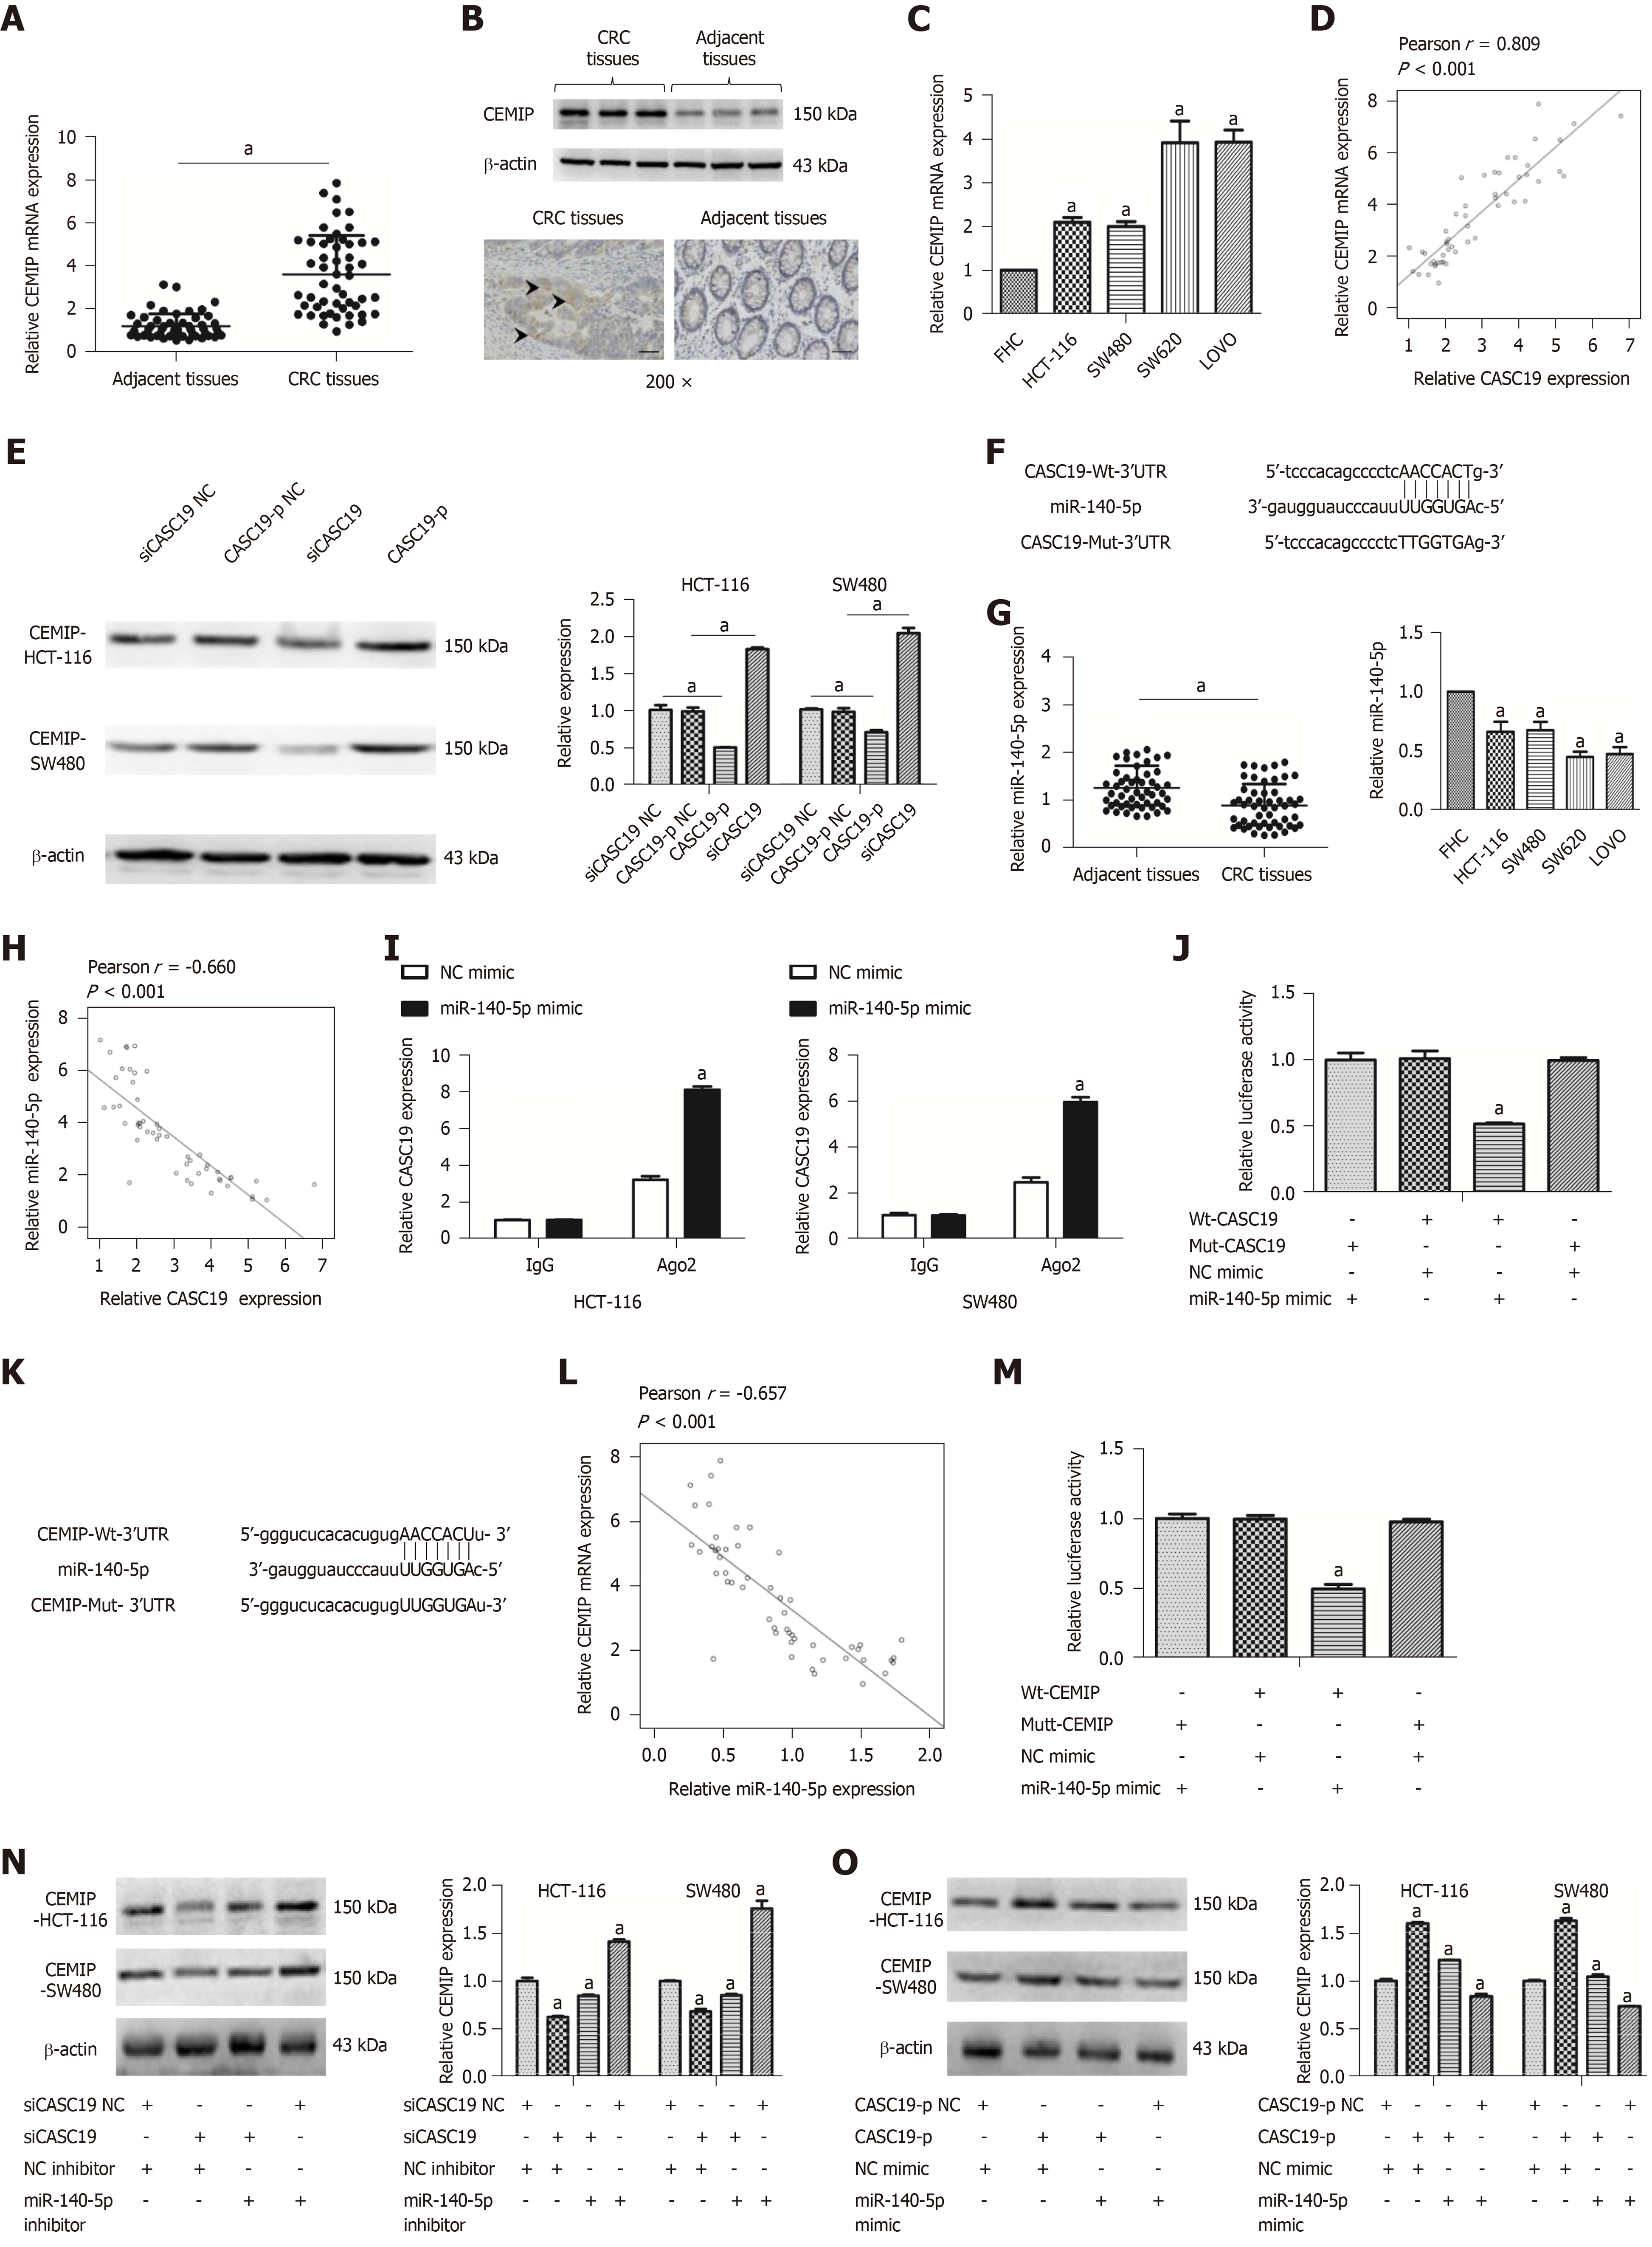
Figure 4 Cancer susceptibility 19 acts as a competing endogenous RNA by sponging miR-140-5p to regulate cell migration inducing hyaluronidase 1 expression.
A: Differential mRNA expression of cell migration inducing hyaluronidase 1 (CEMIP) in colorectal cancer (CRC) tissues and adjacent healthy colonic mucosa tissues was determined by quantitative real-time PCR (qRT-PCR). B: Differential protein expression of CEMIP in CRC tissues and adjacent healthy colonic mucosa tissues was analyzed using Western blot and immunochemistry. C: Differential mRNA expression of CEMIP in CRC cell lines and FHC cells was determined by qRT-PCR. D: Cancer susceptibility 19 (CASC19) and CEMIP correlated positively in CRC tissues, based on Pearson’s correlation curve. E: Protein expression of CEMIP in SW480 and HCT-116 cells was determined by Western blot after transfection with CASC19-p or siCASC19. The grayscale value of protein was measured with Image J. F: Predicted binding sites of miR-140-5p in the CASC19 sequence. G: Differential expression of miR-140-5p in CRC tissues and adjacent healthy colonic mucosa tissues, CRC cell lines, and FHC cells was determined by qRT-PCR. H: CASC19 and miR-140-5p correlated negatively in CRC tissues, as determined by Pearson’s correlation curve. I: RNA-IP was performed in SW480 and HCT-116 cells and CASC19 expression was determined by qRT-PCR. J: Luciferase reporter assay verified miR-140-5p to be a direct target of CASC19. K: Predicted binding sites of miR-140-5p in the CEMIP mRNA sequence. L: CEMIP and miR-140-5p correlated negatively in CRC tissues, based on Pearson’s correlation curve. M: Luciferase reporter assay verified CEMIP to be a direct target of miR-140-5p. N: CEMIP expression in SW480 and HCT-116 cells transfected with miR-140-5p mimic or siCASC19 was determined by Western blot and qRT-PCR. O: The expression of CEMIP in SW480 and HCT-116 cells transfected with miR-140-5p inhibitor or CASC19-p was determined by Western blot and qRT-PCR. Data are reported as the mean ± SD. aP < 0.05. CASC19: Cancer susceptibility 19; CRC: Colorectal cancer; CEMIP: Cell migration inducing hyaluronidase 1.
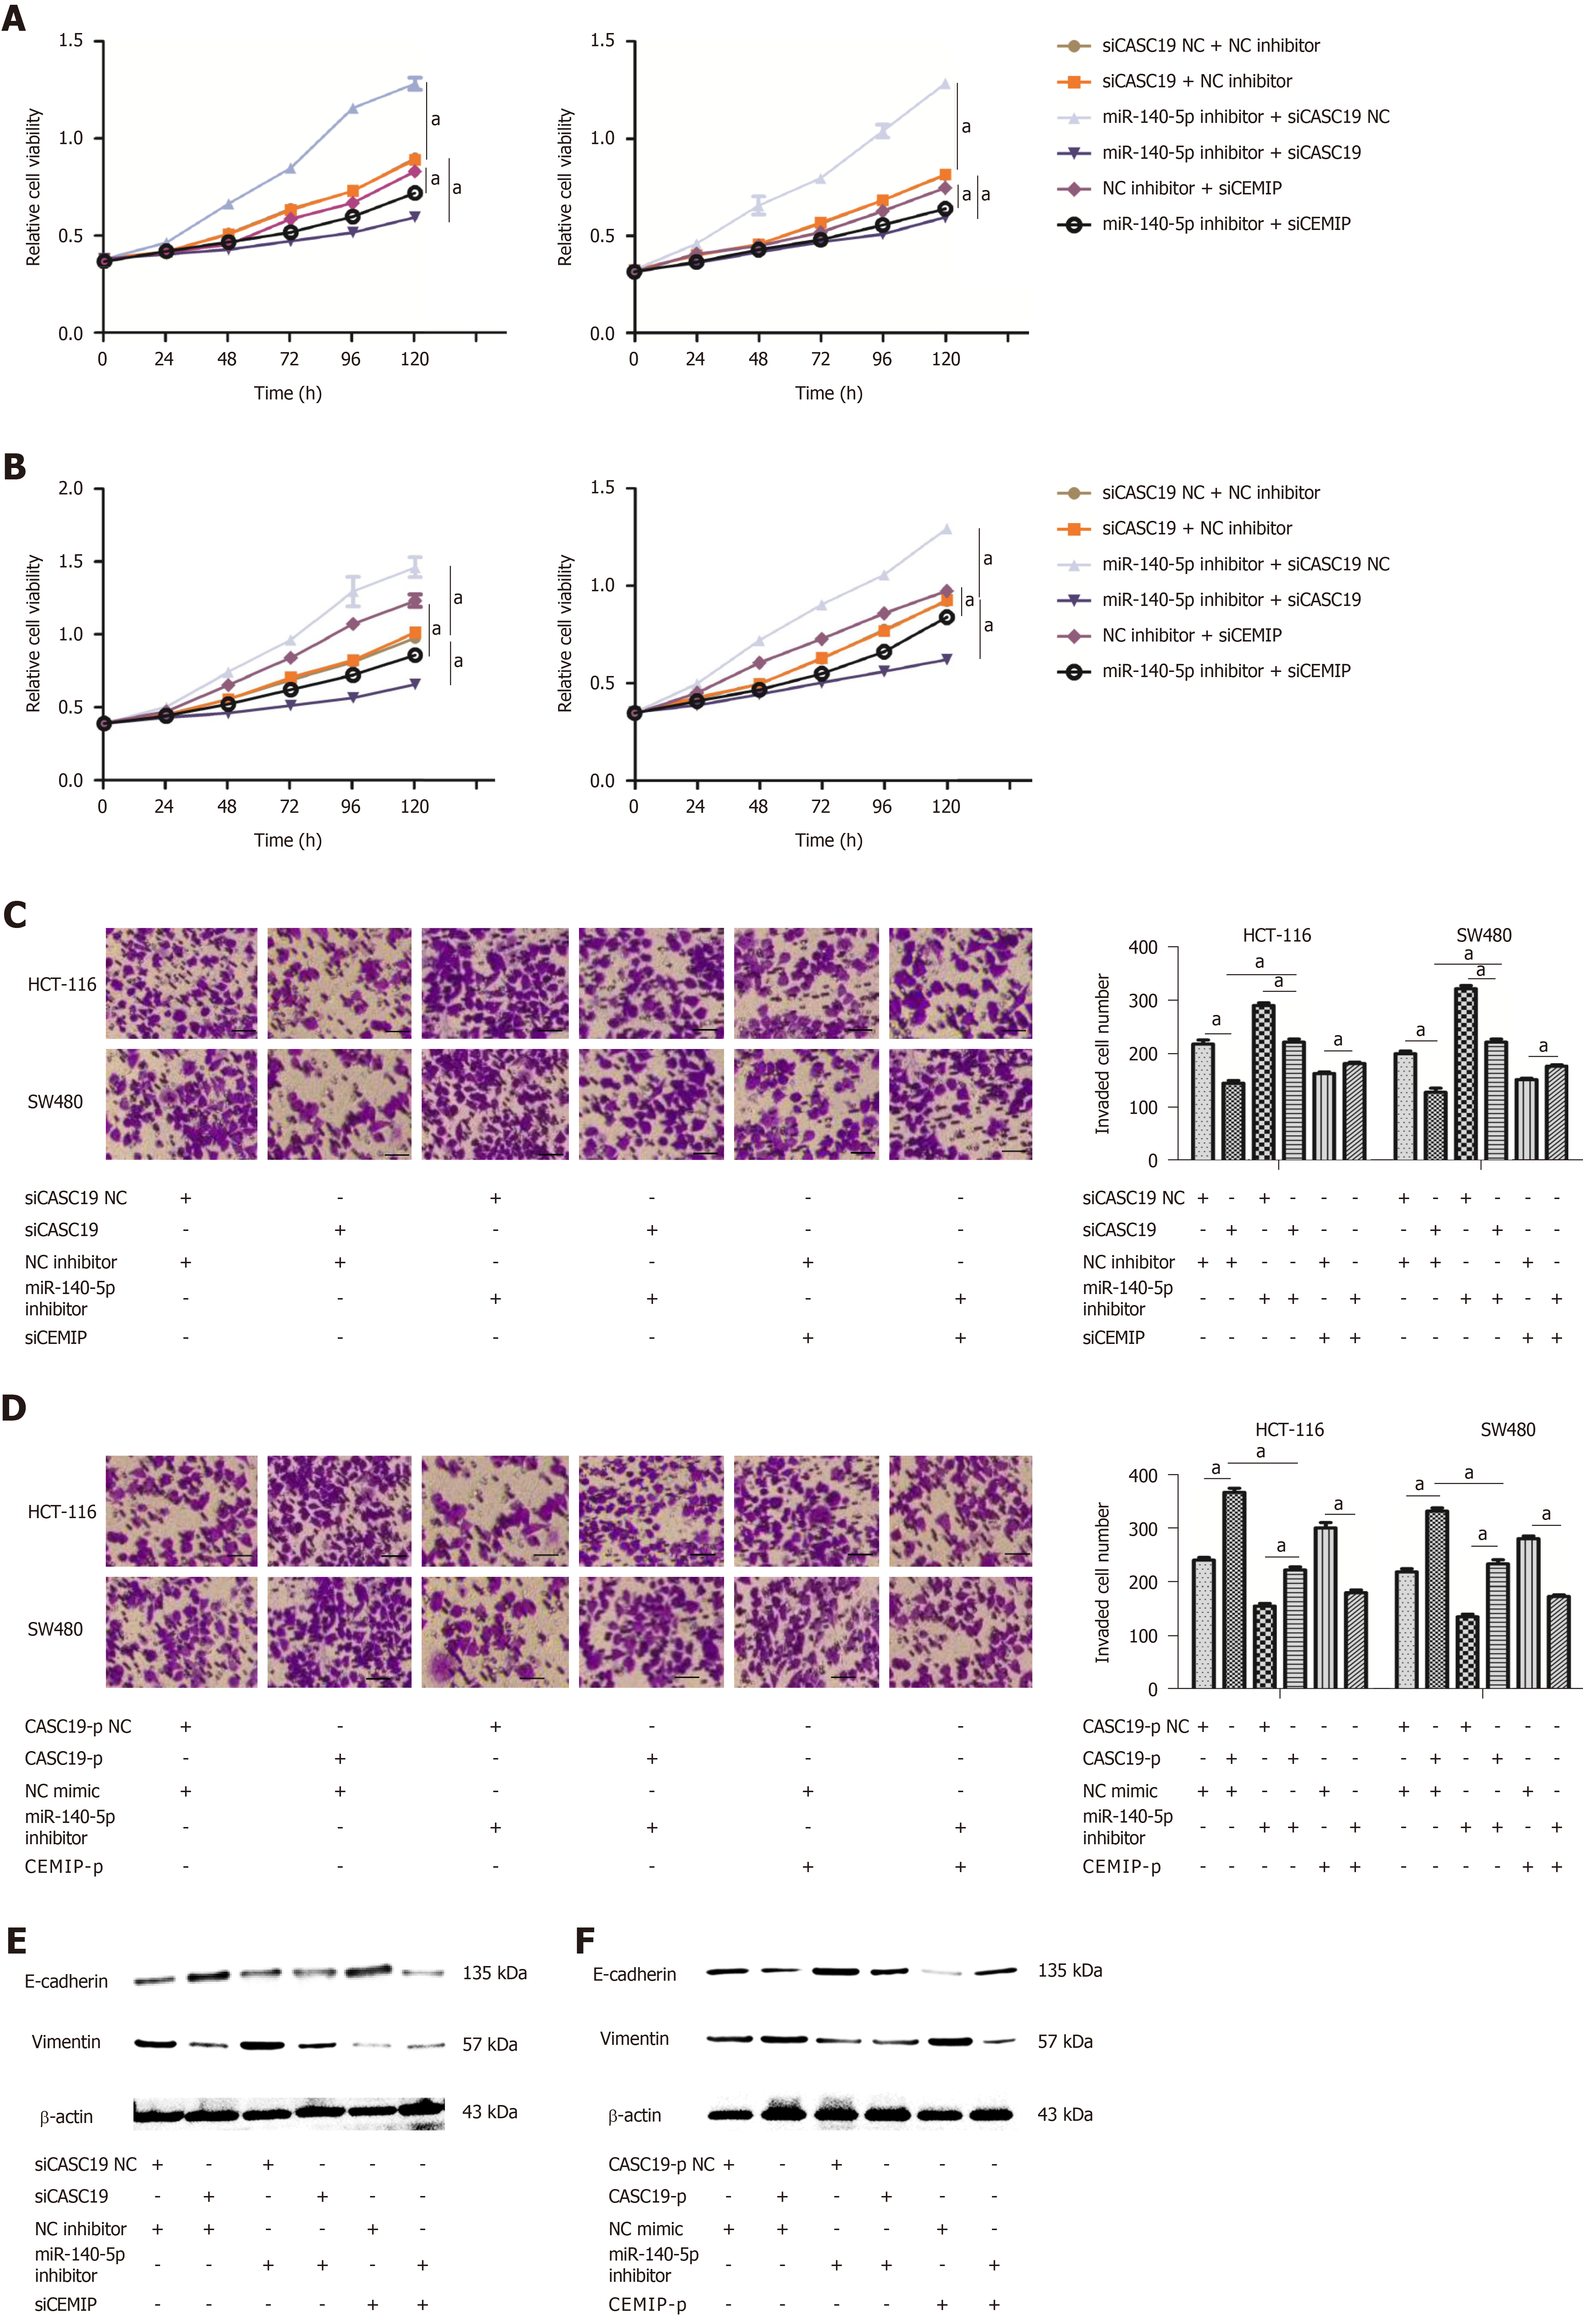
Figure 5 MiR-140-5p suppresses cancer susceptibility 19-induced enhancement of colorectal cancer cell proliferation and metastasis.
A: Growth curves of SW480 and HCT-116 cell lines after being transfected by either miR-140-5p inhibitor or siCASC19 were determined by the Cell Counting Kit-8 (CCK-8) assay. B: Growth curves of SW480 and HCT-116 cell lines after being transfected by either miR-140-5p mimic or CASC19-p were analyzed by the CCK-8 assay. C: The number of invading HCT-116 and SW480 cells was determined by transwell assay after being transfected by either miR-140-5p inhibitor or siCASC19. Scale bars = 20 μm. D: The number of invading HCT-116 and SW480 cells was determined by transwell assay after being transfected with either miR-140-5p mimic or CASC19-p. Scale bars = 20 μm. E: The expression of E-cadherin and vimentin in CRC cells was determined by Western blot after being transfected by either miR-140-5p inhibitor or siCASC19. F: The expression of E-cadherin and vimentin in CRC cells was determined by Western blot after being transfected with either miR-140-5p mimic or CASC19-p. Data are reported as the mean ± SD. aP < 0.05. CASC19: Cancer susceptibility; CRC: Colorectal cancer; CEMIP: Cell migration inducing hyaluronidase 1.
- Citation: Wang XD, Lu J, Lin YS, Gao C, Qi F. Functional role of long non-coding RNA CASC19/miR-140-5p/CEMIP axis in colorectal cancer progression in vitro. World J Gastroenterol 2019; 25(14): 1697-1714
- URL: https://www.wjgnet.com/1007-9327/full/v25/i14/1697.htm
- DOI: https://dx.doi.org/10.3748/wjg.v25.i14.1697


